

fb5ab40282cc3790c6a8183851366ebd.ppt
- Количество слайдов: 54
 dating") Datování vzorků pomocí metod jaderné fyziky Radiometric (radioactive) dating
Datování vzorků pomocí metod jaderné fyziky Radiometric (radioactive) dating
 • Založeno na rozpadovém zákonu • V případě pouze 2 izotopů •") Datování (1) • Založeno na rozpadovém zákonu • V případě pouze 2 izotopů • V případě celé řady izotopů - řešení soustavy
Datování (1) • Založeno na rozpadovém zákonu • V případě pouze 2 izotopů • V případě celé řady izotopů - řešení soustavy
 Radioactive Product Types of radiometric dating: Isotope (Daughter) argon-argon (Ar-Ar) (Parent) fission") Datování (2) Radioactive Product Types of radiometric dating: Isotope (Daughter) argon-argon (Ar-Ar) (Parent) fission track dating helium (He-He) Samarium-147 Neodymium-143 iodine-xenon (I-Xe) Rubidium-87 Strontium-87 lanthanum-barium (La-Ba) Rhenium-187 Osmium-187 lead-lead (Pb-Pb) lutetium-hafnium (Lu-Hf) Lutetium-176 Hafnium-176 neon-neon (Ne-Ne) Thorium-232 Lead-208 termoluminscence/optically Lead-206 stimulated luminescence dating Uranium-238 potassium-argon (K-Ar) Potassium-40 Argon-40 radiocarbon dating Uranium-235 Lead-207 rhenium-osmium (Re-Os) Beryllium-10 Boron-10 rubidium-strontium (Rb-Sr) samarium-neodymium (Sm-Nd) Chlorine-36 Argon-36 uranium-lead (U-Pb) Carbon-14 Nitrogen-14 uranium-lead-helium (U-Pb-He) Uranium-234 Thorium-230 uranium-thorium (U-Th) uranium-uranium (U-U) Thorium-230 Radium-226 (wikipedia) Half-Life (Years) 106 billion 48. 8 billion 42 billion 38 billion 14 billion 4. 5 billion 1. 26 billion 0. 7 billion 1. 52 million 300, 000 5715 248, 000 75, 400 Some Naturally Occurring Radioactive Isotopes and their half-lives
Datování (2) Radioactive Product Types of radiometric dating: Isotope (Daughter) argon-argon (Ar-Ar) (Parent) fission track dating helium (He-He) Samarium-147 Neodymium-143 iodine-xenon (I-Xe) Rubidium-87 Strontium-87 lanthanum-barium (La-Ba) Rhenium-187 Osmium-187 lead-lead (Pb-Pb) lutetium-hafnium (Lu-Hf) Lutetium-176 Hafnium-176 neon-neon (Ne-Ne) Thorium-232 Lead-208 termoluminscence/optically Lead-206 stimulated luminescence dating Uranium-238 potassium-argon (K-Ar) Potassium-40 Argon-40 radiocarbon dating Uranium-235 Lead-207 rhenium-osmium (Re-Os) Beryllium-10 Boron-10 rubidium-strontium (Rb-Sr) samarium-neodymium (Sm-Nd) Chlorine-36 Argon-36 uranium-lead (U-Pb) Carbon-14 Nitrogen-14 uranium-lead-helium (U-Pb-He) Uranium-234 Thorium-230 uranium-thorium (U-Th) uranium-uranium (U-U) Thorium-230 Radium-226 (wikipedia) Half-Life (Years) 106 billion 48. 8 billion 42 billion 38 billion 14 billion 4. 5 billion 1. 26 billion 0. 7 billion 1. 52 million 300, 000 5715 248, 000 75, 400 Some Naturally Occurring Radioactive Isotopes and their half-lives
 Metody datování • Metody gelogického datování – draslíko-argonová – rubidium-stronciová, olovo-olověná – uran-thoriová – Dráhy štěpných trosek • Datování vzorků vzniklých lidskou činností – Radiouhlíková – Termoluminiscenční a opticky stimulovaná luminiscence
 Poměr některých izotopů
 • K-Ar dating is a method used in many geoscience disciplines.") Draslíko-argonová metoda (1) • K-Ar dating is a method used in many geoscience disciplines. It is based on measuring the products of the RA decay of K – 39 K (93. 2581%), 40 K (0. 0117%), 41 K (6. 7302%). • 40 Ca is the most common form of Ca – the increase in abundance due to K decay results in a negligible increase in total abundance. The 40 Ar isotope is much less abundant - a more useful. • Whereas argon is a gas, it is able to escape from molten rock. However, when the rock solidifies, the decayed 40 Ar will begin to accumulate in the crystal lattices. The ratio between the 40 Ar and the 40 K is related to the time elapsed since the rock was cool enough to trap the Ar.
Draslíko-argonová metoda (1) • K-Ar dating is a method used in many geoscience disciplines. It is based on measuring the products of the RA decay of K – 39 K (93. 2581%), 40 K (0. 0117%), 41 K (6. 7302%). • 40 Ca is the most common form of Ca – the increase in abundance due to K decay results in a negligible increase in total abundance. The 40 Ar isotope is much less abundant - a more useful. • Whereas argon is a gas, it is able to escape from molten rock. However, when the rock solidifies, the decayed 40 Ar will begin to accumulate in the crystal lattices. The ratio between the 40 Ar and the 40 K is related to the time elapsed since the rock was cool enough to trap the Ar.
 • Due to the long half-life, the technique is most applicable") Draslíko-argonová metoda (2) • Due to the long half-life, the technique is most applicable for dating minerals and rocks >100, 000 years old. Although it finds the most utility in geological applications, it plays an important role also in archaeology. • In order to determine the 40 Ar content of a rock, it must be melted and the isotopic composition of the released gas measured via mass spectrometry. It is also necessary to separately measure the amount of 40 K in the sample. This can be measured using flame photometry (determination of amount of K and use of known isototopic composition) or atomic absorption spectroscopy. • • A problem with K-Ar dating is that if there is a heterogenity in the sample, then the aliquots used for determining K concentrations and 40 Ar abundances may have different K/Ar. This can lead to an inaccurate date. • Ar se může do vzorku dostat i stykem s atmosférou – lze odhadnout pomocí měření příměsi 36 Ar ve vzorku a známého izotopického složeni Ar. 36 Ar se do vzorku nemůže dostat jinak. • „Jednoduchá“ metoda, ale otázka přesnosti
Draslíko-argonová metoda (2) • Due to the long half-life, the technique is most applicable for dating minerals and rocks >100, 000 years old. Although it finds the most utility in geological applications, it plays an important role also in archaeology. • In order to determine the 40 Ar content of a rock, it must be melted and the isotopic composition of the released gas measured via mass spectrometry. It is also necessary to separately measure the amount of 40 K in the sample. This can be measured using flame photometry (determination of amount of K and use of known isototopic composition) or atomic absorption spectroscopy. • • A problem with K-Ar dating is that if there is a heterogenity in the sample, then the aliquots used for determining K concentrations and 40 Ar abundances may have different K/Ar. This can lead to an inaccurate date. • Ar se může do vzorku dostat i stykem s atmosférou – lze odhadnout pomocí měření příměsi 36 Ar ve vzorku a známého izotopického složeni Ar. 36 Ar se do vzorku nemůže dostat jinak. • „Jednoduchá“ metoda, ale otázka přesnosti
 Argon-argonová metoda • A problem with K-Ar dating is that if there is a heterogenity in the sample, then the aliquots used for determining K concentrations and 40 Ar abundances may have different K/Ar. • 40 Ar/39 Ar is a similar technique which measures the isotopic content of the sample, so this problem can be avoided • prior to measurement in a mass spectrometer, the sample is irradiated in a nuclear reactor with high-energy neutrons and some of the 39 K is converted to 39 Ar – (n, p) reaction. The relative abundance of 40 Ar/39 Ar can be measured in the sample. This is an advantage over K-Ar dating, where the K and Ar must be measured separately. But the reaction cross section for must be accurately known 39 K(n, p)39 Ar. (… also amount of 40 Ar should be affected by this reaction but this is probably negligible) • Both Ar isotopes of interest come from K in this case - the same part of a sample can be used
 Metoda izochron: Rb-Sr metoda Není problém určit stáří, jestliže • množství dceřinného izotopu v době vzniku je nulové (nebo se ví, jak komplenzovat) • Žádný mateřský, ani dceřinný izotop vnikl do/unikl ze vzorku od vzniku vzorku Jinak je problém používá se metoda izochron • Datování velmi starých hornin • Předpoklad: N(86 Sr(t=0)) = N(86 Sr(t)) kde A = 87 Rb, B = 87 Sr (t)
 • Máme-li různé vzorky, které vznikly ve stejné době a měli") Metoda izochron (t) • Máme-li různé vzorky, které vznikly ve stejné době a měli stejný počáteční poměr q (stejná „hornina“ – láva z níž krystalizovaly), v rovině (x, y) -> lze určit k (směrnice přímky) a tím i čas t • Lze použít pro horniny, které obsahují různé minerály (v nich se počáteční poměr Sr/Rb liší) a žádné Sr, ani Rb z nich neuniklo
Metoda izochron (t) • Máme-li různé vzorky, které vznikly ve stejné době a měli stejný počáteční poměr q (stejná „hornina“ – láva z níž krystalizovaly), v rovině (x, y) -> lze určit k (směrnice přímky) a tím i čas t • Lze použít pro horniny, které obsahují různé minerály (v nich se počáteční poměr Sr/Rb liší) a žádné Sr, ani Rb z nich neuniklo
 Příklady Metoda izochron aplikovaná na jiné izotopy – Pb-Pb metoda (stáří sluneční soustavy – viz několik následujících stránek)
 Příklady – Pb-Pb metoda 204 Pb nevzniká v žádné rozpadové řadě, zatímco 206 Pb a 207 Pb ano P – present I – initial Pro „izolovaný“ systém lze vydělením dostat: Dnešní poměr 238 U/235 U Někdy je lepší U-Pb metoda (vynáší se poměr 206 Pb/238 U a 207 Pb/235 U), ale Pb-Pb metoda vhodná např. k určení stáří sluneční soustavy
 Rovnováha ustavena poměrně brzy Doby života všech izotopů vznikajících z rozpadu U jsou maximálně stovky tisíc let … rovnováha mezi U a Pb ustavena určitě během milionů let
 Arizona were") Stáří sluneční soustavy Samples of Fe meteorite from Canyon Diablo (Meteor Crater) Arizona were found to have the least radiogenic composition of any material in the solar system. The U/Pb ratio was so low that no radiogenic decay was detected in the isotopic composition. This point defines the lower (left) end of the isochron. The development of the Geochron was mainly attributed to C. C. Patterson’s application of Pb-Pb dating on meteorites in 1956. The Pb ratios of three stony and two iron meteorites were measured. The dating of meteorites would then help Patterson in determining not only the age of these meteorites but also the age of Earth’s formation. https: //en. wikipedia. org/wiki/Lead-lead_dating Troilite (Fe. S) found in Canyon Diablo represents the primeval lead isotope composition of the solar system, dating back to 4. 55 +/- 0. 07 Byr. Patterson, C. C. (1956). Age of meteorites and the Earth. Geochim. Cosmochim. Acta 10, 230 -7.
Stáří sluneční soustavy Samples of Fe meteorite from Canyon Diablo (Meteor Crater) Arizona were found to have the least radiogenic composition of any material in the solar system. The U/Pb ratio was so low that no radiogenic decay was detected in the isotopic composition. This point defines the lower (left) end of the isochron. The development of the Geochron was mainly attributed to C. C. Patterson’s application of Pb-Pb dating on meteorites in 1956. The Pb ratios of three stony and two iron meteorites were measured. The dating of meteorites would then help Patterson in determining not only the age of these meteorites but also the age of Earth’s formation. https: //en. wikipedia. org/wiki/Lead-lead_dating Troilite (Fe. S) found in Canyon Diablo represents the primeval lead isotope composition of the solar system, dating back to 4. 55 +/- 0. 07 Byr. Patterson, C. C. (1956). Age of meteorites and the Earth. Geochim. Cosmochim. Acta 10, 230 -7.
 Stáří sluneční soustavy Stony meteorites however, exhibited very high 207 Pb/204 Pb versus 206 Pb/204 Pb ratios, indicating that these samples came from the crust or mantle of the planetesimal. Together, these samples define an isochron, whose slope gives the age of meteorites as 4. 55 Byr. Patterson also analyzed terrestrial sediment collected from the ocean floor, which was believed to be representative of the Bulk Earth composition. Because the isotope composition of this sample plotted on the meteorite isochron, it suggested that earth had the same age and origin as meteorites, therefore solving the age of the Earth and giving rise to the name 'geochron'. Lead isotope isochron diagram used by C. C. Patterson to determine the age of the Earth in 1956. Animation shows progressive growth over 4550 million years (Myr) of the lead isotope ratios for two stony meteorites (Nuevo Laredo and Forest City) from initial lead isotope ratios matching those of the Canyon Diablo iron meteorite.
 Stáří sluneční soustavy Pb-Pb isochrons for the oldest known material in the solar system (meteorites) Connelly, J. N. , Bizzarro, M. , Krot, A. N. , Nordlund, A. , Wielandt, D. , and M. A. (2012). The absolute chronology and thermal processing of solids in the solar protoplanetary disk. Science, 338: 651 – 655 https: //en. wikipedia. org/wiki/Lead-lead_dating The oldest rocks on Earth, found in western Greenland, have been dated by four independent radiometric dating methods at 3. 7 -3. 8 billion years.
 Stáří sluneční soustavy Statistics for several meteorites that have undergone isochron dating are as follows: 1. St. Severin (ordinary chondrite) 1. Pb-Pb isochron 4. 543 ± 0. 019 GY 2. Sm-Nd isochron 4. 55 ± 0. 33 GY 3. Rb-Sr isochron 4. 51 ± 0. 15 GY 4. Re-Os isochron 4. 68 ± 0. 15 GY 1. Pb-Pb isochron 4. 556 ± 0. 012 GY 2. Pb-Pb isochron 4. 540 ± 0. 001 GY 3. Sm-Nd isochron 4. 56 ± 0. 08 GY 4. Rb-Sr isochron 4. 50 ± 0. 07 GY 1. Pb-Pb isochron 4. 553 ± 0. 004 GY 2. Ar-Ar age spectrum 4. 52 ± 0. 02 GY 3. Ar-Ar age spectrum 4. 55 ± 0. 03 GY 4. Ar-Ar age spectrum 4. 56 ± 0. 05 GY 2. Juvinas (basaltic achondrite) 3. Allende (carbonaceous chondrite) Dalrymple, Brent G. (2004). "Ancient Earth, Ancient Skies: The Age of the Earth and Its Cosmic Surroundings". Stanford University Press. pp. 147, 169 Stáří vesmíru – dost dobře nelze pomocí radioanalytických metod určit
 Uran-thoriová metoda • U je částečně rozpustný ve vodě -> všechny materiály vzniklé z vody obsahují stopy U (10 -9 -10 -6 hmotnostních). • Th naopak není rozpustné za „rozumných“ podmínek blízko povrchu (lze použít např. ke stanovení stáří krápníků) • Rovnováha mezi 238 U a 234 U nastolena asi po 250 000 let od produkce 238 U (měření na Zemi bez problémů) – poté už je A(238 U) = A(234 U) • Pak • Pokud : • Neměří se stabilní izotop, ale rozpadající se 230 Th – horní mez asi 500 000 (možná spíše 300 000) let, pak už nastolena rovnováha mezi Th a U (dáno dobou života Th); nejkratší doby asi 10 000 let
 Uran-thoriová metoda • U-Th technique does not measure accumulation of a stable decay product. • Instead, it calculates an age from the degree to which secular equilibrium has been restored between 230 Th and its parent 234 U. (At secular equilibrium the number of 230 Th decays = the number of 230 Th produced = the number of 234 U decays in the sample. ) • Amount (concentration of) 230 Th and 234 U are usually measured by mass spectrometry • To calculate an age using this technique the ratio of 234 U to its parent 238 U must also be measured. U and Th activity ratios vs time. Q'/P' = 234 U/238 U, R'/Q' = 230 Th/234 U
 Dráhy štěpných fragmentů • • • 238 U se v malém procentu případů může rozpadat ne emisí a částice, ale samovolným štěpením ( = 6. 9 x 10 -17/y) Štěpné trosky zanechávají v materiálu stopy o délce řádově 10 mm Tyto stopy lze pomocí vhodných chemických reagentů dostat na povrch vzorku a pozorovat pod mikroskopem Kalibrace pomocí ozáření v reaktoru Je to „kumulativní“ metoda Současné množství 238 U lze zjistit např. pomocí štěpení 235 U pomalými neutrony (238 U se neštěpí) – měří se opět z množství drah a známého toku n
 • Princip: působením kosmického záření v atmosféře kontinuálně vzniká radioaktivní 14") Radiouhlíková metoda (1) • Princip: působením kosmického záření v atmosféře kontinuálně vzniká radioaktivní 14 C v reakci s neutrony: • T 1/2(14 C) = 5700(30) y, proto se v atmosféře nehromadí bez omezení: • Za předpokladu časově neproměnného toku kosmického záření se postupně ustavila rovnováha mezi produkcí radioaktivního uhlíku a jeho úbytkem radioaktivní přeměnou a tedy i rovnovážný poměr mezi množstvím neaktivního a radioaktivního uhlíku v atmosféře (cca 1 g 14 C na 1012 g vzdušného uhlíku). Ve formě CO přechází uhlík 2 dýcháním do biologických organismů, proto i v nich se vytvoří rovnovážná koncentrace 14 C. • Autorem W. D. Libby – 40. léta 20. stol. (1960 NC za chemii) • Za rok se v atmosféře vytvoří jen asi 7. 5 kg (2. 4 ± 0. 4 14 C/cm 2 s) • 14 C/ 12 C = 1. 2 x 10 -12
Radiouhlíková metoda (1) • Princip: působením kosmického záření v atmosféře kontinuálně vzniká radioaktivní 14 C v reakci s neutrony: • T 1/2(14 C) = 5700(30) y, proto se v atmosféře nehromadí bez omezení: • Za předpokladu časově neproměnného toku kosmického záření se postupně ustavila rovnováha mezi produkcí radioaktivního uhlíku a jeho úbytkem radioaktivní přeměnou a tedy i rovnovážný poměr mezi množstvím neaktivního a radioaktivního uhlíku v atmosféře (cca 1 g 14 C na 1012 g vzdušného uhlíku). Ve formě CO přechází uhlík 2 dýcháním do biologických organismů, proto i v nich se vytvoří rovnovážná koncentrace 14 C. • Autorem W. D. Libby – 40. léta 20. stol. (1960 NC za chemii) • Za rok se v atmosféře vytvoří jen asi 7. 5 kg (2. 4 ± 0. 4 14 C/cm 2 s) • 14 C/ 12 C = 1. 2 x 10 -12
 Po odumření rostliny či živočicha: • zastaví se přísun nového 14") Radiouhlíková metoda (2) Po odumření rostliny či živočicha: • zastaví se přísun nového 14 C do organismu, • původní rovnovážná koncentrace se poruší radioaktivní přeměnou 14 C • Měří se poměr vůči 12 C z „dnešních “ vzorků • U dna oceánů je koncentrace nižší
Radiouhlíková metoda (2) Po odumření rostliny či živočicha: • zastaví se přísun nového 14 C do organismu, • původní rovnovážná koncentrace se poruší radioaktivní přeměnou 14 C • Měří se poměr vůči 12 C z „dnešních “ vzorků • U dna oceánů je koncentrace nižší
 Nejdůležitější problémy metody: • Obtížná detekce obsahu 14 C - jedná") Radiouhlíková metoda (3) Nejdůležitější problémy metody: • Obtížná detekce obsahu 14 C - jedná se o velmi nízké aktivity zářiče nízkou Ebmax (=156 ke. V) a tedy špatně měřitelným zářením. – 1% příměs dnešního C dává pro 34 000 let starý vzorek chybu 4000 let a pro nekonečně starý vzorek dává 38 000 let – žádné g se neemituje • Proměnná rychlost vzniku 14 C – díky změnám zemského magnetického pole (produkce n v atm. ) – díky změnám „absorbční“ schopnosti oceánů – nutno korigovat např. podle dendrochronologické stupnice. • • Destruktivnost metody - C je nutné ze zkoumaného vzorku chemicky separovat a tím se vzorek zničí. To omezuje možnosti aplikace metody na objekty, ze kterých lze nenávratně odebrat dostatečně velký vzorek. Nestejná izotopová frakcionace při přechodu jednotlivých izotopů uhlíku do některých biologických organismů. – fotosyntéza je snad „hmotnostně“ závislá (CO 2 diffusion, carboxylation, …) – rostliny mají méně 14 C – zdají se starší • Omyl archeologa nebo historika ohledně vztahu datovaného předmětu k době, ze které pochází, metoda určuje vždy pouze dobu smrti příslušného biologického organismu.
Radiouhlíková metoda (3) Nejdůležitější problémy metody: • Obtížná detekce obsahu 14 C - jedná se o velmi nízké aktivity zářiče nízkou Ebmax (=156 ke. V) a tedy špatně měřitelným zářením. – 1% příměs dnešního C dává pro 34 000 let starý vzorek chybu 4000 let a pro nekonečně starý vzorek dává 38 000 let – žádné g se neemituje • Proměnná rychlost vzniku 14 C – díky změnám zemského magnetického pole (produkce n v atm. ) – díky změnám „absorbční“ schopnosti oceánů – nutno korigovat např. podle dendrochronologické stupnice. • • Destruktivnost metody - C je nutné ze zkoumaného vzorku chemicky separovat a tím se vzorek zničí. To omezuje možnosti aplikace metody na objekty, ze kterých lze nenávratně odebrat dostatečně velký vzorek. Nestejná izotopová frakcionace při přechodu jednotlivých izotopů uhlíku do některých biologických organismů. – fotosyntéza je snad „hmotnostně“ závislá (CO 2 diffusion, carboxylation, …) – rostliny mají méně 14 C – zdají se starší • Omyl archeologa nebo historika ohledně vztahu datovaného předmětu k době, ze které pochází, metoda určuje vždy pouze dobu smrti příslušného biologického organismu.
 Příklady The first comprehensive test, using dated tree-rings and wood from Egyptian pyramids. The vertical scale shows the ratio of the radioactivity of the ancient sample to that from a modern one. Radiocarbon ages for different constituents extracted from a rhinoceros (nosorožec) bone. The older ages obtained for the proline and hydroxyproline, which are amino acids generally specific to bone, suggest intrusive contamination in the other constituents. Open symbols indicate AMS measurement and closed symbols conventional beta decay counting.
 • • Srovnání stáří stanoveného radiouhlíkovou a dendrochronologickou metodou.") Radiokarbonová metoda – kalibrace (1) • • Srovnání stáří stanoveného radiouhlíkovou a dendrochronologickou metodou. Data sources: Stuiver et al. (1998). Samples with a real date more recent than AD 1950 are dated and/or tracked using the N- & S-Hemisphere graphs. medium-& short term effects: solaractivity & exchange ocean/atmosphere constant long term trend (thousands of years) : geomagnetism Kalibrace pro vzorky starší než asi 28 tisíc let je obtížná, neb existují různé „kalibrace“…
Radiokarbonová metoda – kalibrace (1) • • Srovnání stáří stanoveného radiouhlíkovou a dendrochronologickou metodou. Data sources: Stuiver et al. (1998). Samples with a real date more recent than AD 1950 are dated and/or tracked using the N- & S-Hemisphere graphs. medium-& short term effects: solaractivity & exchange ocean/atmosphere constant long term trend (thousands of years) : geomagnetism Kalibrace pro vzorky starší než asi 28 tisíc let je obtížná, neb existují různé „kalibrace“…
 Dendrochronology
 The figure shows the relative 14 C / 12") Radiokarbonová metoda – kalibrace (2) The figure shows the relative 14 C / 12 C ratio in the atmospheric CO 2 as a function of time in the second half of the 20 th century. Způsobeno jadernými výbuchy v atmosféře Úbytek C je mnohem rychlejší, než by odpovídalo době života – absorpce v oceánech Atmospheric 14 C, New Zealand Austria. The New Zealand curve is representative for the Southern Hemisphere, the Austrian curve is representative for the Northern Hemisphere. Atmospheric nuclear weapon tests almost doubled the concentration of 14 C in the Northern Hemisphere
Radiokarbonová metoda – kalibrace (2) The figure shows the relative 14 C / 12 C ratio in the atmospheric CO 2 as a function of time in the second half of the 20 th century. Způsobeno jadernými výbuchy v atmosféře Úbytek C je mnohem rychlejší, než by odpovídalo době života – absorpce v oceánech Atmospheric 14 C, New Zealand Austria. The New Zealand curve is representative for the Southern Hemisphere, the Austrian curve is representative for the Northern Hemisphere. Atmospheric nuclear weapon tests almost doubled the concentration of 14 C in the Northern Hemisphere
 Radiocarbon activity in the atmosphere relative to the value") Radiokarbonová metoda – kalibrace (3) Radiocarbon activity in the atmosphere relative to the value for the late nineteenth century. The data have been derived from measurements on dendrochronologically dated wood. An excess of 1% corresponds to an age underestimation of 83 years if correction is not made. • Problém, když funkce není monotonní • Na druhou stranu se třeba u stromů dá využít pozorované sekvence pro určení stáří
Radiokarbonová metoda – kalibrace (3) Radiocarbon activity in the atmosphere relative to the value for the late nineteenth century. The data have been derived from measurements on dendrochronologically dated wood. An excess of 1% corresponds to an age underestimation of 83 years if correction is not made. • Problém, když funkce není monotonní • Na druhou stranu se třeba u stromů dá využít pozorované sekvence pro určení stáří
 Generováno pohyby v zemském jádře – pozorují se změny ve") Magnetické pole Země (1) Generováno pohyby v zemském jádře – pozorují se změny ve směru a intenzitě (i přepólování) určeno pomocí magnetizace vzorků The Brunhes–Matuyama reversal, approximately 781, 000 years ago, when the Earth's magnetic field last underwent reversal. It may have occurred over several thousand years, or much more quickly, perhaps within a human lifetime. Magnetic pole (VGP) latitudes (on the right) that were obtained from sediment at the Atapuerca, Spain. The VGP latitude refers to the virtual geographic pole representing the hypothetical dipole at the centre of the Earth that would give the observed angle of dip at the site. An extract from the polarity timescale is shown on the left, with blackened segments indicating normal polarity; four subchrons are indicated during the Matuyama chron but were not recorded in the sediment of the site, possibly because the sampling interval was too short. There also subchrons (reversed) during the Brunhes chron.
Magnetické pole Země (1) Generováno pohyby v zemském jádře – pozorují se změny ve směru a intenzitě (i přepólování) určeno pomocí magnetizace vzorků The Brunhes–Matuyama reversal, approximately 781, 000 years ago, when the Earth's magnetic field last underwent reversal. It may have occurred over several thousand years, or much more quickly, perhaps within a human lifetime. Magnetic pole (VGP) latitudes (on the right) that were obtained from sediment at the Atapuerca, Spain. The VGP latitude refers to the virtual geographic pole representing the hypothetical dipole at the centre of the Earth that would give the observed angle of dip at the site. An extract from the polarity timescale is shown on the left, with blackened segments indicating normal polarity; four subchrons are indicated during the Matuyama chron but were not recorded in the sediment of the site, possibly because the sampling interval was too short. There also subchrons (reversed) during the Brunhes chron.
 • • • Direction of the Earth’s magnetic field in") Magnetické pole Země (2) • • • Direction of the Earth’s magnetic field in southern Britain according to archaeomagnetic measurements and from AD 1576, according to observations recorded by scientists. The lower section shows the declination (D)—the angle between Magnetic North and True (Geographic) North. The upper section shows the inclination (I), or angle of dip—the angle by which the north -seeking end of a magnetized needle suspended at its centre of gravity points below the horizontal.
Magnetické pole Země (2) • • • Direction of the Earth’s magnetic field in southern Britain according to archaeomagnetic measurements and from AD 1576, according to observations recorded by scientists. The lower section shows the declination (D)—the angle between Magnetic North and True (Geographic) North. The upper section shows the inclination (I), or angle of dip—the angle by which the north -seeking end of a magnetized needle suspended at its centre of gravity points below the horizontal.
 Jak měřit podíl 14 C? • Měří se přímo aktivita (spálí se kousek vzorku a plynný vzorek v proporcionálním počítači) – 14 C se rozpadá pomocí b-rozpadu – Nutnost velkého množství (5 g) a dlouhá doba měření (15 c/s) • Hmotnostním separátorem (accelerator mass spectroscopy) – měří se všechny atomy (nejen ty rozpadající se) – stačí menší vzorek (0. 1 -10 mg), ale drahé vybavení – problém s příměsemi (14 N) ale v zásadě řešitelné (http: //cas. web. cern. ch/cas/Holland/PDF-lectures/Van-der. Plicht/vd. Plicht. pdf) – je to dominantní metoda měření • Existují i laserové techniky separace izotopů (laser isotope separation) – díky izotopickému posunu se mění energie hladin v atomovém obalu – budím zářením o w. B (laditelným laserem) a měřím tu samou frekvenci v jiném směru – dají se odhalit příměsi asi do 10 -6 - to ale, bohužel, nestačí
 Jak měřit podíl 14 C? radiometry mass spectrometry • standard activity: 226 ± 1 Bq/kg. C • detection limit: 14 C/C =10– 15 • E(β-) is very low (156 ke. V) difficult detection • concentration is extremely low 12 C: 13 C: 14 C = 1: 0. 01: 10 -12(15) radiometry vs. AMS 5‰ precision = 4. 104 counts ⇒ √N/N = 0. 005 radiometry: • d. N/dt = -λN decay counting • t = 48 hrs, 1 g. C (1 mg. C would take 7 y counting time) AMS: • atom counting • efficiency: 10 -2 ⇒ 4. 106 atoms 14 C needed for 5‰ precission • if abundance 10 -12 ⇒ 4. 1018 C atoms = 8. 10 -5 g • typically 1 mg sample for 1 hour counting time (50 -100 Hz 14 C) • if abundance 10 -12 ⇒ cca 40 s http: //cas. web. cern. ch/cas/Holland/PDF-lectures/Van-der-Plicht/vd. Plicht. pdf
 Jak měřit podíl vzácných izotopů? fluorescence Ozáření atomu laserem photo-ionisation deflection Netýká se jen C, ale i jiných izotopů Example: absorption lines of 235 U and 238 U differ slightly due to hyperfine structure (238 U absorbs at 502. 74 nm, 235 U at 502. 73). Tunable dye lasers can be tuned, so only 235 U absorbs photons and selectively undergoes excitation and then photoionization. Ions are then electrostatically deflected to a collector, while the neutral 238 U passes through.
 Fluerescence") Izotopický posun Problém je i konečná šířka hladin (jejich překryv v různých izotopech) Fluerescence detection Excitation detection • • Dají se odhalit příměsi asi do 10 -6 – to nestačí Musejí se použít vícestupňové metody – kaskády se obtížně hledají (ale v některých případech existují) • Existuje řešení – urychlíme atomy urychlovačem – díky různé hmotnosti jsou různé rychlosti a energie hladin budou Dopplerovsky posunuté Dw/w = b – to závisí na hmotnosti – mohu posvítit laserem a měřit příměs atomů (rozdíl je větší)
Izotopický posun Problém je i konečná šířka hladin (jejich překryv v různých izotopech) Fluerescence detection Excitation detection • • Dají se odhalit příměsi asi do 10 -6 – to nestačí Musejí se použít vícestupňové metody – kaskády se obtížně hledají (ale v některých případech existují) • Existuje řešení – urychlíme atomy urychlovačem – díky různé hmotnosti jsou různé rychlosti a energie hladin budou Dopplerovsky posunuté Dw/w = b – to závisí na hmotnosti – mohu posvítit laserem a měřit příměs atomů (rozdíl je větší)
 Příklad – turínské plátno COPYRIGHT 1931 GIUSEPPE ENRIE
 Příklad – turínské plátno • • • The Shroud of Turin. Calibration of the radiocarbon age of 691 +/-31 years as derived from measurements by three AMS laboratories on linen threads. After allowance for a small uncertainty in the calibration curve the calendar date span corresponding to the 68% level of confidence is AD 1275– 1290; corresponding to the 95% level of confidence there are two possible spans: AD 1260– 1310 and AD 1355– 1385. Provedeno nezávisle třemi laboratořemi Objevily se spekulace o požáru poblíž plátna In 1980’s C-14 tests seemingly proved it was medieval. Then in 2005, two scientists, working independently with different technologies, showed that those tests were wrong. Both found that the radiocarbon dating was performed on a repaired section of the cloth: a mixture of older and newer threads. There was enough newer material to skew the results by a dozen or so centuries. Moreover, micro-chemical findings clearly showed that the shroud is much older… neverending story
 Přesnost / citlivost • In 2008, a typical uncertainty better than ± 40 radiocarbon years can be expected for samples younger than 10, 000 years. This, however, is only a small part of the uncertainty of the final age determination (calibration curve not taken into account). • As of 2007, the limiting age for a 1 milligram sample of graphite is about ten half-lives, approximately 60, 000 years. This age is derived from that of the calibration blanks used in an analysis, whose 14 C content is assumed to be the result of contamination during processing (as a result of this, some facilities will not report an age greater than 60, 000 years for any sample). • A variety of sample processing and instrument-based constraints have been postulated to explain the upper age-limit. To examine instrumentbased background activities in the AMS instrument of the W. M. Keck Carbon Cycle Accelerator Mass Spectrometry Laboratory of the University of California, a set of natural diamonds were dated. Natural diamond samples from different sources within rock formations with standard geological ages in excess of 100 my yielded 14 C apparent ages 64, 920± 430 BP to 80, 000± 1100 BP as reported in 2007.
 Termoluminscence a opticky stimulovaná luminiscence • Radiačně indukovaná TL a OSL: Metoda využívající „kumulativní“ projevy RA záření • U materiálů, které na počátku svého osudu prošly tepelným zpracováním při vysokých T (vypalovaná keramika, cihly), byly v tom okamžiku uvolněny všechny e- zachycené v metastabilních polohách v záchytných centrech. Prázdná centra jsou poté obsazována e- v důsledku dávky od přírodních radionuklidů v materiálu a okolí (rozpadové řady a 40 K), případně z kosmického záření. Vazbová energie metastabilních center musí být dostatečně velká, aby e- zůstaly zachyceny (asi E > 1. 6 e. V)
 Ukládání • The event dated, whether in thermoluminescence dating or in optical dating, is the setting to zero, or near zero, of the latent luminescence acquired at some time in the past. With sediment this zeroing occurs through exposure to daylight (‘bleaching’) during erosion, transport, and deposition, whereas with fired materials, it is through heating. • Subsequently the latent signal builds up again through exposure to the weak natural flux of nuclear radiation. For OSL the dating signal is obtained by exposure of the grains from the sample to a beam of light; for TL it is obtained by heating.
 TL a OSL • Dávka, kterou materiál obdržel a my ji můžeme změřit pomocí termoluminiscenční odezvy, je úměrná stáří předmětu od jeho vypálení. • Nejobvyklejší minerál v keramice a cihlách vykazující termoluminiscenci: křemen. TL glow-curve observed from a small sample taken from an Etruscan terracotta statue. Curve (a) shows the light emission observed during the first heating, and curve (b) the light observed during a second heating. The latter is the red-hot glow, or incandescence, that occurs whenever a sample is heated, but during the first heating there is substantial TL in addition.
 TL Měřitelné stáří závisí na TL citlivosti materiálu a obsahu přírodních radionuklidů - běžně 100 - 10 000 let. Dolní mez je dána citlivostí měřící aparatury, horní nasycováním křivky odezvy. Chyba stanovení stáří: v optimálním případě kolem 3%. Hlavní problémy: a) chyba stanovení dávkového příkonu ve zkoumaném materiálu. b) spontánní vyprazdňování záchytných center při pokojové teplotě (tzv. fading) vyžaduje používat pro datování centra vyprazdňovaná až při vysokých teplotách cca nad 350 o. C. Při takových teplotách již nastávají problémy s teplotním svícením materiálu, které tvoří postupně s teplotou rostoucí pozadí pro měřený efekt. c) náročná příprava a zpracování vzorků pro TL měření. d) Nestejná citlivost materiálu vykazujícího TL na různé druhy záření, zejména odlišná citlivost na záření a od citlivosti na záření vyžadující složitou a časově náročnou kalibraci odezvy uměle aplikovanými dávkami ionizujícího záření. Termoluminiscenční vyhřívací křivka křemene.
 OSL The basic experimental arrangement for measurement of OSL. In order to prevent scattered laser light from swamping the weak wanted signal from the sample it is necessary to insert, in front of the photomultiplier, colour filters that give severe rejection of green light but which pass blue, violet, and near. UV wavelengths. Nowadays measurement facilities are automated. The signal from the photomultiplier anode decays rapidly from the moment of laser switch-on because of depletion the trapped electrons; with typical intensity of the laser beam the signal decreases by a factor of two in about 10 s.
,") • Existuje i alternativa k TL a OSL - elektronová spinová rezonance (ESR), nebo se používá název Electron paramagnetic resonance (EPR) – jsou buzeny přechody mezi různými spinovými stavy nespárovaných elektronů – je to vlastně NMR „na elektronech“
• Existuje i alternativa k TL a OSL - elektronová spinová rezonance (ESR), nebo se používá název Electron paramagnetic resonance (EPR) – jsou buzeny přechody mezi různými spinovými stavy nespárovaných elektronů – je to vlastně NMR „na elektronech“
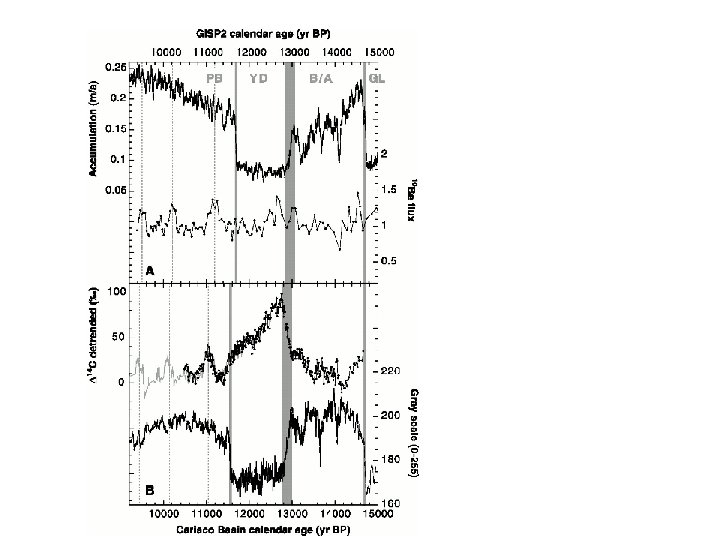
 Zajímavosti • Lze datovat výbuchy blízkých supernov? • Proč vymřeli mamuti před 12 tisíci lety v severní Americe? R. B. Firestone, The Astrophysical Journal, 789: 29
 THE END
 The movement of Earth's North Magnetic Pole across the Canadian arctic Geomagnetic polarity during the late Cenozoic Era. Dark areas denote periods of normal polarity, light areas denote reverse polarity. Absolute magnitude of the axial dipole component of Earth's magnetic field from 1600 to 2020, according to three models: CALS 3 k. 4, gufm 1, and IGRF-12. Variations in virtual axial dipole moment since the last reversal.
 • • There have been about 170 of these reversals during the last 76 million years according to geological evidence. The time between reversals seems to be growing longer, and is currently about 300, 000 years or so. The last one of these happened about 770, 000 years ago (0. 77 on the graph). We are currently living during a period that has been called the Brunhes Magnetic Chron when the South Magnetic Pole is in the Northern Hemisphere. During the previous Matumaya Magnetic Chron, the North Magnetic Pole was in the Northern Hemisphere! Note that, from the polarity figure, at a time 0. 94 million years ago (940, 000 years ago) the magnetic field reverse itself by going nearly to 'zero' but then after a few thousand years it recovered and began to increase in strength. During the next 150, 000 years it rose to a maximum strength and then began to decline. Notice, also, how fast the magnetic field recovers after it reaches 'zero', in some cases much less than 10, 000 years. Presently, Earth's magnetic field is weakening in strength by 5% every 100 years. It may be near zero in another few thousand years at this rate!
 • New research from MIT shows that the Earth’s geomagnetic field intensity is double the long-term historical average, indicating that the current field intensity has a long way to fall before reaching an unstable level that would lead to a reversal. • The most obvious sign of an impending reversal is a geomagnetic field intensity that’s significantly below its historical, long-term average — a sign that the planet is tipping toward an unstable state. While satellites and ground-based observatories have made accurate measurements over the last 200 years of the current field intensity, there are less reliable estimates over the last few million years
 14 Cclock problems • • • 1. halflife T 1/2 has been changed T 1/2= 5730 ± 40 yr; originally 5568 yr has been used 2. the 14 C content in de nature is not constant 1. 14 C production depends on cosmic ray flux, which depends on solar activity and earth magnetic field strength 2. changes in equilibrium between the C reservoirs atmosphere, biosphere, ocean, soil 3. isotope effects change the 14 C content example: photosynthesisis mass dependent -plant is depleted in 14 C (and therefore seems older) 4. reservoir effects water (sea, river) contains dissolved fossil C and is thus depleted in 14 C -organisms living in water are therefore older 14 Cclock problems
 • • consequence: 14 C clock ticksat a different pace thanthe calendar the (because of halflife) pace changes continuously this (because of changing natural 14 C content) 14 C clock starts at different moments for different the materials (because of isotope -en reservoir-effects) • solution: – – – – • define the 14 C clock speed w. r. t. standard activity = 1950 use T 1/2= 5568 jr (original) correct for isotope effects using stable isotope 13 C: 14δ= 213δ express in unit “BP” calibrate the 14 C clock measure 14 C in absolutely dated materials (BP -AD/BC)
 4/ Záznam měření na palubě letadla letícího z Prahy do New Yorku v průběhu sluneční erupce, dne 15. 4. 2001. V jejím důsledku došlo ke zvýšení obvyklého ozáření o 20 µSv, tj. o 45 %.
 • Laser detection of rare isotopes on the basis of multistep collinear ionisation
 Termoluminscence a opticky stimulovaná luminiscence • • • Obrázek 3: Pásový energetický diagram pevné látky s vyznačenými přechody odpovídajícími za termoluminiscenci. Využití termoluminiscence pro datování: U materiálů, které na počátku svého osudu prošly tepelným zpracováním při vysokých teplotách (vypalovaná keramika, cihly), byly v tom okamžiku uvolněny všechny elektrony zachycené v metastabilních polohách v záchytných centrech. Prázdná centra jsou nadále obsazována elektrony v důsledku dávky od přírodních radionuklidů v samotném materiálu i jeho okolí (především radionuklidy přírodních přeměnových řad a 40 K), případně též z kosmického záření. Odtud: dávka, kterou materiál obdržel a my ji můžeme změřit pomocí termoluminiscenční odezvy, je úměrná stáří T předmětu od jeho vypálení. Příslušný vztah pro stáří: T = , Rnat - termoluminiscenční odezva daného vzorku materiálu (tzv. přírodní termoluminiscence, vyvolaná přírodním zářením za dobu, kterou chceme stanovit), S - termoluminiscenční citlivost daného materiálu (tj. odezva na jednotkovou dávku), dávkový příkon působící na vzorek po dobu jeho ``života'' (dávka za jednotku času, zpravidla za jeden rok). Nejobvyklejší minerál v keramice a cihlách vykazující termoluminiscenci: křemen.