

0036472181cedfb275c537e81d3a846f.ppt
- Количество слайдов: 48
 Data and Information Issues of the Meadowlands Environmental Research Institute Dr. Kirk Barrett, PE, PWS, MERI Research Director Dr. Francisco Artigas, MERI Assistant Director email: meri@cimic. rutgers. edu; web: http: //cimic. rutgers. edu/meri
 Hackensack Meadowlands District
 Important and Distinctive Features • Administered by the New Jersey Meadowlands Commission, a NJ state agency, created in 1969 • River, tidal creeks, human-made channels, wetlands cover 3400 hectares (8400 acres) or 40% of District’s 32 sq miles • Legacy of past industrial waste discharge and solid waste disposal -- 520 ha (1300 ac) of landfills, >100 contaminated sites • Intense transportation infrastructure; large existing developments; intense development pressure • Supports 250 bird, 31 fish and 23 invertebrate species including 21 threatened or endangered species • Active wetland enhancement and environmental education programs by NJMC • Carefully watched by environmental advocates
 and Rutgers -") Meadowlands Environmental Research Institute • Established in 1998 by NJMC (HMDC) and Rutgers - CIMIC • Research center for environmental issues significant to the Meadowlands • Administered by Rutgers--CIMIC • NJMC provides funding, laboratory equipment and analyses, GIS support, office space, access to sites, guidance for research agenda
Meadowlands Environmental Research Institute • Established in 1998 by NJMC (HMDC) and Rutgers - CIMIC • Research center for environmental issues significant to the Meadowlands • Administered by Rutgers--CIMIC • NJMC provides funding, laboratory equipment and analyses, GIS support, office space, access to sites, guidance for research agenda
 MERI Mission • Conduct and sponsor research in ecology, environmental science and information technology to monitor, preserve and improve ecological and human health and welfare in the Meadowlands 3
 Focus areas • Environmental monitoring • Remote sensing/GIS for land use planning • Plant and animal inventory and assessment • Salt-marsh and landfill characterization and restoration • Assessment and remediation of contaminated sediments • Land use information management 5
 Question researchers/managers/ regulators/public might want to ask • Has is it been unusually hot for October? • How much did it rain last weekend? How big of storm is that? • How bad is the drought we are having? • What’s the water quality of the River? • What explains spatial and temporal variations in metal concentrations in the River? • Will building a mall cause flooding? • How are contaminants in sediment affecting biota? • What causes fish kills in the Summer? • Is the fish community becoming more diverse/abundant? If so, what is causing it?
 Representative Project: Aquatic Animals Inventory and Assessment Purpose: Assess the abundance, diversity and health of fish and other aquatic animals in the Meadowlands
 Inventory • Collect fish and crustaceans over a 2 year period, beginning August 2001, from 21 locations • Identify, count and measure catch • Compare results with those of a fish inventory in the late 80 s • Collect sediment samples, count and identify benthos • Terrapin population inventory in Sawmill Creek
 Assessment • Analyze fish and crab tissue and sediment for bioaccumulative contaminants: heavy metals, pesticides, PCBs • White perch reproductive and hormonal health -- compare results with concurrent study in Chesapeake Bay • Food habits -- Stomach contents of White Perch
 •") Questions • Has fish community changed? (analyze abundance and diversity; compare with 1987/88) • Are contaminants accumulating in fish and crab tissue? • What are White Perch finding sufficient food sources? • Are chemicals interfering with reproduction in White Perch? • What plants form base of food web?
Questions • Has fish community changed? (analyze abundance and diversity; compare with 1987/88) • Are contaminants accumulating in fish and crab tissue? • What are White Perch finding sufficient food sources? • Are chemicals interfering with reproduction in White Perch? • What plants form base of food web?
 Ecological Risk Assessment from Toxic Contamination Task 1: Develop a web-accessible, geographic database of data from already assessed marshes Some Recently Assessed Marshes • Skeetkill Creek Marsh • Riverbend • Secaucus HS • Oritani Marsh • Kearny Marsh • Saw Mill Creek WMA • Eight Day Swamp
 Typical Data available • Sediment chemistry – Metals…. . 13 Metals – Volatile organics…. 30 compounds – Semi-Volatile Organics… 56 compounds – Pesticides …. 18 compounds • • Surface water chemistry… 19 compounds Macroinvertebrates… 9 Orders Bird inventory Mammal inventory
 Task 4. Attempt to correlate benthic diversity/abundance with sediment contaminant concentrations Plot Benthic diversity against co-located sediment chemistry LE P M XA E
 Online Data at www. digitalmeadowlands. org • • Monitoring Data Satellite images Interactive maps Catalog of reports (some full text) • Videos
 Quarterly Water Quality Monitoring: Variation of water quality with time, for 5 different sites in the Hackensack River Lead Concentration
 Lead concentration distribution by site: “Box and Whiskers” plot
") Is one variable correlated to another? (If so, is it a causal relationship? ) Scatter plot: concurrent, colocated values of two variables
Is one variable correlated to another? (If so, is it a causal relationship? ) Scatter plot: concurrent, colocated values of two variables
 Continuous, Automated Monitoring of Weather and Water
 Continuous Water Quality Monitoring Data
 This looks like a lot of bad data! • DO/conductivity sensor turned out to be broken • Excessive cable length between sensor and logger caused some erratic readings
 Need an automated validation system to check validity of data and alert managers to problems • • • continuous data collection large amounts of data real-time posting to WWW
 Simple Validation Tests Is the current value… • • missing? above maximum acceptable value? below minimum acceptable value? above maximum acceptable step change? (too large a change from one value to next) Are last 10 values… • above maximum acceptable standard deviation? (excessive variability) • below minimum acceptable standard deviation? (unchanging or “stuck” sensor)
 Future Work More Sophisticated Tests • Context-sensitive maxima and minima, varying with location and season • Spatially consistency tests: temperature at Sta. 1 should be within 5 C of the temperature at Sta. 2 • Multivariate tests: IF solar radiation > 0 AND water temperature > 10 C, THEN dissolved oxygen should be increasing (at what rate? )
 Data is at the bottom of the mountain! How can we add value to data and climb the mountain? Wisdom Knowledge + significance + understanding Information + context Data
 Some Ways of Adding Value – Contextualization – Validation – Statistical tools – Visualization – Prediction/modeling
 Contextualization Putting data in relation to other things • • Metadata -- the who, when, where, why and how Exposition-- what the variables/numbers mean Comparison with data from other times/locations Classification/ratings – high, medium, low WRT historic data – good, medium, bad – in compliance, out of compliance w/ regulatory standards
 Data without context 68. 0, 67. 7, 66. 5, 66. 6, 66. 5, 64. 8, 64. 0, 63. 9, 63. 8
 metadata Air temperature (deg F) at the NJMC headquarters 10/14/00 18:") Data with (some) metadata Air temperature (deg F) at the NJMC headquarters 10/14/00 18: 45: 68. 0 10/14/00 19: 00: 67. 7 10/14/00 19: 15: 66. 5 10/14/00 19: 30: 66. 6 10/14/00 19: 45: 66. 6 10/14/00 20: 00: 66. 5
Data with (some) metadata Air temperature (deg F) at the NJMC headquarters 10/14/00 18: 45: 68. 0 10/14/00 19: 00: 67. 7 10/14/00 19: 15: 66. 5 10/14/00 19: 30: 66. 6 10/14/00 19: 45: 66. 6 10/14/00 20: 00: 66. 5
 Data with context allows - comparison specific data points with other data - assessment of range and variability
 Data with more context
 Data visualization • Maps, graphs, animations • Use GIS and spatial statistics to visualize data
 Dot Map
 Isarithmic map of water depth of the NJ coast from Rutgers U Institute of Marine and Coastal Sciences
 Animation of Ozone Concentrations
 Visualization: Webcam showing surf conditions, allowing visualization of real-time wave height data
 GIS, Spatial Analysis and Remote Sensing
 Web-based GIS Interactive Maps
 Satellite Image Download
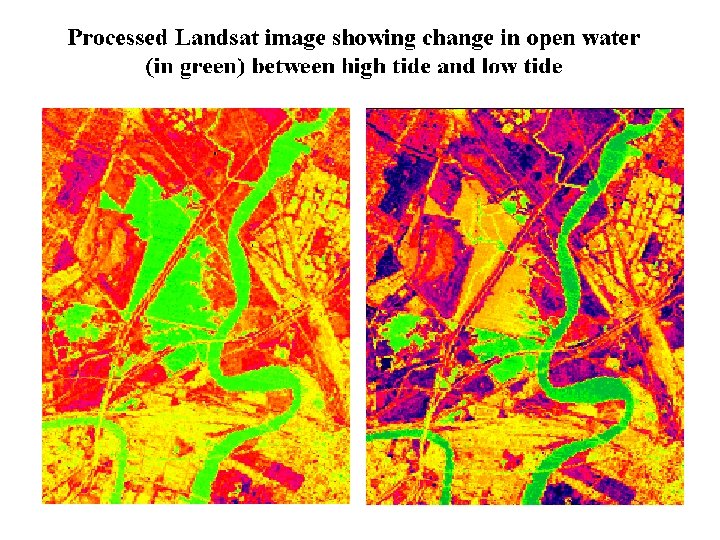
 Query of Satellite Image Database Land. Sat Image
 Map of Duration of Flooding in Oritani Marsh darker blue means flooded more hours per day … likely correlated with benthic diversity
 Model of the salinity gradient in the Hackensack River. • Mean of more than 300 measurements between 19892002 (surface derived from Kriging) • Intensity of red color indicates salinity concentration. • Salinity decreases from the mouth of the river inland
 Digital Elevation Model with 1 m resolution aerial photo Mill Creek Site
 Wire frame diagram of Hackensack River salinity data
 Example of visualization of sediment chemistry variation with depth 0 -6 inches 6 -12 inches 12 -18 inches Green = low concentration ; Red = high concentration
 End
End
") Choropleth Map (usually not most appropriate visualization method for environmental data)
Choropleth Map (usually not most appropriate visualization method for environmental data)