

e921b02800ef27f1075d40afa463dc7a.ppt
- Количество слайдов: 49
 Dairy Marketing Dr. Roger Ginder Econ 338 Fall 2009 Lecture # 6
 Top Milk Production States, 2008 Source: NASS, USDA, Milk Production, 2/15/09
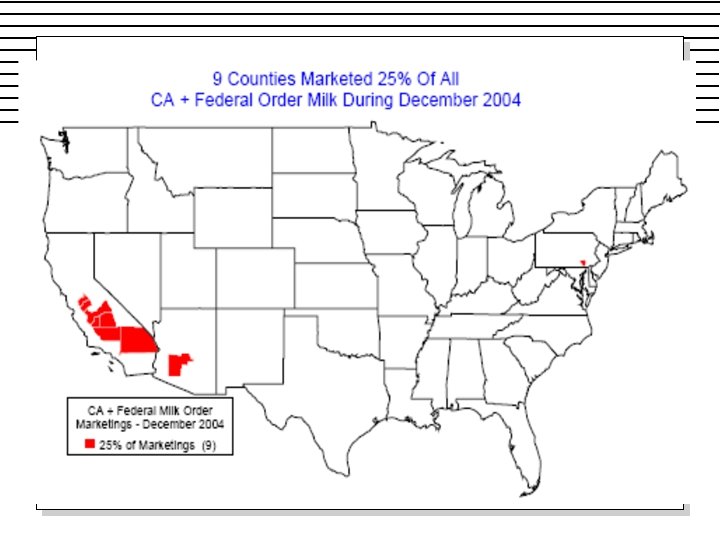
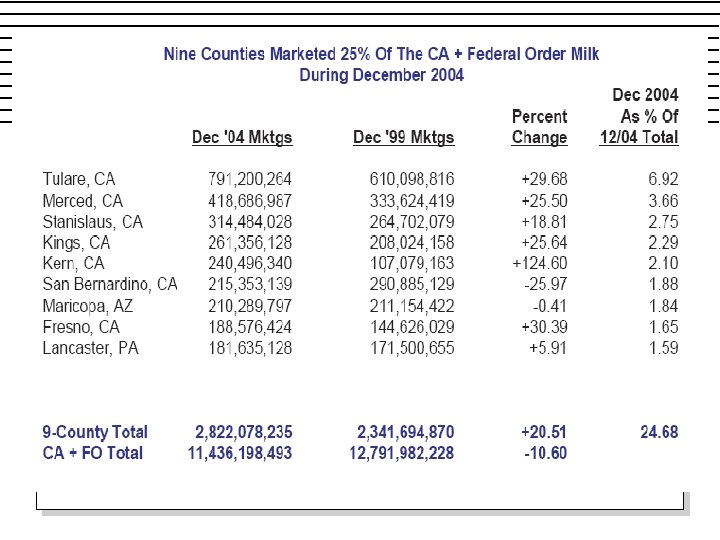
 USDA, Federal Milk Marketing Administrator, Tulsa, 2/2005
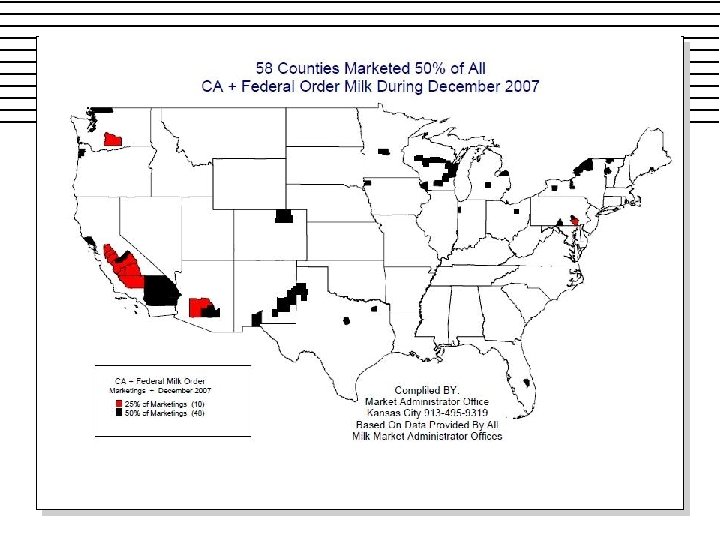
 USDA, Federal Milk Marketing Administrator, Tulsa, 2/2009
 DAIRY PRODUCTON GEOGRAPHIC DISTRIBUTION n Would you expect the production to grow in the south and northeast where per-capita production is low? – Why or Why not? n Iowa has surplus per-capita consumption– Is that good or bad for the future of the industry here
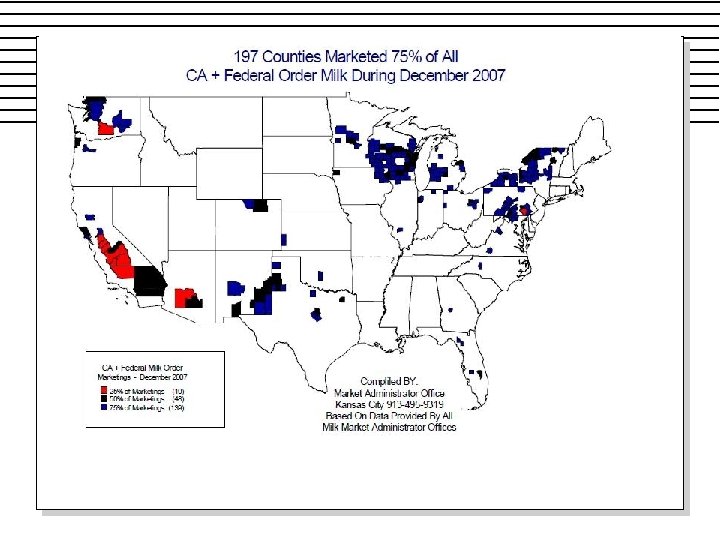
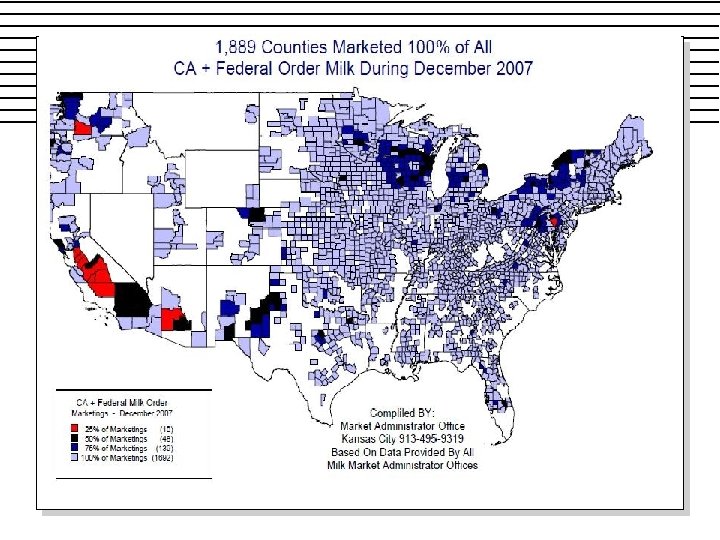
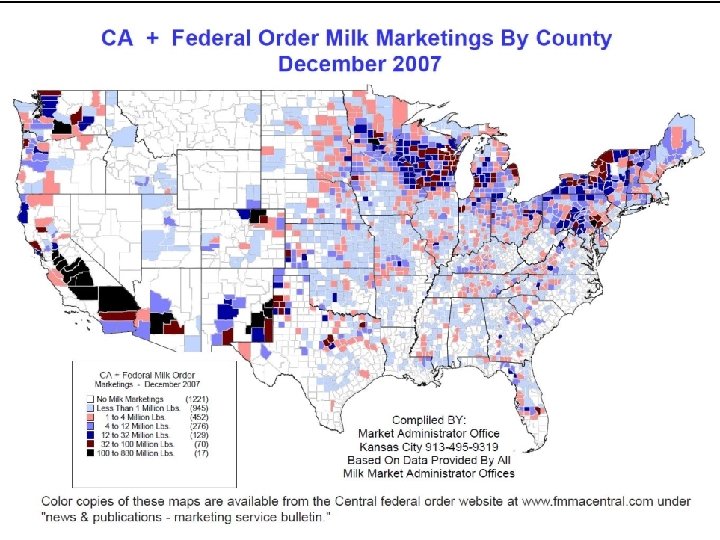
 Geographic Distribution of U. S. Milk Production Where is the milk produced n Which areas are increasing production n Which areas are decreasing production n
 USDA, Federal Milk Marketing Administrator, Tulsa, 2/2009
 Milk Production: 2007 vs 2002 USDA, Federal Milk Marketing Administrator, Tulsa, 2/2008
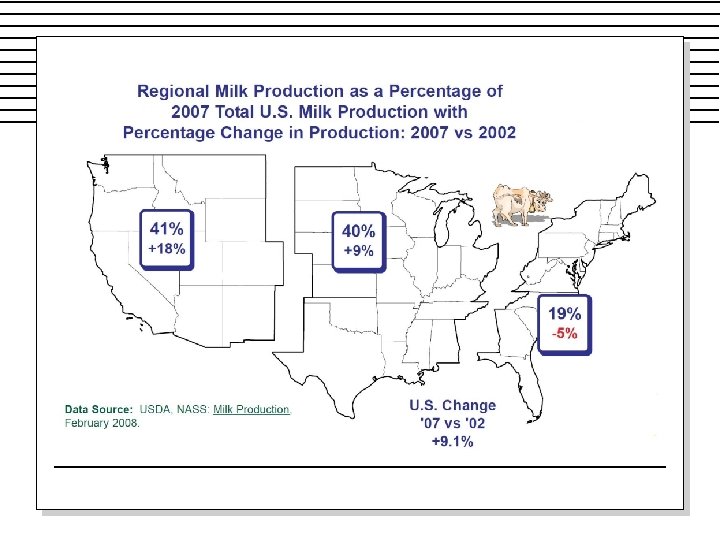
 Regional Milk Production as a Percent of Total U. S. Production Central Source: Federal Milk Market Administrator, Tulsa, April, 2008
 Increases in CA + FO Milk Marketings December 2007 vs December 2002
 Decreases in CA + FO Milk Marketings December 2007 vs December 2002
 Production Costs By Region How do the different regions in the U. S. compare with respect to production costs and net returns? n What effects are the differences in cost structure likely to have on where U. S. production takes place? n
 Statistical Regions Pre 2002 MILK: NORTHEAST: New York, Pennsylvania and Vermont SOUTHEAST: Florida and Georgia UPPER MIDWEST: Michigan, Minnesota and Wisconsin CORN BELT: Iowa, Missouri and Ohio SOUTHERN PLAINS: Texas PACIFIC: Arizona, California and Washington Source: ERS, USDA
 Source: USDA, ERS
 Regional Production Returns Per Cwt. , 2003 Source: ERS, USDA
 Regional Production Returns Per Cwt. , 2008 Source: ERS, USDA
 Production Costs & Returns Per Cwt. , Heartland Region Source: ERS, USDA
 Production Costs & Returns Per Cwt. , Heartland Region Source: ERS, USDA
 Production Costs & Returns Per Cwt. , Fruitful Rim Region Source: ERS, USDA
 Production Costs & Returns Per Cwt. , Fruitful Rim Region Source: ERS, USDA
 Production Costs & Returns Per Cwt. , n How can producers in California pay more for feed and get lower prices for milk and still be more profitable than midwest producers? ? ? – Lower Variable Costs Per Hundred Weight – More Hundred Weight of Milk Sold
 Average Cost/Cwt. Example Average Cost Curve $23/cwt $20 cwt 17. 5 k 20. 5 k Cwt. of Milk Produced
 FEED COST PER CWT – IMPACT OF VOLUME California = 110. 00/mo to feed/cow prod = 20, 500 Iowa = 105. 00/mo to feed/cow prod = 17, 500 Annual Av Cost/CWT = $110/mo * 12 mo = $1320 20, 500# = $6. 40/cwt Iowa = $105/mo * 12 mo = $1260 17, 500 = $7. 20/cwt Iowa = $100/mo * 12 mo = $1200 17, 500# = $6. 80/cwt Iowa = $95/mo * 12 mo = $1140 17, 500# = $6. 50/cwt Iowa = $90/mo * 12 mo = $1080 17, 500# = $6. 17/cwt CA
 Supply Curve Concept What producers will choose to supply at different product prices ---with all variables other than product price equal n Technology, Regulation, Prices of Inputs, Prices of Other Commodities etc. are held constant n A very restrictive set of assumptions n
 Price $/# Supply P m 1 Pm Qm Q m 1 Quantity # of milk supplied
 Demand Curve Concept What Consumers will choose to buy at different product prices ---with all variables other than product price equal n Consumer tastes and preferences, Consumer Income, Prices of Other Goods, Prices of Substitutes, Prices of Complements n Also A very restrictive set of assumptions n
 Price $/# Supply Pm Demand Qm Quantity # of milk demanded
 Price $/# Supply Pm Demand Qm Quantity # of milk supplied # of milk demanded
 Elasticity of Supply Percent change in quantity supplied that results from a 1% change in price n Determines how much more producers will put on the market when price increases n Determines how much less producers will put on the market when price falls n
 Price Supply $/# P 1 Po Qo Q 1 Relatively Inelastic Supply Quantity # of milk
 Price $/# Supply P 1 Po Qo Q 1 Relatively Elastic Supply Quantity # of milk
 Do You Think That Elasticity of Supply Could Differ by Region? Different Production Systems n Different Cost Structures n Which Regions Would You Expect to Have a Less Elastic Supply Curve? n Which Would You Expect to Have a More Elastic Supply Curve? n
 Price Supply $/# P 1 Po Qo Q 1 Relatively Inelastic Supply Quantity # of milk
 Price $/# Supply P 1 Po Qo Q 1 Relatively Elastic Supply Quantity # of milk
 Shifts in the Supply Curve If we relax the assumption that all else is equal the supply curve can shift n For example assume that input costs decrease for all producers n – Producers will be willing to supply more product at all points on the supply curve – The supply curve will shift downward and to the right
 Price So S 1 Po P 1 Do Qo Q 1 Quantity Factors that can shift supply: 1. New technology 2. Changes in input costs 3. Raw material or resource availability 4. Legal or government program constraints on production
 Questions?
 Appendix
 Statistical Regions Pre 2002 MILK: NORTHEAST: New York, Pennsylvania and Vermont SOUTHEAST: Florida and Georgia UPPER MIDWEST: Michigan, Minnesota and Wisconsin CORN BELT: Iowa, Missouri and Ohio SOUTHERN PLAINS: Texas PACIFIC: Arizona, California and Washington Source: ERS, USDA
 Production Costs & Returns Per Cwt. , 2000 Source: ERS, USDA
 Production Costs & Returns Per Cwt. , 2000 Source: ERS, USDA
 Production Costs & Returns Per Cwt. , Heartland Region Source: ERS, USDA