c51b14cde06e1e9de1b438f44073fc8f.ppt
- Количество слайдов: 111


") D = Demand rate (usually per year)
D = Demand rate (usually per year)


 Total Annual = Total Annual+ Total Annual + Inventory Costs. Holding Costs ordering Costsprocurement Costs
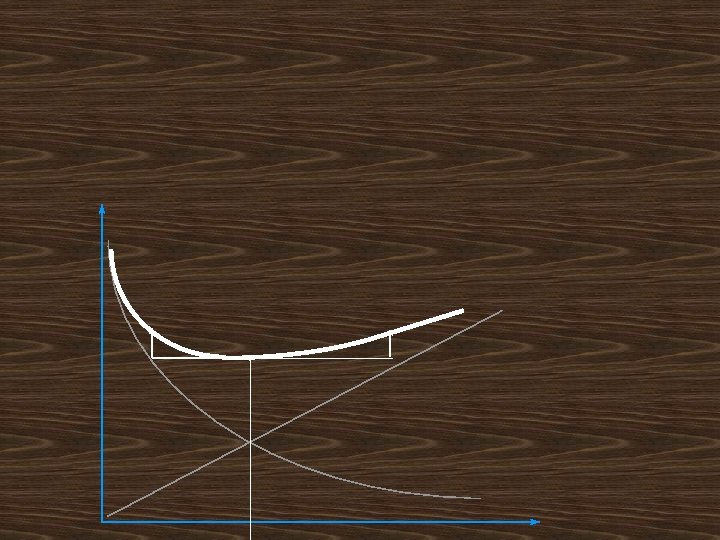
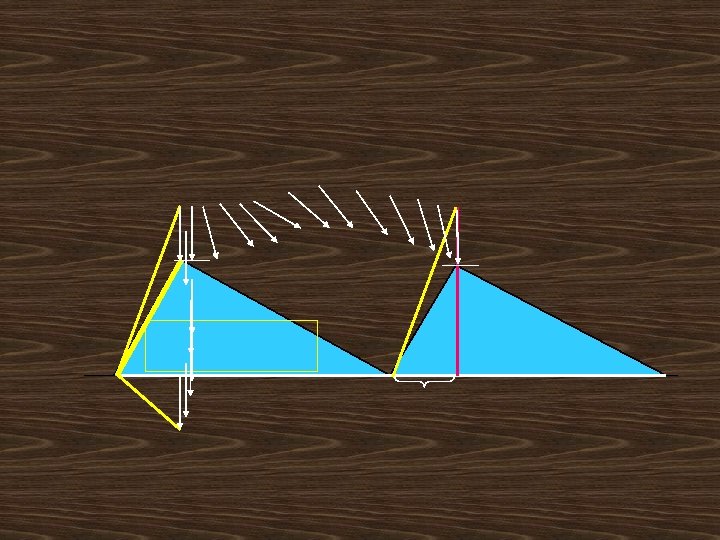
 ts os Constructing the total annual variable cost curve g. C Add the") TV(Q) ts os Constructing the total annual variable cost curve g. C Add the two curves to one another ldin Ho Total annual holding and tal To ordering costs g rin rde o tal To ts cos The optimal order size Q
TV(Q) ts os Constructing the total annual variable cost curve g. C Add the two curves to one another ldin Ho Total annual holding and tal To ordering costs g rin rde o tal To ts cos The optimal order size Q


 y or nt ve In Reorder Point n tio si po Place the order now L R = Inventory at hand at the beginning of lead time
 Outstanding order Place the order L R = inventory at hand at the beginning of lead time + one outstanding order = demand during lead time = LD
 R = LD + SS
 Reorder Point Place the order now R = LD L
 Reorder Point Place the order now + R = LD SS L
 Total Annual = Total Annual+ Total Annual + Inventory Costs. Holding Costs ordering Costsprocurement Costs Safety stock holding cost


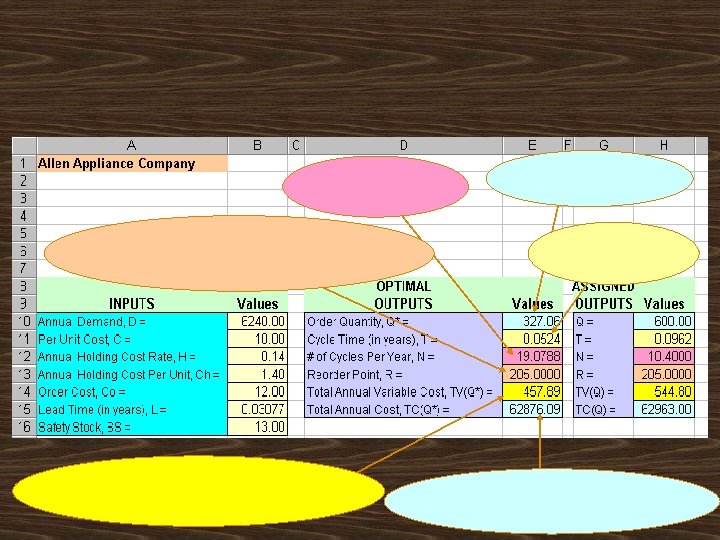
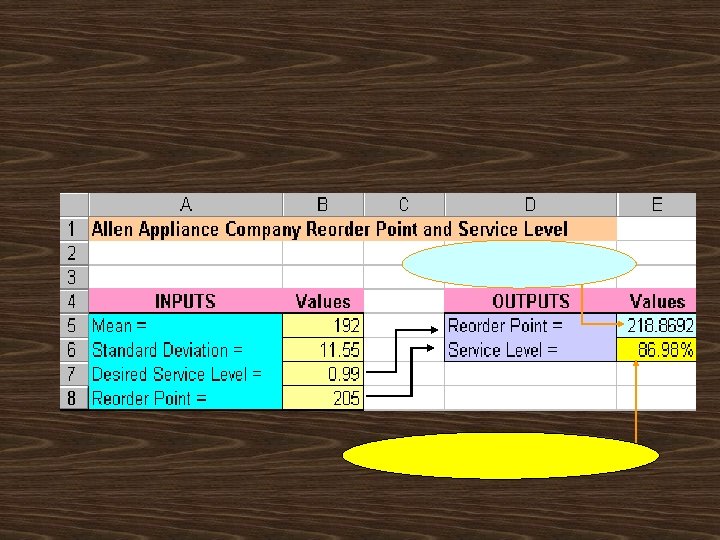
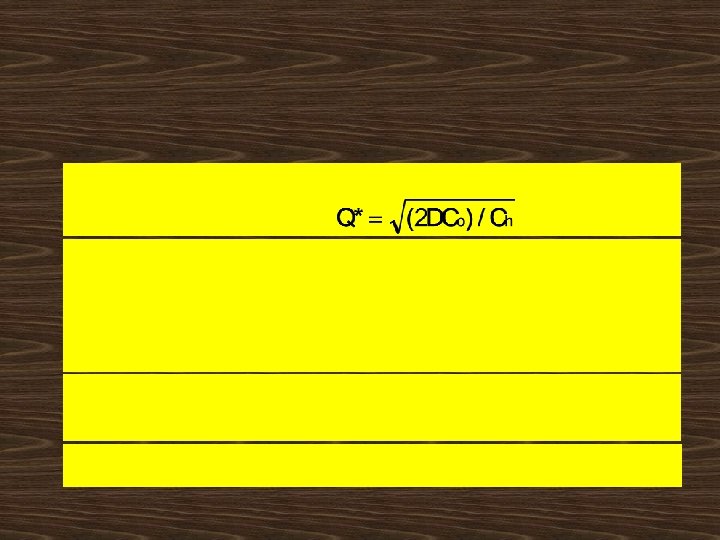
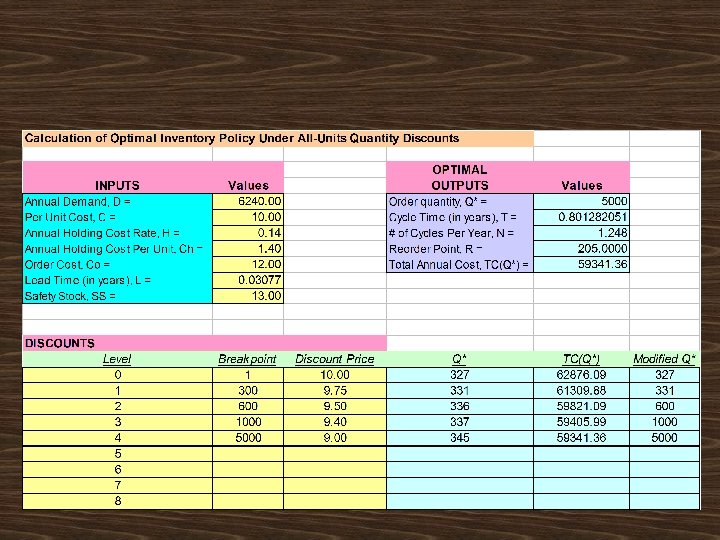
 = = 327. 065 327

 working days per week
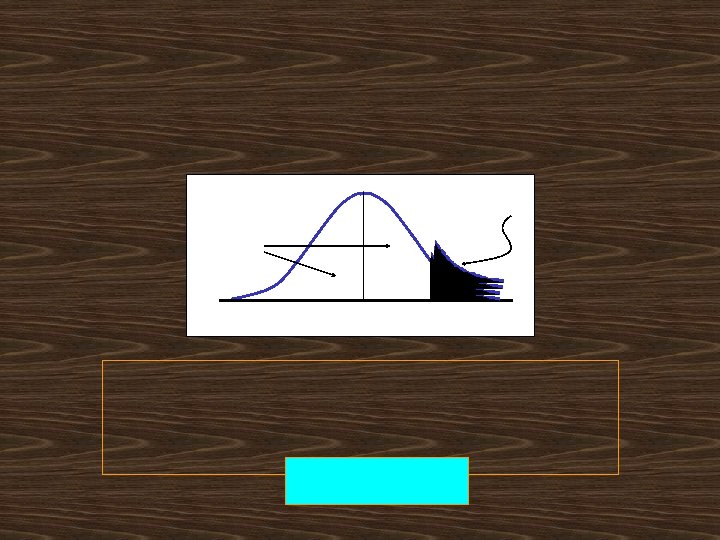
 Service Levels and Safety Stocks


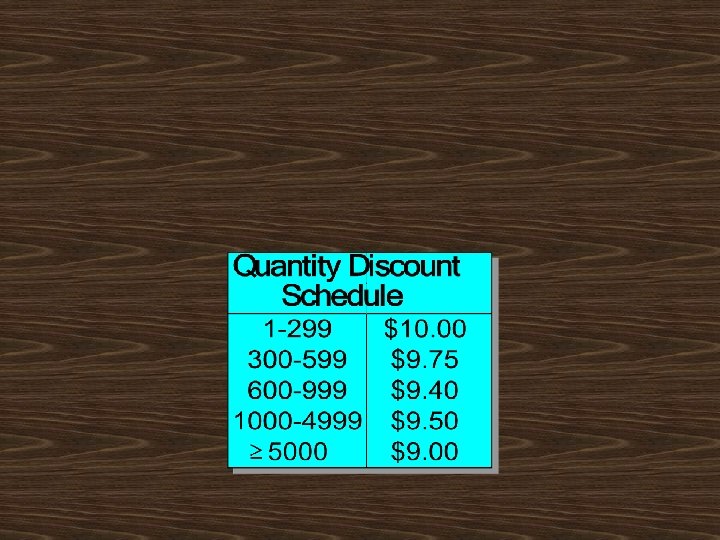
 Should AAC increase its regular order of 327 juicers, to take advantage of the discou
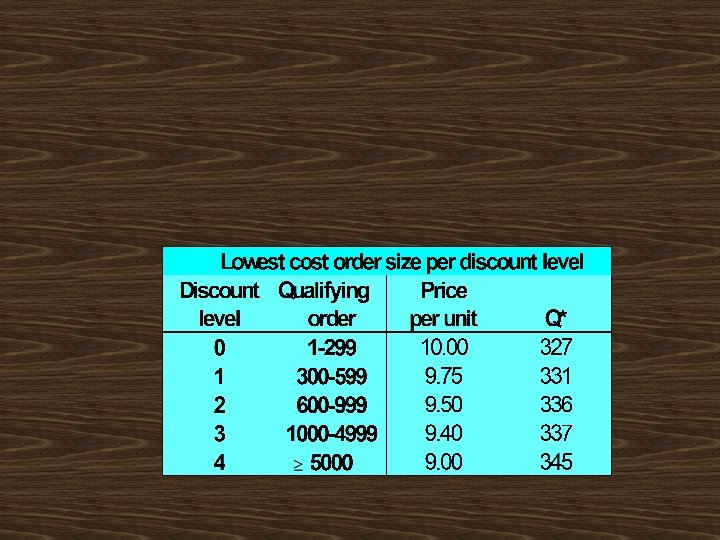
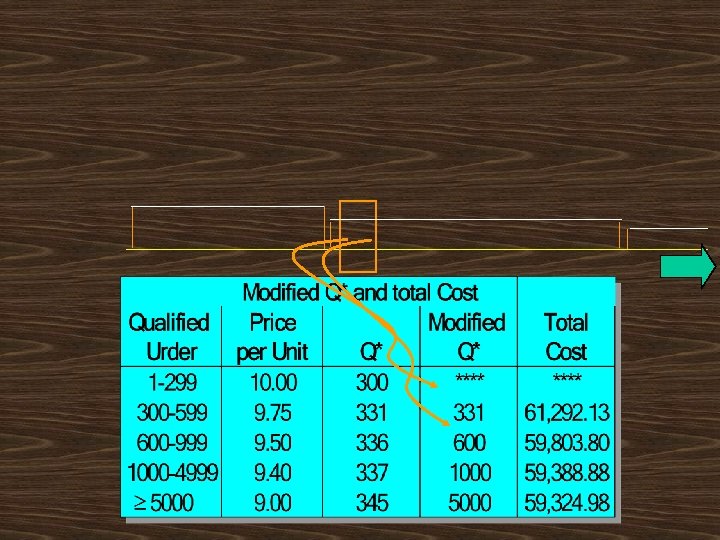
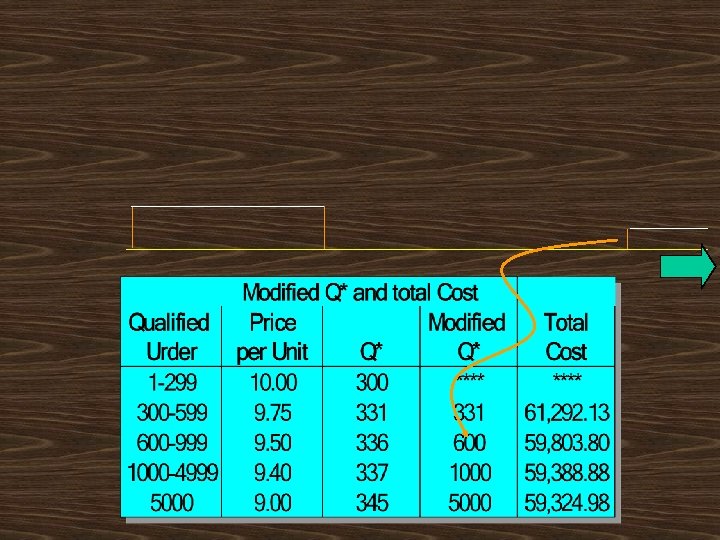
 AAC should order 5000 juicers


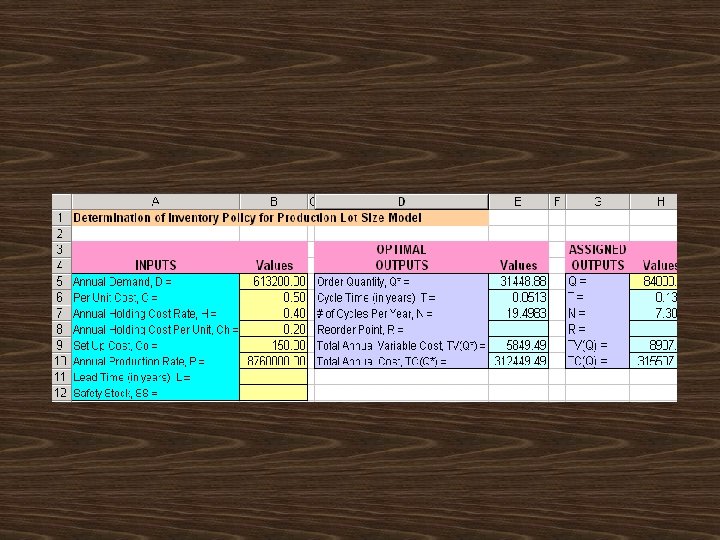
 P is the annual production rate The average inventory


(150) (0. 2)(1 -613, 200/8760, 000)") 2(613, 200)(150) (0. 2)(1 -613, 200/8760, 000)
2(613, 200)(150) (0. 2)(1 -613, 200/8760, 000)


 T
T
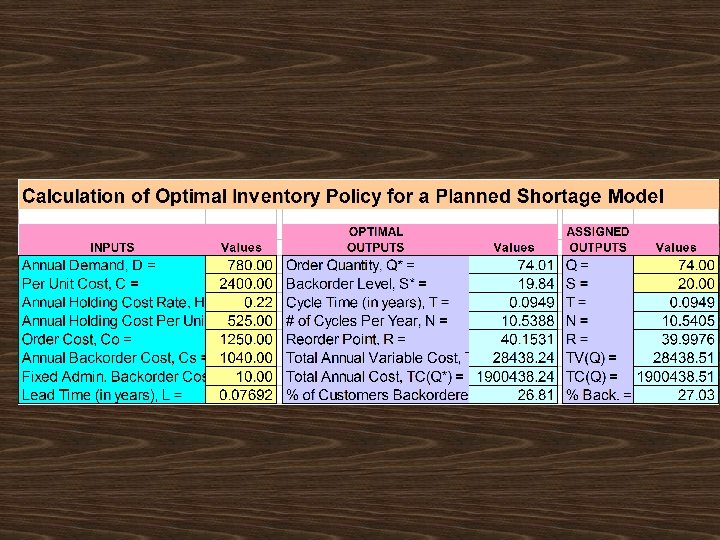
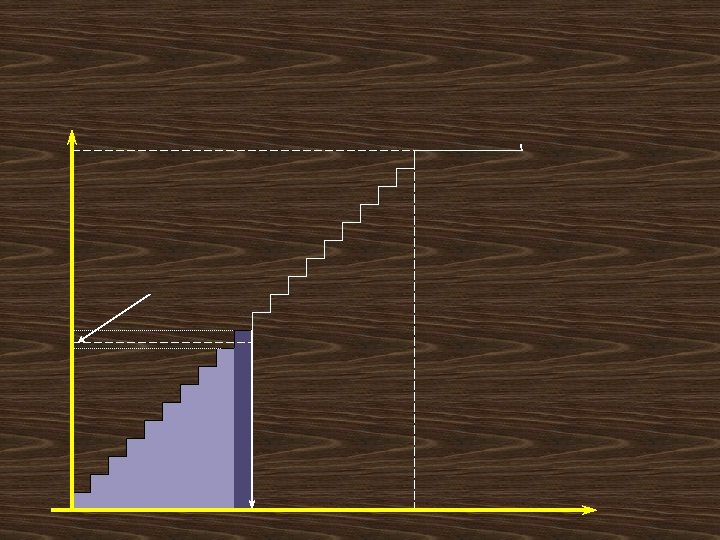
 / 2 Q-S Q S T T S") Average inventory = (Q - S) / 2 Q-S Q S T T S Average shortage = S / 2
Average inventory = (Q - S) / 2 Q-S Q S T T S Average shortage = S / 2

 Holding costs Ordering costs Time independent Time dependent backorder costs
 x
x


(125 525+10 x 40 0) 52 1040 5 (74)(525) (780)(10) 525 + 1040") 2(780)(125 525+10 x 40 0) 52 1040 5 (74)(525) (780)(10) 525 + 1040
2(780)(125 525+10 x 40 0) 52 1040 5 (74)(525) (780)(10) 525 + 1040


 T =Review period L = Lead time SS= Safety stock Q = Inventory position D = Annual demand I = Inventory position


 Replenishment level L T L Notice: I + Q is designed to satisfy the demand within an interva To obtain the replenishment level add SS to I + Q.


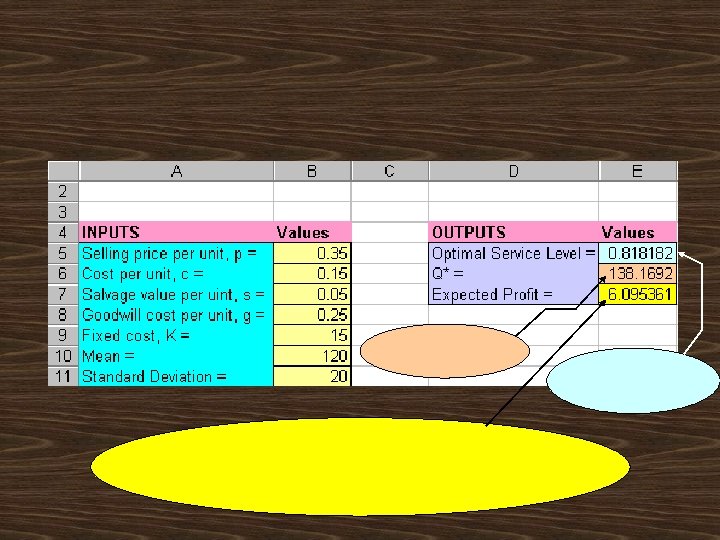
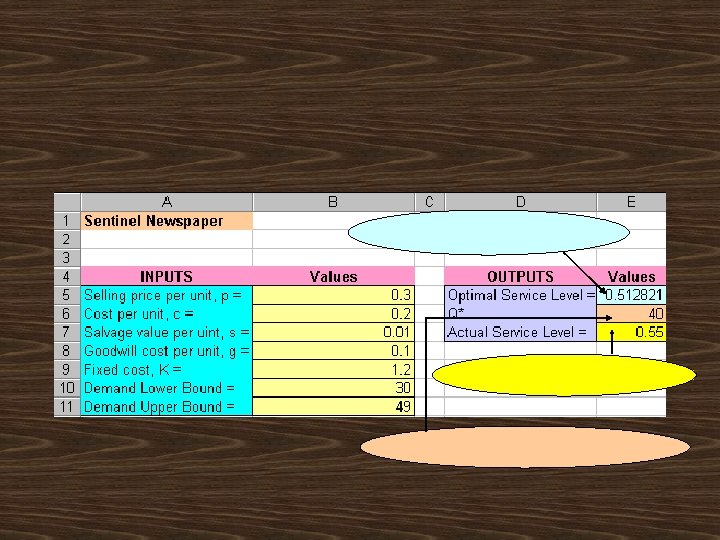
![EP(Q) = [p. X+s(Q - X) - c. Q - K]P(X) + [p. Q](https://present5.com/presentation/c51b14cde06e1e9de1b438f44073fc8f/image-96.jpg "EP(Q) = [p. X+s(Q - X) - c. Q - K]P(X) + [p. Q") EP(Q) = [p. X+s(Q - X) - c. Q - K]P(X) + [p. Q - g(X - Q) - c. Q
EP(Q) = [p. X+s(Q - X) - c. Q - K]P(X) + [p. Q - g(X - Q) - c. Q

 Demand distribution is discrete uniform between 30 and 49 newspapers.
 p+ g - c p+ g - s
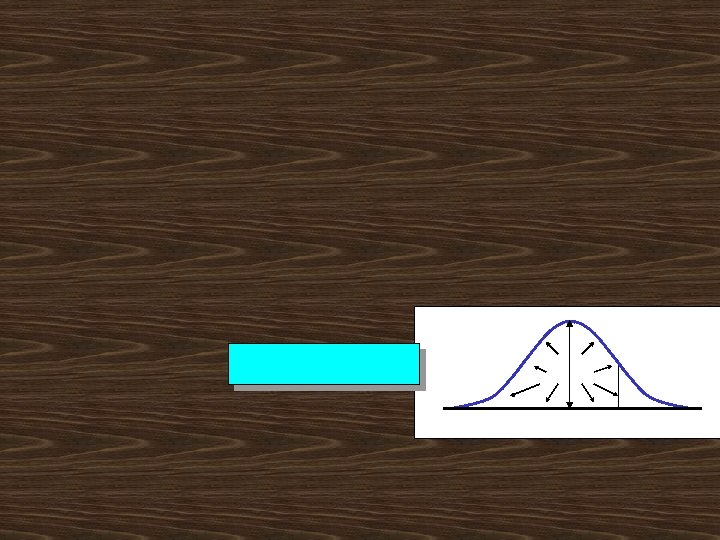
 Demand is normally distributed with a mean of 120, and a standard deviation of 20 donut
 p+ g - c p+ g - s
 = 0. 1004") L(0. 9) = 0. 1004
L(0. 9) = 0. 1004