d4789c6cf8ed4f793104bd0b39b7cb23.ppt
- Количество слайдов: 24
 Creative Media Analysis
 Creative Media Analysis Media research and measurement techniques n Audience measurement concepts and issues n Efficiency measurements for intermedia comparisons n Strategic analysis techniques n
 Media Measurements n Broadcast Media n Measurement services are Nielsen and Arbitron n Television • People Meters, 5, 000 TV Homes • Personal diaries, 210 market areas (DMA) n Radio • Personal diaries, 270 radio markets
 Media Measurements n Print Media n Measurement services are MRI and ABC n Magazines • Circulation, count of actual distribution • Readership, recent-reading measure n Newspapers • Circulation measures • Yesterday-reading measure
 Media Measurements n Other Media n Out-of-home, Traffic Audit Bureau • “daily circulation” n Internet, Nielsen/Net Ratings • Site visits measured by software • Like a “cookie” • 60, 000 panel members
 Audience Measurements n Audience Coverage n n Percentage of population that MIGHT be exposed to a particular medium Audience Composition n Percentage of a media audience that is comprised of the target population
 Audience Coverage and Composition Adult W 18 -24 Population 194, 341 6, 588 1, 943 Cosmopolitan 8, 982 2, 390 % Comp. 15. 66 29. 49 12, 404 Glamour % Cov. Totals
 Exercise Audience Coverage & Composition
 n n n Person(s) Using Television (PUT)") Audience Measurements n Households Using Television (HUT) n n n Person(s) Using Television (PUT) Broadcast Ratings n n Percentage of homes using television Percentage of an audience actually tuned in to a vehicle at the time measured Audience Share n Percentage of HUTs tuned in to a particular vehicle at the time measured
Audience Measurements n Households Using Television (HUT) n n n Person(s) Using Television (PUT) Broadcast Ratings n n Percentage of homes using television Percentage of an audience actually tuned in to a vehicle at the time measured Audience Share n Percentage of HUTs tuned in to a particular vehicle at the time measured
 Television Ratings and Share HH Rating Share NYPD Blue 6. 7 11 CSI: Miami 7. 2 12 Law & Order: SVU 9. 6 16 Diagnosis Murder 0. 7 1 35. 8 60 60. 0% 100 Other Shows Total HUT
 Exercise Ratings, Share, HUTs & PUTs
 n n Target Rating Points (TRPs) n") Audience Measurements n Gross Rating Points (GRPs) n n Target Rating Points (TRPs) n n The sum of all household rating points delivered by a media schedule The sum of all target audience rating points delivered by a media schedule Gross Impressions n The raw number sum of all message impressions delivered by a media schedule
Audience Measurements n Gross Rating Points (GRPs) n n Target Rating Points (TRPs) n n The sum of all household rating points delivered by a media schedule The sum of all target audience rating points delivered by a media schedule Gross Impressions n The raw number sum of all message impressions delivered by a media schedule
 Exercise GRPs & TRPs
 Audience Measurements n Audience Duplication n n Reach n n Each person counted for each time exposed Unduplicated percentage of a population exposed one or more times to a message Frequency n The average number of times each audience member is exposed to a message
 Exercise Reach & Frequency
 Efficiency Measurements n Cost-per-point, broadcast media Total cost of a media schedule n Divided by total rating points delivered n n Cost-per-thousand, all media Total cost of a media schedule n Divided by total (raw number) audience delivered n
 Exercise Efficiencies, CPP & CPM
 Strategic Analyses n Who to advertise to n n Where to advertise n n Target audience analyses Geographic analyses When to advertise n Scheduling analyses
 Strategic Analyses n The Index A magical mathematical tool n Simple division n • Index AB = (Number A/Number B)*100 n Standardizes numbers so we can more easily compare data • Significance testing • Plus or minus 10%
 Who to Advertise to n n n Typically an analysis of demographic data Typical data source is MRI or SMRB Index Analysis n n Index already calculated for standard measures But, we can’t always rely on standard measures alone
 base pct_ indx down acrs Women 90287 26982 100 29. 9 100 18 -24 25 -34 35 -44 45 -54 55 -64 65+ proj 7610 17961 20945 16386 10675 16710 1426 5946 7752 6200 2983 2674 5. 3 22. 0 28. 7 23. 0 11. 1 9. 9 18. 7 33. 1 37. 0 37. 8 27. 9 16. 0 63 111 124 127 93 54
 Where to Advertise Data-based analysis of brand/category sales n Many possible sources n Industry Associations or trade magazines n In-house sales tracking n Nielsen or MRI product data n n BDI/CDI (Power. Point)
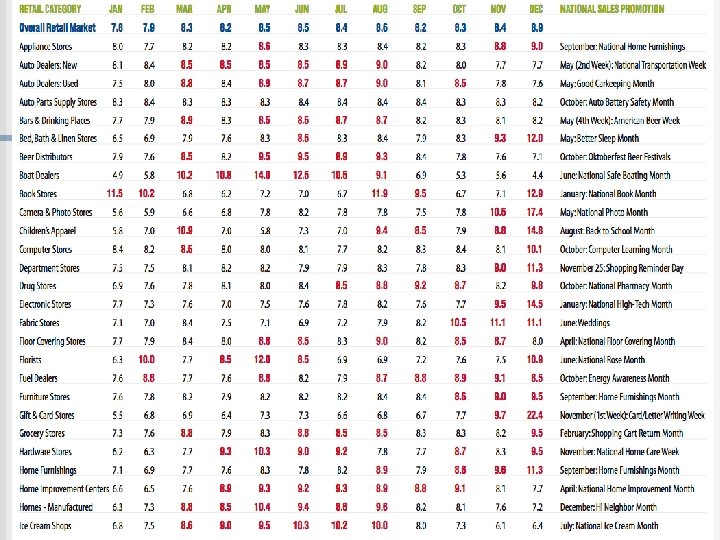
 When to Advertise n The Seasonal Development Index n n Expected Percentages Many possible sources Industry Associations or trade magazines n In-house sales data n