
Cost-effective Prescribing Dr. M á ir í n


- Размер: 1.6 Mегабайта
- Количество слайдов: 68
Описание презентации Cost-effective Prescribing Dr. M á ir í n по слайдам
Cost-effective Prescribing Dr. M á ir í n Ryan
Pharmacoeconomics : that branch of health economics that focuses upon the costs and benefits of drug therapy limited resources maximum health impact from a given budget cost-effective prescribing
Economic evaluation always involves a comparative analysis of alternative courses of action
Opportunity Cost PPARS Herceptin for breast cancer
National Centre for Pharmacoeconomics • Established with financial support from the Department of Health and Children • Aims to promote expertise in Ireland for the advancement of the discipline of pharmacoeconomics through education, practice and research. D e p t o f H e a l t h. R e s e a r c h. E d u c a t i o n C e n t r e www. ncpe. ie
Drug expenditure (€ Millions) under the Community Drugs Scheme betw een 1994 and 2004 0 200 400 600 800 1000 1200 1400 1600 GMS Total
Top 10 products of highe st cost to the GMS for the y ear e nde d 2004 in the orde r of the ir total ingre die nt cost 051015202530 AMLODIPINE ESOMEPRAZOLE CLOPIDOGREL LANSOPRAZOLE SALMETEROL AND DRUGS FOR COPD OLANZAPINE OMEPRAZOLE PRAVASTATIN CLINICAL NUTRITIONAL PRODUCTS ATORVASTATIN € million
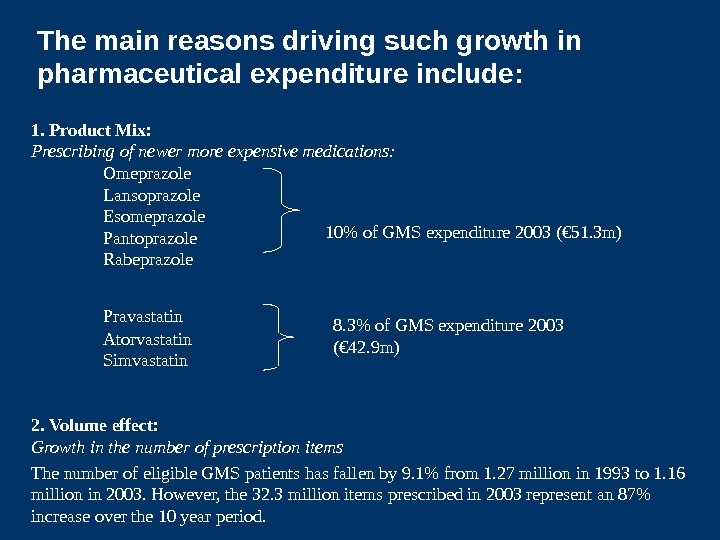
1. Product Mix: Prescribing of newer more expensive medications: Omeprazole Lansoprazole Esomeprazole Pantoprazole Rabeprazole Pravastatin Atorvastatin Simvastatin 2. Volume effect: Growth in the number of prescription items The number of eligible GMS patients has fallen by 9. 1% from 1. 27 million in 1993 to 1. 16 million in 2003. However, the 32. 3 million items prescribed in 2003 represent an 87% increase over the 10 year period. 10% of GMS expenditure 2003 (€ 51. 3 m) 8. 3% of GMS expenditure 2003 (€ 42. 9 m)The main reasons driving such growth in pharmaceutical expenditure include:
Spending on Drugs is a major Target for Savings in Health Care costs because of the. . . • Volume of Drug Expenditure • Highly visible nature of drug utilization • Perception that the drug budget is not being used to the best advantage • Perception that savings can be made without detriment to patients • Avoids having to address sensitive issues relating to other areas of the Health Care Budget
Improving cost-effectiveness of pharmaceutical expenditure • Review pricing mechanism • Generic prescribing • Cost-effective prescribing
IPHA agreement: governs price of drugs in Ireland • Price linked to high price countries • Automatic reimbursement • Price freeze since 1993 • Contribution of pharmaceutical industry to the economy • 2006 Renegotiation – Realignment of prices – Generic substitution – PE evaluation prior to reimbursement
Netherlands Denmark Germany France. Ireland Britain. Ireland links its drug price by formula to those of five other member states
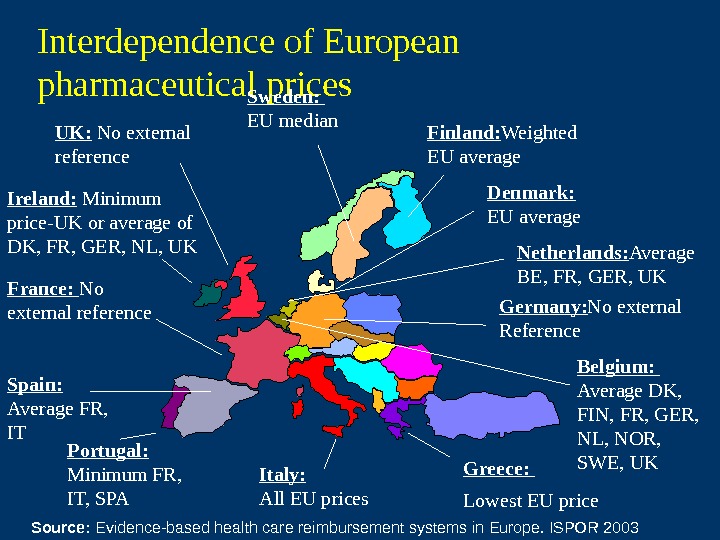
Interdependence of European pharmaceutical prices Finland: Weighted EU average. Sweden: EU median Denmark: EU average Germany: No external Reference. France: No external reference Spain: Average FR, IT Portugal: Minimum FR, IT, SPA Italy: All EU prices Greece: Lowest EU price Belgium: Average DK, FIN, FR, GER, NL, NOR, SWE, UKNetherlands: Average BE, FR, GER, UKIreland: Minimum price-UK or average of DK, FR, GER, NL, UK UK: No external reference Source: Evidence-based health care reimbursement systems in Europe. ISPOR
International Pharmaceutical Price Comparisons Tilsonetal. Thehighcostofmedicinesin. Ireland: is ittimetochangethepricingmechanism? Eur. J Health. Econ.
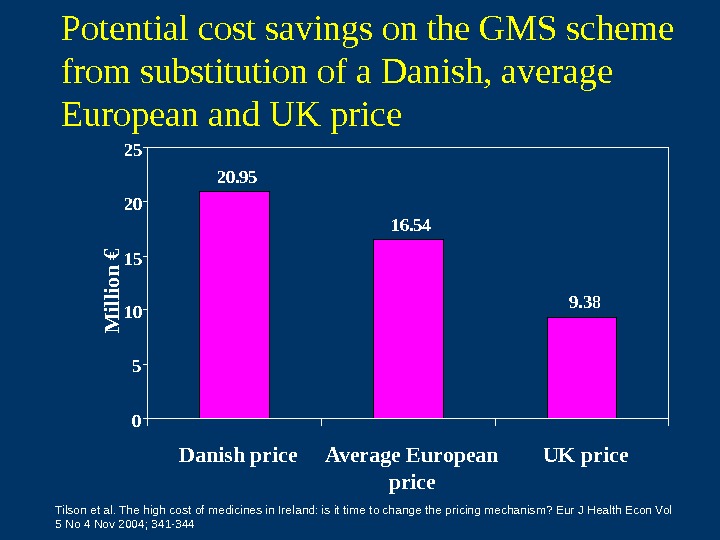
Potential cost savings on the GMS scheme from substitution of a Danish, average European and UK price 20. 95 16. 54 9. 38 051015 2025 Danish price Average European price UK price. M illio n € Tilson et al. The high cost of medicines in Ireland: is it time to change the pricing mechanism? Eur J Health Econ Vol 5 No 4 Nov 2004; 341 —
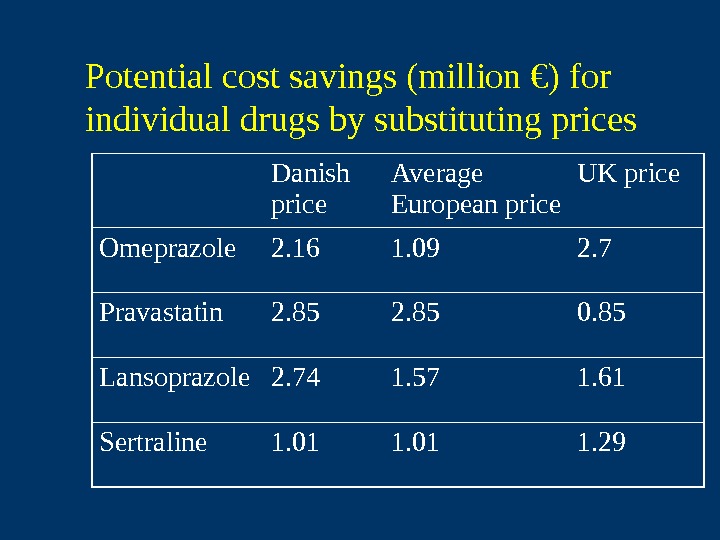
Potential cost savings (million €) for individual drugs by substituting prices Danish price Average European price UK price Omeprazole 2. 16 1. 09 2. 7 Pravastatin 2. 85 0. 85 Lansoprazole 2. 74 1. 57 1. 61 Sertraline 1. 01 1.
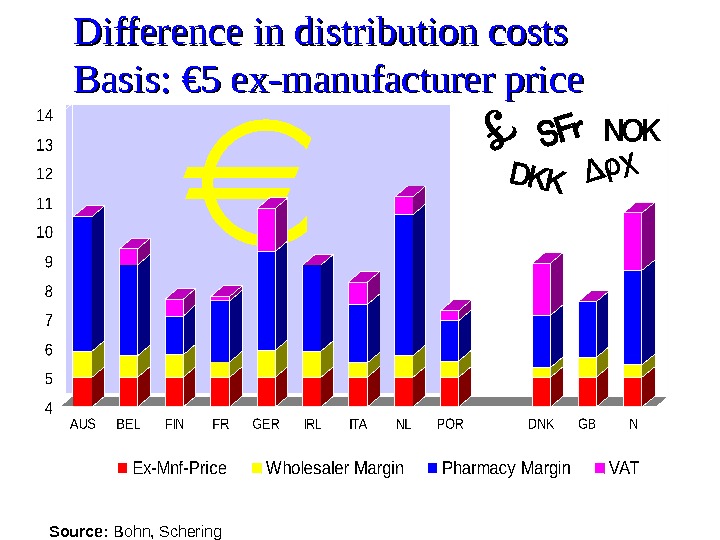
Difference in distribution costs Basis: € 5 ex-manufacturer price Source: Bohn, Schering
Conclusion Possible explanations for the differences in prices: The wholesale margin is higher in Ireland than in the UK and Denmark. Exchange rate fluctuations. Generic substitution in Denmark makes market more competitive. Price freeze in Ireland since 1993 – no system in Ireland to revise prices in line with the reference countries.
Improving cost-effectiveness of pharmaceutical expenditure • Review pricing mechanism • Generic prescribing • Cost-effective prescribing
The potential impact of introducing a system of generic substitution on the Community Drug Schemes in Ireland Lesley Tilson, Kathleen Bennett, Michael Barry. Eur J Health Economics Sep 2005 Vol 6 Issue 3. 267 —
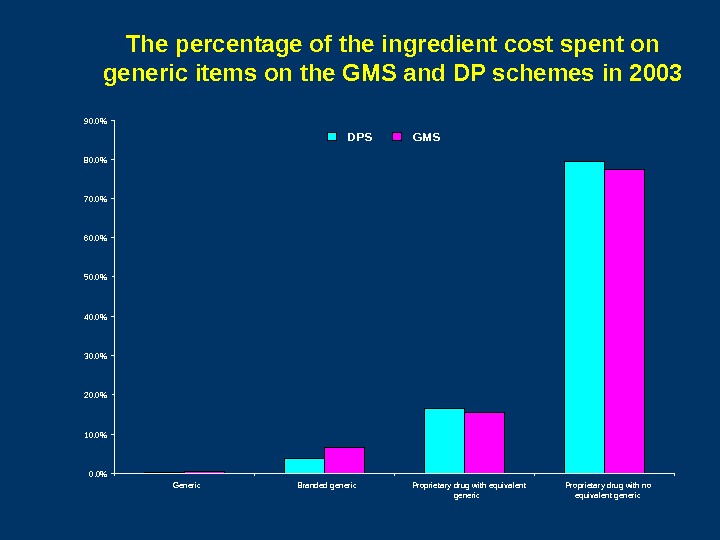
Objectives 1. 1. To investigate the level of generic drug utilisation on the GMS and DP schemes for all Health Board areas in 2003. 2. 2. To carry out a cost-minimisation analysis to determine the potential savings to the drugs budget if a system of generic substitution were implemented.
The percentage of the ingredient cost spent on generic items on the GMS and DP schemes in 2003 0. 0%10. 0%20. 0%30. 0%40. 0%50. 0% 60. 0% 70. 0%80. 0%90. 0% Generic Branded generic Proprietary drug with equivalent generic Proprietary drug with no equivalent generic. DPS GMS
Potential Savings from Generic Substitution of cheapest generic equivalent Substitution of average price of generic equivalent Substitution of maximum price of generic equivalent Estimated savings on the GMS € 12. 7 million € 10. 9 million € 9. 0 million Estimated savings on the DPS* € 9. 1 million € 7. 7 million € 6. 4 million * Including savings due to the 50% pharmacy mark-up
Prescribe generically!
Improving cost-effectiveness of pharmaceutical expenditure • Review pricing mechanism • Generic prescribing • Cost-effective prescribing:
Cost-effective prescribing How well are we doing? • Do we prescribe generically? • Do we adhere to evidence based guidance on treatment and prevention? • Do we prescribe the safest therapies? • Do we select the most cost-effective options?
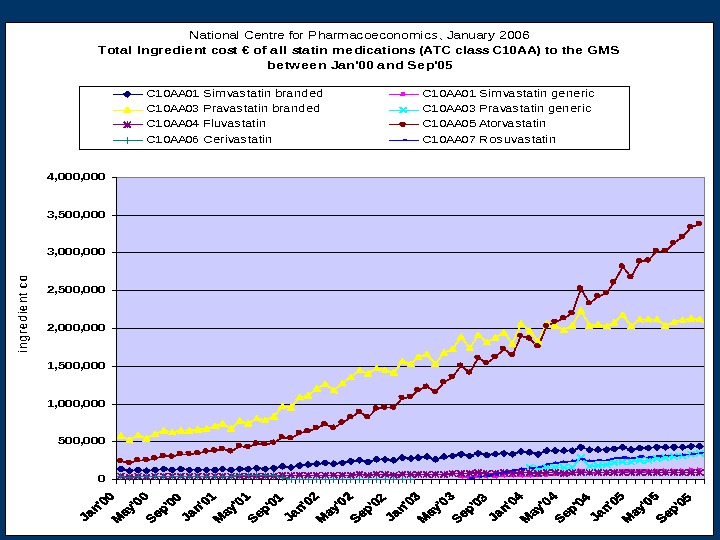
National Centre for Pharmacoeconomics, January 2006 Tota l Ingre die nt cost € of all sta tin me dica tions (ATC cla ss C 10 AA) to the GMS be tw ee n Ja n’00 a nd Se p’05 0 500, 000 1, 500, 000 2, 500, 000 3, 500, 000 4, 000 ingredient cost C 10 AA 01 Sim vas tatin branded. C 10 AA 01 Sim vas tatin generic C 10 AA 03 Pravas tatin branded. C 10 AA 03 Pravas tatin generic C 10 AA 04 Fluvas tatin. C 10 AA 05 Atorvas tatin C 10 AA 06 Cerivas tatin. C 10 AA 07 Ros uvas tatin
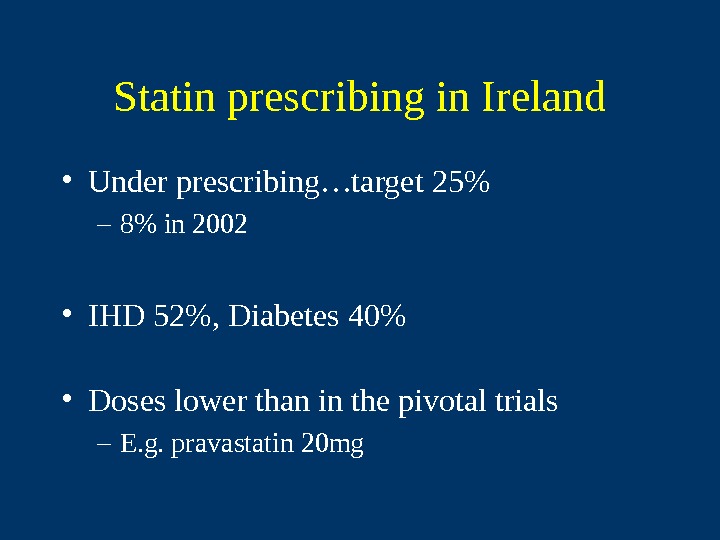
Statin prescribing in Ireland • Under prescribing…target 25% – 8% in 2002 • IHD 52%, Diabetes 40% • Doses lower than in the pivotal trials – E. g. pravastatin 20 mg
Regional variation in prescribing for diabetes and use of secondary preventative therapies in Ireland. C Usher at al Pharmacoepidemiology & Drug Safety
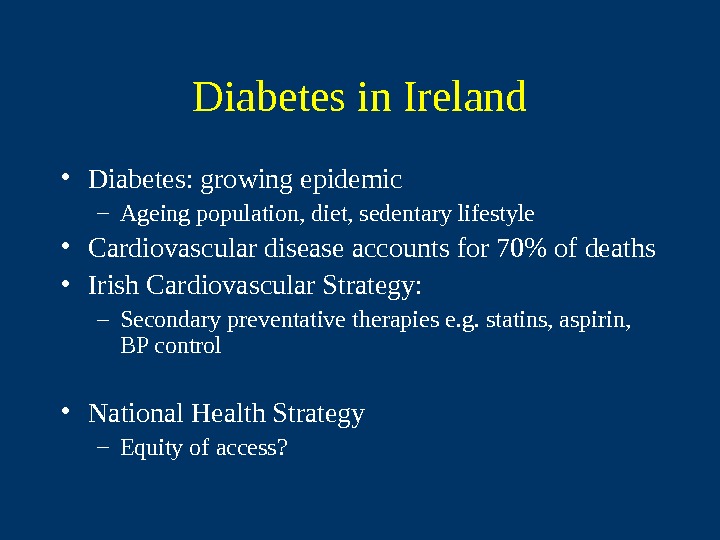
Diabetes in Ireland • Diabetes: growing epidemic – Ageing population, diet, sedentary lifestyle • Cardiovascular disease accounts for 70% of deaths • Irish Cardiovascular Strategy: – Secondary preventative therapies e. g. statins, aspirin, BP control • National Health Strategy – Equity of access?
Standardised Hospital Discharge Rates for persons with diabetes / health board region Region IDDM NIDDM EHB 110. 3 104. 1 WHB 98. 6 95. 1 MHB 112. 8 130 MWHB 114. 7 111. 4 SEHB 97. 3 116. 1 NWHB 77. 6 87. 1 SHB 104. 3 96. 4 NEHB 98. 8 109.
Adjusted ORs for prescribing of ASPIRIN to NIDDM patients by gender 00. 20. 40. 60. 8 11. 21. 41. 61. 8 EH B W H B M W H B N EH B N W H B SEH B SH B M H
Adjusted ORs for prescribing of STATINS to NIDDM patients by gender 00. 20. 40. 60. 8 11. 21. 41. 61. 8 2 EHB WHB MWHB NEHB NWHB SEHB SHB MH
Adjusted ORs for prescribing of ACEi to NIDDM patients by gender 00. 20. 40. 60. 8 11. 2 1. 4 E H B W H B M W H B N E H B N W H B SE H B SH B M H
Cost-effective prescribing How well are we doing? • Do we prescribe generically? • Do we adhere to evidence based guidance on treatment and prevention? • Do we prescribe the safest therapies? • Do we select the most cost-effective options?
Usage of paracetamol containing combination analgesics remains high in primary care C Usher et al. BJCP
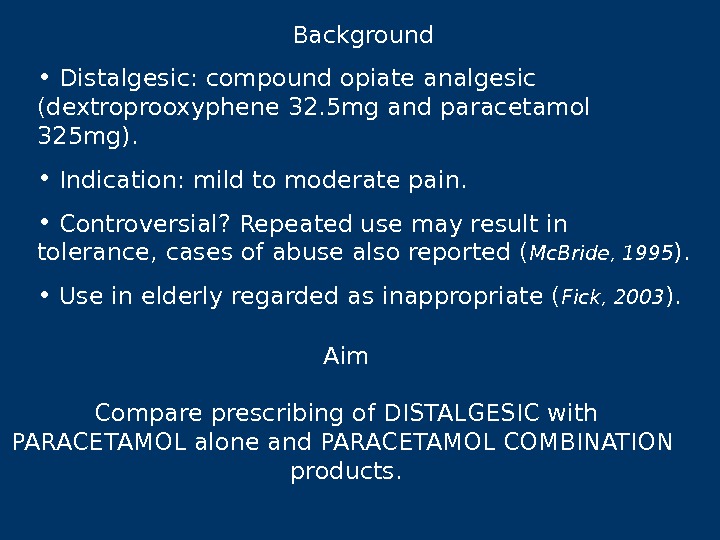
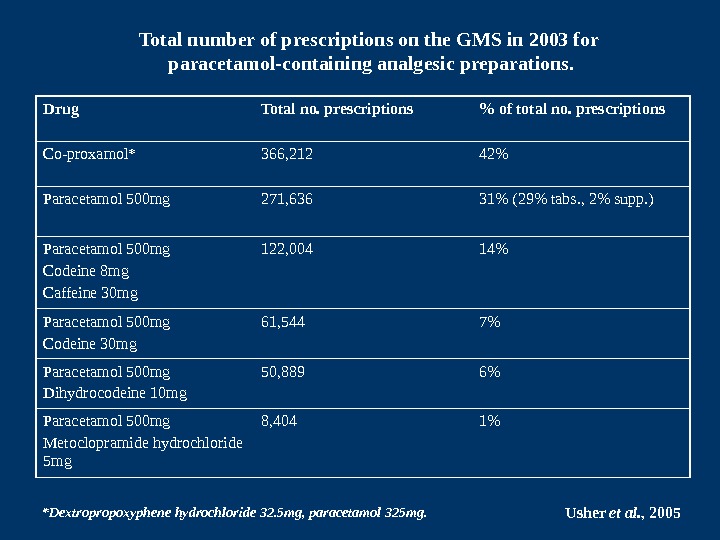
Background • Distalgesic: compound opiate analgesic (dextroprooxyphene 32. 5 mg and paracetamol 325 mg). • Indication: mild to moderate pain. • Controversial? Repeated use may result in tolerance, cases of abuse also reported ( Mc. Bride, 1995 ). • Use in elderly regarded as inappropriate ( Fick, 2003 ). Aim Compare prescribing of DISTALGESIC with PARACETAMOL alone and PARACETAMOL COMBINATION products.
Drug Total no. prescriptions % of total no. prescriptions Co-proxamol* 366, 212 42% Paracetamol 500 mg 271, 636 31% (29% tabs. , 2% supp. ) Paracetamol 500 mg Codeine 8 mg Caffeine 30 mg 122, 004 14% Paracetamol 500 mg Codeine 30 mg 61, 544 7% Paracetamol 500 mg Dihydrocodeine 10 mg 50, 889 6% Paracetamol 500 mg Metoclopramide hydrochloride 5 mg 8, 404 1%Total number of prescriptions on the GMS in 2003 for paracetamol-containing analgesic preparations. *Dextropropoxyphene hydrochloride 32. 5 mg, paracetamol 325 mg. Usher et al. ,
Odds Ratios and 95% Confidence Intervals for patients receiving follow-up prescriptions for the paracetamol-containing analgesic preparations 12 months post initiation of therapy Usher et al. , 2005 OR (95% CI) Female vs. male # OR (95% CI) Over 65 s vs. Under 65 s # Co — proxamol 1. 18 (1. 07 — 1. 28)*** 1. 71 (1. 57 — 1. 86)*** Paracetamol only 1. 28 (1. 16 — 1. 39)*** 2. 67 (2. 44 — 2. 93)*** Paracetamol combinations 1. 33 (1. 20 — 1. 47)*** 1. 69 (1. 53 — 1. 87)*** # Refere nce category. *p<0. 05; **p<0. 01; ***p<0. 001.
Cost-effective prescribing How well are we doing? • Do we prescribe generically? • Do we adhere to evidence based guidance on treatment and prevention? • Do we prescribe the safest therapies? • Do we select the most cost-effective options?
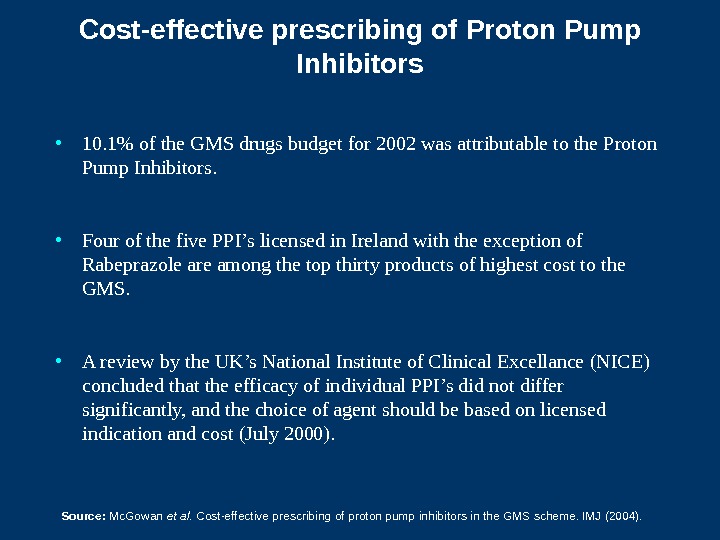
Cost-effective prescribing of Proton Pump Inhibitors • 1 0. 1 % of the GMS drugs budget for 2002 was attributable to the Proton Pump Inhibitors. • Four of the five PPI’s licensed in Ireland with the exception of Rabeprazole are among the top thirty products of highest cost to the GMS. • A review by the UK’s National Institute of Clinical Excellance (NICE) concluded that the efficacy of individual PPI’s did not differ significantly, and the choice of agent should be based on licensed indication and cost (July 2000). Source: Mc. Gowan et al. Cost-effective prescribing of proton pump inhibitors in the GMS scheme. IMJ (2004).
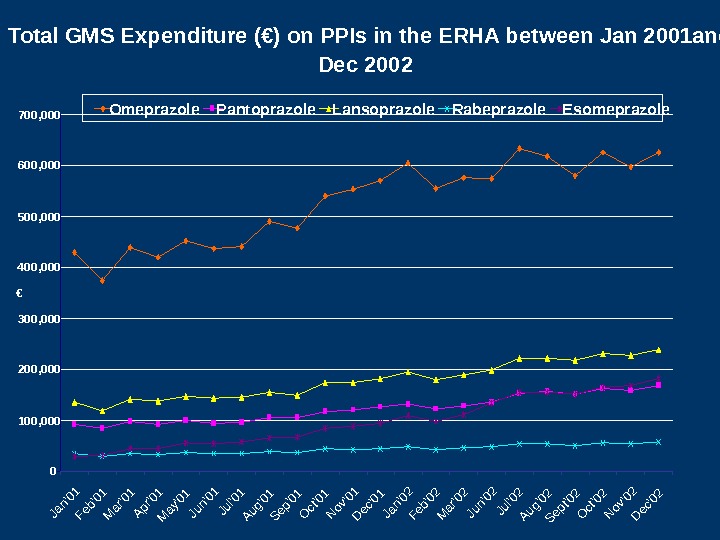
Total GMS Expenditure (€) on PPIs in the ERHA between Jan 2001 and Dec 2002 0100, 000200, 000300, 000400, 000 500, 000600, 000700, 000 Jan’01 Feb’01 Mar’01 Apr’01 May’01 Jun’01 Jul’01 Aug’01 Sep’01 Oct’01 Nov’01 Dec’01 Jan’02 Feb’02 Mar’02 Jun’02 Jul’02 Aug’02 Sept’02 Oct’02 Nov’02 Dec’02 € Omeprazole Pantoprazole Lansoprazole Rabeprazole Esomeprazole
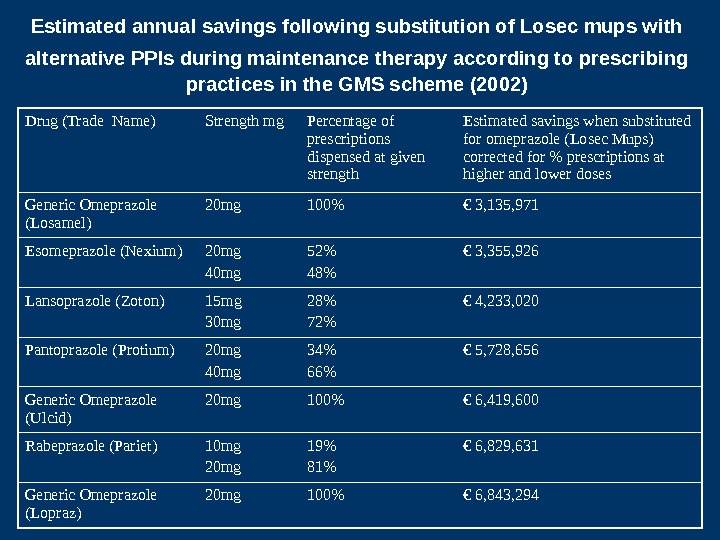
Estimated annual savings following substitution of Losec mups with alternative PPIs during maintenance therapy according to prescribing practices in the GMS scheme (2002) Drug (Trade Name) Strength mg Percentage of prescriptions dispensed at given strength Estimated savings when substituted for omeprazole (Losec Mups) corrected for % prescriptions at higher and lower doses Generic Omeprazole (Losamel) 20 mg 100% € 3, 135, 971 Esomeprazole (Nexium) 20 mg 40 mg 52% 48% € 3, 355, 926 Lansoprazole (Zoton) 15 mg 30 mg 28% 72% € 4, 233, 020 Pantoprazole (Protium) 20 mg 40 mg 34% 66% € 5, 728, 656 Generic Omeprazole (Ulcid) 20 mg 100% € 6, 419, 600 Rabeprazole (Pariet) 10 mg 20 mg 19% 81% € 6, 829, 631 Generic Omeprazole (Lopraz) 20 mg 100% € 6, 843,
Pharmacoeconomic Evaluation in Europe in 2004 Norwa y: Pharmacoeconomic data r equired for reimbursement; official guidelines in operation. Finland: Pharmacoeconomic evidence mandatory for evaluating new therapies for reimbursemen t and may also be requested for existing therapies. Sweden: C ost-effectiveness data required for reimbursement. Denmark: C ost-effectiveness data may be requested for reimbursement decisions. Britain: National Institute of Clinical Excellence (NICE) evaluate s the cost effectiveness of medicine s. Guidelines updated April 2004. Germany: Guidelines prepared. No formal requirement for reimbursement but likely to play a growing role in the future. France: Not a formal requirement but increasingly used in reimbursement decisions; Guidelines prepared. Spain: Not a formal requirement. Guidelines prepared. Portugal: Cost benefit analysis incorporated into reimbursement decisions. Italy: Proof of cost-effectiveness required For pricing and reimbursement decisions. Greece: Guidelines for pharmacoeconomic studies prepared; cost-effectiveness data may be requested. Belgium: Not a formal requirement but a standard report format for economic evaluations has been published. Netherlands: Pharmacoeconomic evidence explicitly required for reimbursement of new products. Ireland: Guidelines for pharmacoeconomic studies prepared; cost-effectiveness data may be requested.
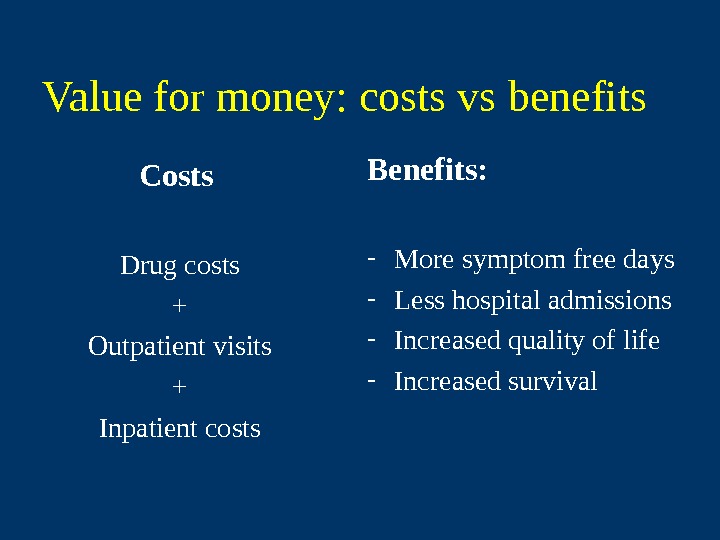
Value for money: costs vs benefits Costs Drug costs + Outpatient visits + Inpatient costs Benefits: — More symptom free days — Less hospital admissions — Increased quality of life — Increased survival
CONSIDER A NEW INTERVENTION, IF More effective and/or Less adverse events and/or More convenient THEN Less Other Drugs? Less Tests and Imaging? Less Physicians Consults? Less Interventions? Less or Shorter Hospital stay?
Typical Example: Cost Analysis of Drug B Vs. A Suppose B works better and is more convenient Average other treatment costs • Physicians • Hospital • Surgery • Oth. Drugs • Tests • ……. Total cost Average acquisition cost C AB B A + S AB B A = Snet = net saving
Cost Analysis of Drug B Vs. A (2) Idem but differences are Less pronounced Average other treatment costs • Physicians • Hospital • Surgery • Oth. Drugs • Tests • ……. Average acquisition cost Total cost C AB B A + S AB B A = B A Cnet = net cost
Cost Effectiveness The cost effectiveness of a therapeutic intervention may be expressed in terms of natural units such as life years gained or infection avoided i. e. COST/LYG It may be expressed in utility terms i. e. preferences that individuals or society may have for a set of health outcomes. The effects of treatment on both patient quality of life and survival are determined. i. e. COST/QALY
Incremental Cost Effectiveness Cost A – Cost B Effect A – Effect B or Cost Effect
The Cost — Effectiveness Plan e Higher Cost Lower Cost Higher Effectiveness. Q 1 Ceiling Incremental Cost — Effectiveness Ratio Q 3 Q 4 Q 2 Lower Effectiveness
COST-EFFECTIVENESS PLANE Difference in cost Difference in effect. M axim u m w illin g n ess to p ay R e g io n o f co st-effectiven ess
Economic Modelling: why is it necessary? • Absence of hard data • Need to synthesise comparisons: • e. g. head-to-head comparisons of therapies • Need to extrapolate • Over time –e. g. beyond trial follow-up period • Between intermediate and final outcomes
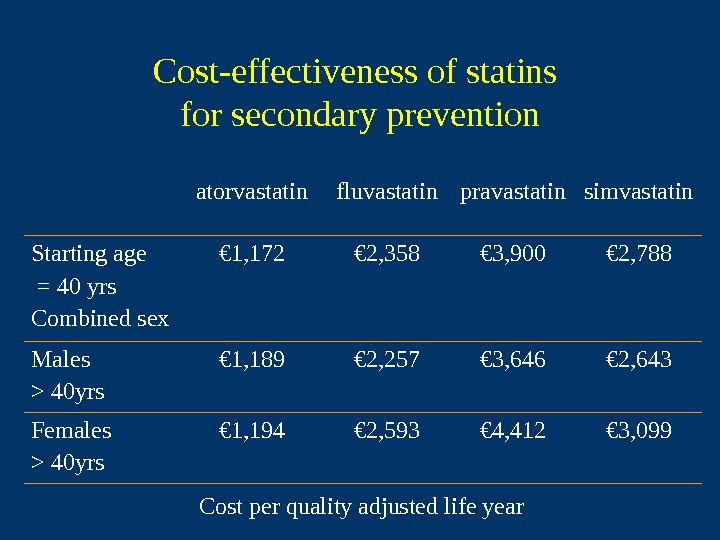
Cost-Effectiveness of Statins for the Secondary Prevention of Coronary Heart Disease in Ireland M Barry, A Heerey. IMJ May 2002; (95): 133 —
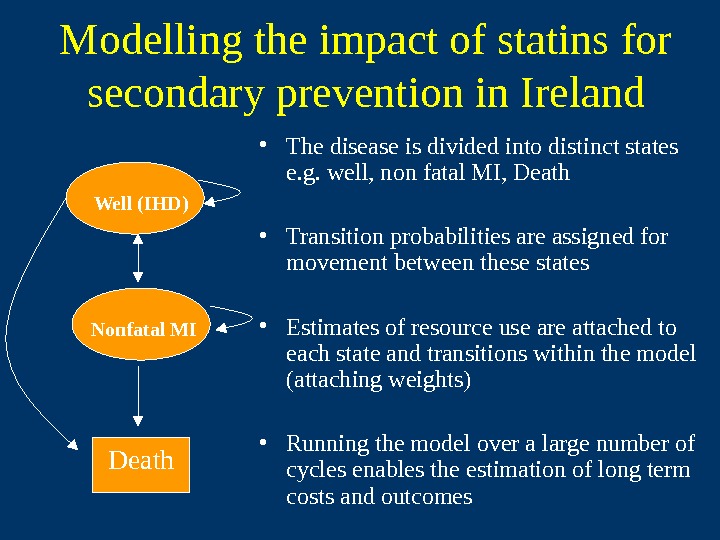
Modelling the impact of statins for secondary prevention in Ireland • The disease is divided into distinct states e. g. well, non fatal MI, Death • Transition probabilities are assigned for movement between these states • Estimates of resource use are attached to each state and transitions within the model (attaching weights) • Running the model over a large number of cycles enables the estimation of long term costs and outcomes. Death. Well (IHD) Nonfatal MI
Transition probabilities required Clinical effectiveness: 4 S Epidemiological : Irish life tables Death. Well (IHD) Nonfatal MI
Resource utilisation associated with transition states Drug costs Monitoring: Dr visits & labs Hospitalisation for MI Death. Well (IHD) Nonfatal MI
Cost-effectiveness of statins for secondary prevention atorvastatin fluvastatin pravastatin simvastatin Starting age = 40 yrs Combined sex € 1, 172 € 2, 358 € 3, 900 € 2, 788 Males > 40 yrs € 1, 189 € 2, 257 € 3, 646 € 2, 643 Females > 40 yrs € 1, 194 € 2, 593 € 4, 412 € 3, 099 Cost per quality adjusted life year
Cost / QALY league tables Intervention Cost/QALY Statins for hypercholesterolaemia € 1, 172 ACE inhibitor in heart failure € 1, 337 Beta blocker post MI € 7, 333 Radiation therapy in breast cancer € 35, 000 Mild acute HZV € 90, 000 EPO to augment autologous blood donation in elective surgery € 45,
CEA of statins summary • Cost-effectiveness analysis indicates that all statins available in Ireland are highly cost-effective for the secondary prevention of IHD • Adopting new drug strategies may result in increased drug expenditure but savings in other healthcare budgets. Formal economic evaluation allows comparison of increased costs with improvement in benefit
Role for economic evaluation • Individual patient level? • Policy level – Useful additional information to inform development of guidelines – Provides useful metric to combine all costs and savings associated with drug therapy and allow comparison within and between diseases If a therapy is not clinically effective, it cannot be cost-effective
MAIN LESSONS FROM THE USE OF ECONOMIC EVALUATION AT THE CENTRAL LEVEL • Demonstration of clinically-important benefits is still paramount. • Economic data are more important when there is substantial budgetary impact. • In reimbursement decisions, total refusal is rare; limitations or restrictions in use are much more common. Drummond
HOW ARE REIMBURSEMENT RULES OR GUIDANCE IMPLEMENTED? • Depends on the jurisdiction and clinical setting. • Use of hospital-based drugs can be influenced by budgetary controls and formulary listing. • Use of drugs in primary care can be influenced by clinical guidelines (e. g. approval ‘on authority’), financial incentives and formulary restrictions. Drummond
HIQA’s Three Areas of Responsibility Information Quality and Safety Health Technology Assessment
Health Technology Assessment “ a policy research approach that examines the short and long term social consequences of the application or use of technology” OTA, US: 1976 “ technology assessment in health care is a multidisciplinary field of policy analysis. It studies the medical, social, ethical, and economic implications of development, diffusion and use of health technology” INAHTA:
HTA functions of HIQA • To provide authoritative and robust analysis of Health Technology to inform decision making at all levels of the system from policy to practice. • To provide a single reference point for information on HTA and to coordinate the dissemination of HTA guidance. • To conduct horizon scanning within the area of HTA and so inform the selection of topics/interventions for appraisal in consultation with the Department of Health & Children and other interested parties. • To make recommendations for research where evidence is lacking or incomplete.