a77f0d507724c14574275f5d851180c1.ppt
- Количество слайдов: 40


Cost-Benefit Analysis March 9, 2017 MSSM Program Columbia University Satyajit Bose

Announcements • • Assignment 3 due Mar 16. Outlines due Apr 2. (No grade, just feedback). Please schedule feedback appointment (4/3 to 4/7). General Advice for Outline: – Identify audience and write with the appropriate tone and language – Work on identifying data sources for quantification early in the process – Search Econlit and use a variety of sources – Eliminate typos • Today: Finish Value of Information and start on Revealed Preference
 sources of value: – Reducing uncertainty affects decisions,")
Value of Information • Three (interrelated) sources of value: – Reducing uncertainty affects decisions, which has economic consequences. – Reducing uncertainty affects choices of others, which has economic consequences. – Information can be sold. • Information is not valued at production cost.

Value of Information • By how much would the information increase the expected value of playing the game? Value of information = E(NB) of the optimal choice in the game with information MINUS E(NB) of the optimal choice in the game without information.

Value of Information • If information does not impact optimal action, then value of information = 0. • Example: may not be worth investing in larger sample size if sample size is sufficiently large that additional observations will have minimal impact.

Example: Corn Speculation Drought Investor Buy futures No Drought $10, 000 -$2, 000 Buy $4, 000 fertilizer company stock $0 Investor’s opponent is Nature (i. e. whethere will be a drought or not)
 =. 9")
Example • Suppose the investor’s subjective probabilities over the events is pr(Drought) =. 9 and pr(No Drought) =. 1 • Suppose the investor’s wealth is $90, 000 and he has the utility function U = -e-0. 0002 W • What is the utility value of information that tells the investor whether the drought will happen for sure?
")
Example • With imperfect information, investor prefers to buy corn futures: EU(Buy corn futures) =. 9×U($100, 000) +. 1×U($88, 000) = see spreadsheet EU(Buy fertilizer company) =. 9×U($94, 000) +. 1×U($90, 000) = see spreadsheet

Example: Demand Forecasts • On Thurs evening, the manager of a car rental agency branch has 6 cars on hand for rental the next day. She can request delivery of additional cars from the regional depot at $20 each. Each car rented produces an expected profit of $40. She finds that on previous Fridays, the cars requested were: 7, 9, 8, 7, 10, 8, 7, 8 , 9, 10, 7, 6, 8, 9, 8, 8, 6, 7, 7, 9. How many cars should she order? What is the expected value of perfect information?

Value of Information • Attempting to understand the value of information prevents us from falling into the trap of measuring only that which is easily measured. • Direct investment in learning towards resolving the uncertainty with the highest value.

Quasi-Option Value • Quasi-option value is the gain in the expected value of information due to delaying an irreversible decision. • Requires multi-period decision modeling – Exogenous learning: learning is revealed no matter what option is taken. (No activity often optimal) – Endogenous learning: information is generated only through the activity itself. (Limited activity) often optimal.

Quasi-Option Value • Example: Waiting 2 years to invest in a new solar plant with a 30 year life, because a new technology may improve efficiencies.

Demand Curve Estimation • To determine the monetized impacts of changes in policy or investments, when consumer surplus is an important component of benefit

Direct Estimation • We need measure the in social surplus • Need to know the shape and position of demand supply curves, before and after the intervention • Focus on demand curves since in producer surplus usually small or easily computed from in supplier profits.

Linear Demand Curve

Constant Elasticity Demand Curve

Econometric Estimation • Specify the econometric model. – Include all feasible independent variables, even if you are not specifically interested in their effect. – Choose the functional form.

Example You are lending funds for solar roof installations but recognize that the homeowner may sell the home before she realizes the full electricity savings benefits. Suppose you are asked to estimate the increase in value to a home when a solar roof is installed. Describe the steps in your analysis.

Example Price of Homes with solar roofs = constant term + 1 × acreage + 2 × square footage + 3 × solar roof dummy + 4 × solar roof dummy×square footage + error term

Indirect Estimation • Estimating shadow prices from observed behaviour where markets for the environmental good do not exist (also known as revealed preference)

Components of Value • Use Value • Nonuse Value – In surveys, values are assigned to environmental goods when there can be no obvious use value. – Existence value, altruistic value or bequest value

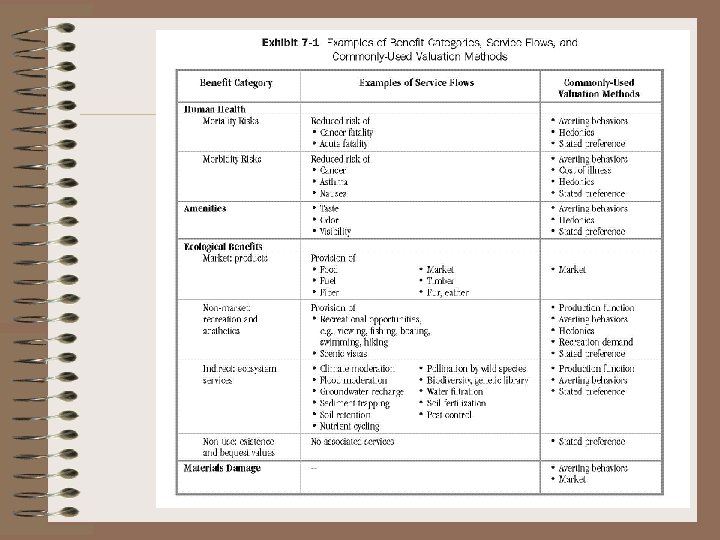
Indirect Estimation • Measuring demand without markets and without utility functions: 1. Revealed preference or market methods. (use values only) a) Hedonic price models b) Household production models (travel cost, defensive expenditure) 2. Stated preference methods (use and non-use values) a) Contingent valuation methods b) Experimental markets c) Political referenda 3. Benefits transfer

Revealed Preference Methods • Can only cover what has been done, not what would be done under specified conditions • Greatest success in measuring value placed on: – Use of recreational resources. – Perceptible differences in air quality.

Market Analogy Method • This method uses data on similar goods in the private market to estimate the implicit “price” or the demand curve for publicly provided goods. – Ideally, construct a demand curve (rather than estimate price or expenditure) for the publicly provided good

The Trade-Off Method • Use the opportunity cost as a measure of value: • Example: Time saved valued at after-tax wage rate • Example: value of statistical life measured by the wages people demand for increases in fatality risk

Value of Time Saved • Without market imperfections (people can choose the # of hours of work and there is no unemployment), the wage rate equals the marginal value of time. • Adjustments: – Benefits and taxes – Enjoyment of work – Wage rate may differ from marginal social product

Moment of Silence “Let us have a moment of silence for all those Americans who are stuck in traffic on their way to the gym to ride the stationary bicycle. ” – Rep. Earl Blumenauer

Intermediate Good Method • If a project produces an intermediate good that is not sold in a well functioning market, then its value can be imputed by determining the value added to the “downstream activity”: Annual Benefit = Net income of downstream activity (with project) – Net Income of downstream activity (without project)

Asset Valuation Method • If impacts are capitalized into asset prices (requires that asset markets be functioning perfectly), then changes in asset values measure impact.

Hedonic Price Method • Is a revealed preference method of evaluating environmental goods • Many goods are composite bundles of attributes • Hedonic pricing attempts to infer the value of specific attributes by observing prices of many different bundles • It attempts to address the omitted variable and selection biases inherent in the asset price method. • Assumes: – Demand for a market good is dependent on the quantity of the (inseparable) environmental good, e. g. houses and air quality – Consumers are optimizing utility, even though we do not observe utility – There is sufficient variety in levels of the environmental good to allow useful estimation – Is relevant only for small changes in the attribute

Example Price of Homes with wetlands = constant term + 1 × acreage + 2 × square footage + 3 × wetland dummy + error term
 • Estimate the value of wetland amenities • Data")
Example: Mahan et al. (2000) • Estimate the value of wetland amenities • Data on 14, 000 actual house sales in Portland, Oregon • Data on proximity to wetland, size and type of wetland for each house.

Example: Mahan et al. • Explain house prices in Portland, deriving thereby an estimate of the marginal value of access to wetlands, as reflected in house prices – K control variables (# of rooms, living area, age of the house etc. ) – Fit the following equation:

Household Production Models 1. 2. 3. The household production model is a form of revealed preference environmental valuation. The model assumes that consumers combine a nonmarket good or bad with a market good to produce a synthetic good that yields utility. Defensive expenditure or averting models refer to models where consumption of a market good counteracts the effects of a non-market bad. Travel cost models refer to models where consumption of a market good must be combined with the non-market good to facilitate enjoyment of the non-market good.
 • Recognizes that the full price")
Travel Cost Method • Inspired by Hotelling (1947) • Recognizes that the full price paid by persons for a visit to a recreational site is admission fee PLUS the costs of traveling to and from the site.

Travel Cost Method 1. Select sample of households within the market area of the site. 2. Survey sample to determine numbers of visits to the site, all costs involved in visiting the site, costs of visiting substitute sites, incomes, and other control variables. 3. Specify a functional form for the demand schedule and estimate it using the survey data. 4. Compute consumer surplus.

Travel Cost Example

Defensive Expenditure Method • A defensive expenditure is an expenditure in response to something undesirable, such as pollution. The change in expenditures can be used as a measure of the cost of the change in pollution. • Observed defensive expenditure provides a lower bound on the willingness to pay to avoid the bad.

Criticisms of Revealed Preference Methods • Equates market values with values • Strongly influenced by the distribution of income • Selection Bias: – usually, visitors or averters comprise the sample – difficult, if not, impossible to control for risk aversion • Dynamic Aspects: – Averting behavior has many dimensions, e. g. not moving to a hurricane-prone area • Travel Cost: – Computing costs are not trivial: • the value of time • marginal vs. average costs – Zonal Travel Cost: low data requirements but unable to capture heterogeneity of consumers (beyond distance from site) – Individual Travel Cost: expensive data requirements
a77f0d507724c14574275f5d851180c1.ppt