bfbc3df2a4ec5eb53f1dc9b66c0264cf.ppt
- Количество слайдов: 25


Correlation and Regression Basic Concepts

An Example • We can hypothesize that the value of a house increases as its size increases. • Said differently, size and house value “covary” or “co-relate. ” • Further, we can hypothesize that the relationship is a simple linear one, e. g. , that as size increases, house value increases in a similar linear fashion. • Hence we can use the simple linear equation, • y = a + bx, to describe the relationship

We Ask Two Questions… • Is there a relationship and how strong is it? • What is the relationship? • We answer the first with a new statistic, a “correlation” coefficient. • We answer the second with a linear regression model.

Terms • • • Independent and Dependent variables Scatterplots Correlation, correlation coefficient, r Regression, regression coefficient, b Regression, regression constant, a Ordinary Least Squares (OLS) equation: y = a + bx + e

Issues • Defining relationships – Nature of the relationship: for the moment, linear – Strength of the relationship (using r) – Direction of the relationship (using r and b) – Calculation of the relationship: y = a + bx + e

Some useful websites • http: //davidmlane. com/hyperstat/A 60659. h tml • http: //digitalfirst. bfwpub. com/stats_applet/s tats_applet_5_correg. html • http: //mste. illinois. edu/activity/regression/

Illustration • Case A. x= 2. 5, y=2 • Case B. x=8, y = 7

Linear Trend

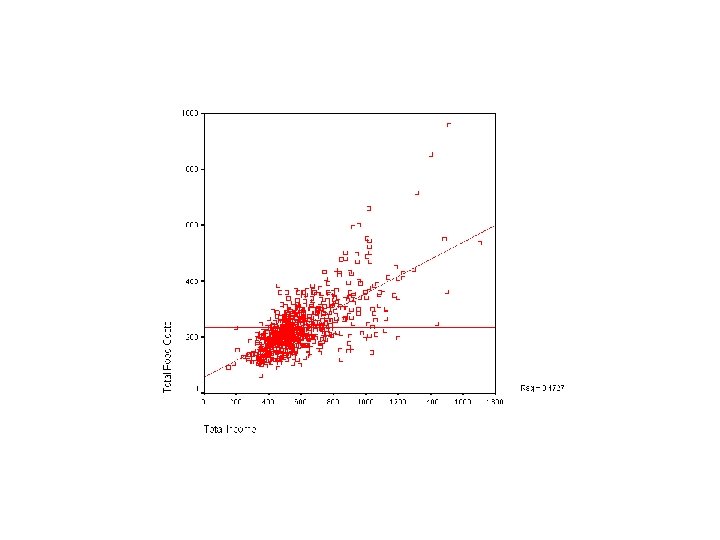
What if there are lots of data points?

If there are more data points? How do we summarize the relationships in the data?

Solution: Least Squares Regression, The Best Linear Fit

Some Theory • Knowing nothing else, the best estimate of a variable is its mean.

The Regression Model does better… • Deviation from y = yi – ymean

A Regression equation… • Measures the nature of the relationship between x and y using a linear model • Measures the direction of the relationship • Accompanying statistics, for the time being, r, measures the strength of the relationship.

Understanding the Improvement, measuring the deviations from the mean

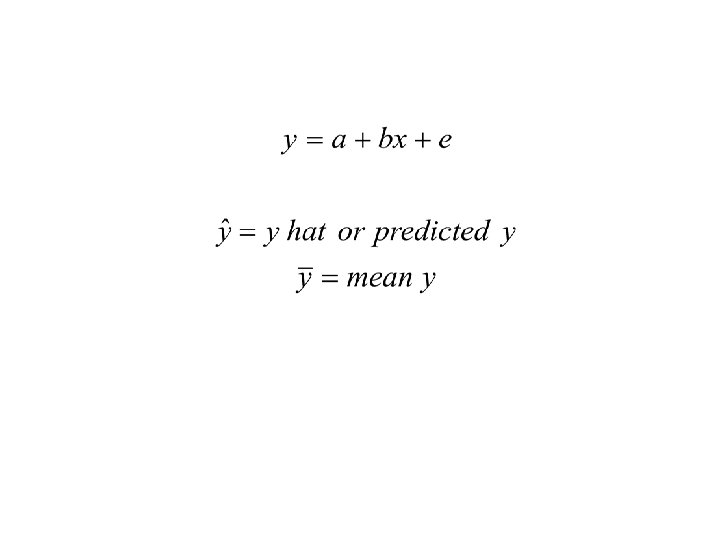
More Terms • Yi – the value of a particular case • Y mean – mean value of y • Y hat – y with a ^ above it soŷ • (Yi – Ymean) = total deviation from mean Y • (Yhat – Ymean) = explained deviation of Yi from Y mean • (Yi – Yhat) = unexplained deviation of Yi from Y mean

Bivariate Regression • Relationships are modeled using the equation, y = a + bx + e • Translation: The values of an interval level dependent variable, y, can be “predicted” or “modeled” by adding a constant, a, to the product of a slope coefficient, b, times the values of the independent variable, x, and an error term, e.

Estimating the Equation, y = a + bx + e • The regression equation is calculated by finding the equation that minimizes the sum of the squared deviations between the data points, the y’s, and the predicted y’s, also called y hat.

Correlation Coefficient: r • A measure of the strength of a linear relationship between two interval variables, x and y • Ranges from – 1 to + 1 • The higher the value of r (e. g. , the closer to -1 or + 1, the stronger the relationship between x and y

Correlation Coefficient calculation • r = Covariance of x and y divided by the product of the standard deviation of x and the standard deviation of y • Covariance is the sum of the products of the deviations of the cases divided by N.

Equations. . .

Calculating a and b

X 2. 5 4 8 Y 2 7 7
bfbc3df2a4ec5eb53f1dc9b66c0264cf.ppt