

0256f2e62a8b24d9a108e5a63e429a36.ppt
- Количество слайдов: 46
 Correcting the record of volcanic stratospheric aerosol impact: Nabro and Sarychev Peak Mike Fromm Naval Research Laboratory Remote Sensing Division Co-investigators: Gerald Nedoluha, Pat Kablick, James Campbell (NRL) Elisa Carboni, Don Grainger (University of Oxford) Jasper Lewis (NASA GSFC) Aerocenter Seminar, 19 May 2015
 NRL & the UTLS: Upper Troposphere & Lower Stratosphere
 Nabro volcano, Eritrea 13 June 2011 Saudi Arabia Red Sea Yemen Ethiopia Image credit: Scott Bachmeier
 Volcanicclouds 200+ strong Simon Carn Mike Fromm 17 km Lieven Clarisse “The 11 micron brightness temperature of the cloud early on was around -73 C. ” - Dave Schneider
 Why does this matter? What’s new here? Is it correct?
 The Asian Monsoon is big business! Scienceometer = logos x attendees x airline connections
 Source: The Huffington Post What’s new here? Adam Bourassa: "We used to think that a volcano had to have enough energy that it would put its aerosol and gas directly into the stratosphere in order for it to have a climate effect, but what we see now is that it can be a low altitude as long as it's say next to the Asian summer monsoon and then we can get a climate effect. ” "This is the first time that we've ever observed volcanic aerosol reaching the stratosphere via some other pathway. " The “other pathway? ” Monsoon thunderstorm convection
 From the volcano “textbook” - the classic pathway to the stratosphere Convective Thrust Gas Thrust Volcanic cumulonimbus
 From the cumulonimbus textbook
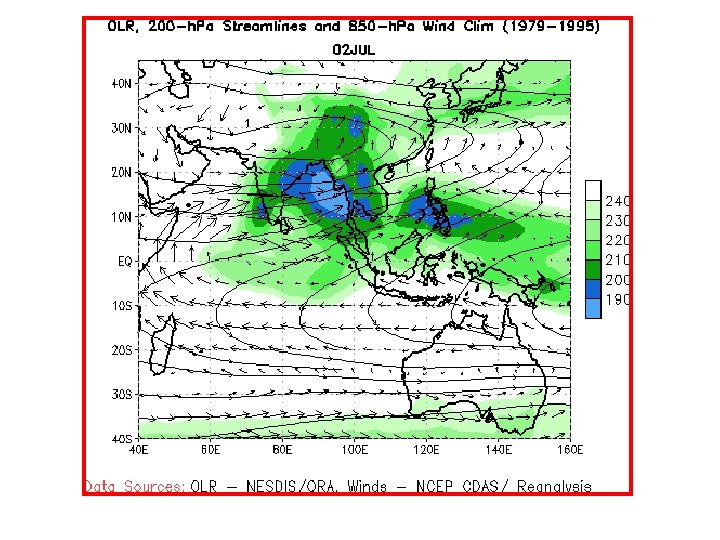
") The new volcano pathway… Here’s what is new, according to Bourassa et al. (2012) Monsoon thunderstorms This is quite provocative, considering: Asia - India – S. E. - garden variety * The long and winding road from Nabro long - daily, all summer - SO * Short lifetime of troposphericstagnant anticyclone 2 & sulfate (<<1 week). SO 2 and/or sulfates OLR SO 2 and/or sulfates
The new volcano pathway… Here’s what is new, according to Bourassa et al. (2012) Monsoon thunderstorms This is quite provocative, considering: Asia - India – S. E. - garden variety * The long and winding road from Nabro long - daily, all summer - SO * Short lifetime of troposphericstagnant anticyclone 2 & sulfate (<<1 week). SO 2 and/or sulfates OLR SO 2 and/or sulfates
 OSIRIS Optical Spectrograph and Infra. Red Imager System OSIRIS Aerosol: What it measures * Vertical profiles of light extinction * 1 km vertical grid * scattered sunlight off of molecules and particles * OSIRIS AOD: the Science paper’s cornerstone
 OSIRIS locations inside this Asian Monsoon box. One Day of OSIRIS Coverage: 13 June 2011
 Gray: 1 -12 June 2011 Tropopause On 17 July, ~5 weeks later. Here is a classic example of an On 13 June, all the aerosol profiles look like pre-Nabro: aerosol layer. i. e. background conditions.
 OSIRIS AOD Maps for selected 5 -day-averaging periods after 13 June 2011 Nabro Eruption From Bourassa et al. (2012)
 Fig. 4 The time series of Northern Hemisphere stratospheric aerosol optical depth during days after the volcanic eruptions that caused the four largest stratospheric perturbations as measured by OSIRIS since its launch in 2001. Compare d(AOD) dt and onset Published by AAAS OSIRIS Aerosol Optical Depth A E Bourassa et al. Science 2012; 337: 78 -81
 Four papers on two eruptions, showing discrepancies between OSIRIS aerosol and other observations or model output. 1. Kasatochi (Alaska), August 2008 2. Sarychev Peak (Kurile Islands), June 2009 The discrepancies are: 1. Low bias in OSIRIS stratospheric AOD (factors of 2 -10) 2. Delayed onset of AOD increase What follows: excerpts from one these papers.
") Sarychev Peak: Haywood et al. (2010)
Sarychev Peak: Haywood et al. (2010)
") Sarychev Peak: Haywood et al. (2010)
Sarychev Peak: Haywood et al. (2010)
 OSIRIS is considered the benchmark. From Conclusions:") Sarychev Peak: Haywood et al. (2010) OSIRIS is considered the benchmark. From Conclusions:
Sarychev Peak: Haywood et al. (2010) OSIRIS is considered the benchmark. From Conclusions:
 Is it correct? Let’s find out.
 Science Technical Comment MLS SO 2 100 h.") Analysis from Fromm et al. (2013) Science Technical Comment MLS SO 2 100 h. Pa AND Θ > 380 K 14 -19 June 2011 MLS SO 2 on 18 June, 00 UTC. These are far from other 18 June observations. And kind of close to the volcano. What’s up with that? !? Is it from Nabro? (yes) Is it from 13 June eruption? (no)
Analysis from Fromm et al. (2013) Science Technical Comment MLS SO 2 100 h. Pa AND Θ > 380 K 14 -19 June 2011 MLS SO 2 on 18 June, 00 UTC. These are far from other 18 June observations. And kind of close to the volcano. What’s up with that? !? Is it from Nabro? (yes) Is it from 13 June eruption? (no)
 Trajectories launched from MLS SO 2 feature. z 16. 5 17. 5 18. 5 p 104 88 74 Θ 384 405 430 Path passes near Nabro… …on 16 June! On 13 June it is far from volcano. 13 16
 Meteosat thermal IR brightness temperature minimum and altitude inferred using nearest radiosonde profiles. Figure 1, Fromm et al. , 2014
 Micropulse lidar, Sde Boker, Israel, the day after Nabro 14 June 2011 Correcting the record of volcanic stratospheric aerosol impact: Nabro and Sarychev Peak Tropopause Nabro aerosols were in the stratosphere right away, and far from the Monsoon. Journal of Geophysical Research: Atmospheres 3 SEP 2014 DOI: 10. 1002/2014 JD 021507 http: //onlinelibrary. wiley. com/doi/10. 1002/2014 JD 021507/full#jgrd 51618 -fig-0008
 Volcanism IASI Ash 2 Advisory. Bulletin: estimates cited") From Smithsonian’s Global. SO Height (km) Volcanism IASI Ash 2 Advisory. Bulletin: estimates cited [herein] The initial Toulouse Volcanic Center 14 June 2011, 0740 UTC were made in the time-limited operational setting that identifies volcanic ash for aviation safety. Those altitude estimates, which included maximum plume heights on 13 June 2011 in the range of 9. 1 -13. 7 km altitude, have since been reassessed using an array of satellite and ground-based instruments and processing strategies. The revised heights in the subsequent papers often determined plume altitudes above the 16 -18 km tropopause and into the stratosphere. Absent in our earlier report but well documented in the papers was evidence of a 16 June 2011 eruptive pulse. http: //www. volcano. si. edu/volcano. cfm? vn=221101 20 16 12 8 4 0
From Smithsonian’s Global. SO Height (km) Volcanism IASI Ash 2 Advisory. Bulletin: estimates cited [herein] The initial Toulouse Volcanic Center 14 June 2011, 0740 UTC were made in the time-limited operational setting that identifies volcanic ash for aviation safety. Those altitude estimates, which included maximum plume heights on 13 June 2011 in the range of 9. 1 -13. 7 km altitude, have since been reassessed using an array of satellite and ground-based instruments and processing strategies. The revised heights in the subsequent papers often determined plume altitudes above the 16 -18 km tropopause and into the stratosphere. Absent in our earlier report but well documented in the papers was evidence of a 16 June 2011 eruptive pulse. http: //www. volcano. si. edu/volcano. cfm? vn=221101 20 16 12 8 4 0
 Back to OSIRIS Back to 17 July…in addition to the layer feature, notice something else. * many of the profiles terminate far above the tropopause
 SAGE II Profile Zmin Time Series…full mission Mt. Pinatubo eruption Journal of Geophysical Research: Atmospheres 3 SEP 2014 DOI: 10. 1002/2014 JD 021507 http: //onlinelibrary. wiley. com/doi/10. 1002/2014 JD 021507/full#jgrd 51618 -fig-0011
 What is below the OSIRIS High Zmin? We look for coincidences: Eruption + 5 weeks, over Hawaii Tropopause 21 July 2011
 21 July 2011 Journal of Geophysical Research: Atmospheres 3 SEP 2014 DOI: 10. 1002/2014 JD 021507 http: //onlinelibrary. wiley. com/doi/10. 1002/2014 JD 021507/full#jgrd 51618 -fig-0017
 21 July 2011 OSIRIS Hawaii High Zmin NOAA Lidar CALIPSO OSIRIS all-time maximum Journal of Geophysical Research: Atmospheres 3 SEP 2014 DOI: 10. 1002/2014 JD 021507 http: //onlinelibrary. wiley. com/doi/10. 1002/2014 JD 021507/full#jgrd 51618 -fig-0016
 2011 (Nabro)") OSIRIS Zmin in terms of Potential Temperature 20 -45˚N 2007 (no volcano) 2011 (Nabro) Tropopause Θ 45 -60˚N Θ = 380 K “Overworld” Journal of Geophysical Research: Atmospheres 3 SEP 2014 DOI: 10. 1002/2014 JD 021507 http: //onlinelibrary. wiley. com/doi/10. 1002/2014 JD 021507/full#jgrd 51618 -fig-0013
OSIRIS Zmin in terms of Potential Temperature 20 -45˚N 2007 (no volcano) 2011 (Nabro) Tropopause Θ 45 -60˚N Θ = 380 K “Overworld” Journal of Geophysical Research: Atmospheres 3 SEP 2014 DOI: 10. 1002/2014 JD 021507 http: //onlinelibrary. wiley. com/doi/10. 1002/2014 JD 021507/full#jgrd 51618 -fig-0013
 2009 (Sarychev Peak) 20") OSIRIS Zmin in terms of Potential Temperature 2007 (no volcano) 2009 (Sarychev Peak) 20 -45˚N 45 -60˚N Journal of Geophysical Research: Atmospheres 3 SEP 2014 DOI: 10. 1002/2014 JD 021507 http: //onlinelibrary. wiley. com/doi/10. 1002/2014 JD 021507/full#jgrd 51618 -fig-0014
OSIRIS Zmin in terms of Potential Temperature 2007 (no volcano) 2009 (Sarychev Peak) 20 -45˚N 45 -60˚N Journal of Geophysical Research: Atmospheres 3 SEP 2014 DOI: 10. 1002/2014 JD 021507 http: //onlinelibrary. wiley. com/doi/10. 1002/2014 JD 021507/full#jgrd 51618 -fig-0014
 then add. 02") Remedy for the High Zmin: Proxy AOD supplement If (High Zmin) then add. 02 to AOD Journal of Geophysical Research: Atmospheres 3 SEP 2014 DOI: 10. 1002/2014 JD 021507 http: //onlinelibrary. wiley. com/doi/10. 1002/2014 JD 021507/full#jgrd 51618 -fig-0019
Remedy for the High Zmin: Proxy AOD supplement If (High Zmin) then add. 02 to AOD Journal of Geophysical Research: Atmospheres 3 SEP 2014 DOI: 10. 1002/2014 JD 021507 http: //onlinelibrary. wiley. com/doi/10. 1002/2014 JD 021507/full#jgrd 51618 -fig-0019
 Conclusions: * Point-source, episodic UTLS pathways are notoriously difficult to characterize - “between the cracks” w. r. t. space-based remote sensing - problem: imputing a geophysical process to an under-sampling issue * Nabro’s June 2011 eruption involved “Classic” direct stratospheric injection. * injection altitudes between 16 -19 km. * Nabro stratospheric aerosols were in abundance without delay. * No Asian Monsoon role in the stratospheric aerosol injection. * OSIRIS stratospheric aerosol data are biased. * systematic under-sampling of the full stratospheric column * additional biasing in presence of plumes with extinction > 0. 0025/km * A High-Zmin AOD proxy strategically brings OSIRIS into greater agreement with other data. * Papers on Kasatochi, Sarychev Peak invoking OSIRIS can be re-assessed. * NASA GISS AOD record has substantial contribution since 2002 from OSIRIS. * Caution called for.
 …from the sulfate aerosol “textbook”…
 …and the SO 2 “textbook. ” From the abstract… Tropospheric SO 2 lifetime is between ½ and 3 days.
") Kasatochi: Kravitz et al. (2010)
Kasatochi: Kravitz et al. (2010)
 OSIRIS Maximum Extinction Coefficient Correcting the record of volcanic stratospheric aerosol impact: Nabro and Sarychev Peak All-time OSIRIS Maximum Extinction Coefficient: 0. 0025/km 750 nm Extinction Coefficient (km-1) Journal of Geophysical Research: Atmospheres 3 SEP 2014 DOI: 10. 1002/2014 JD 021507 http: //onlinelibrary. wiley. com/doi/10. 1002/2014 JD 021507/full#jgrd 51618 -fig-0015
 Aerosol Optical Depth - time series Model OSIRIS") Sarychev Peak: Kravitz et al. (2011) Aerosol Optical Depth - time series Model OSIRIS
Sarychev Peak: Kravitz et al. (2011) Aerosol Optical Depth - time series Model OSIRIS
") Sarychev Peak: O’Neill et al. (2012)
Sarychev Peak: O’Neill et al. (2012)
") Sarychev Peak: O’Neill et al. (2012)
Sarychev Peak: O’Neill et al. (2012)
 from Conclusions") Sarychev Peak: O’Neill et al. (2012) from Conclusions
Sarychev Peak: O’Neill et al. (2012) from Conclusions
 Fig. 2 Altitude profiles of the zonal average aerosol extinction ratio, over all longitudes, for 12 -day time periods from June through September 2011, showing the progression of the stratospheric aerosol enhancement from the Nabro eruption on 13 June. A E Bourassa et al. Science 2012; 337: 78 -81 Published by AAAS
 OSIRIS profile Zmin Histogram, full data set thru 2012. Correcting the record of volcanic stratospheric aerosol impact: Nabro and Sarychev Peak Journal of Geophysical Research: Atmospheres 3 SEP 2014 DOI: 10. 1002/2014 JD 021507 http: //onlinelibrary. wiley. com/doi/10. 1002/2014 JD 021507/full#jgrd 51618 -fig-0012
 from Conclusions: OSIRIS was assumed to be the") Sarychev Peak: Kravitz et al. (2011) from Conclusions: OSIRIS was assumed to be the benchmark (e. g. ):
Sarychev Peak: Kravitz et al. (2011) from Conclusions: OSIRIS was assumed to be the benchmark (e. g. ):