
CORPORATE FINANCE Part I. FINANCIAL ANALYSIS AND


corporate_finance_part_i_2013-2014.ppt
- Размер: 3.7 Mегабайта
- Количество слайдов: 115
Описание презентации CORPORATE FINANCE Part I. FINANCIAL ANALYSIS AND по слайдам
CORPORATE FINANCE Part I. FINANCIAL ANALYSIS AND FORECASTING Gogolukhina Maria, Ph.
INTRODUCTION
FINANCIAL MODEL OF A COMPANY
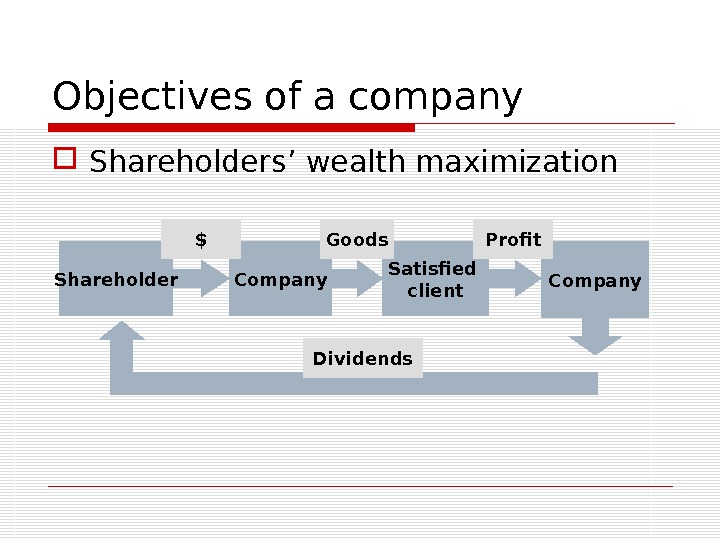
Objectives of a company Shareholders’ wealth maximization Shareholder Company Satisfied client. Goods$ Company. Profit Dividends
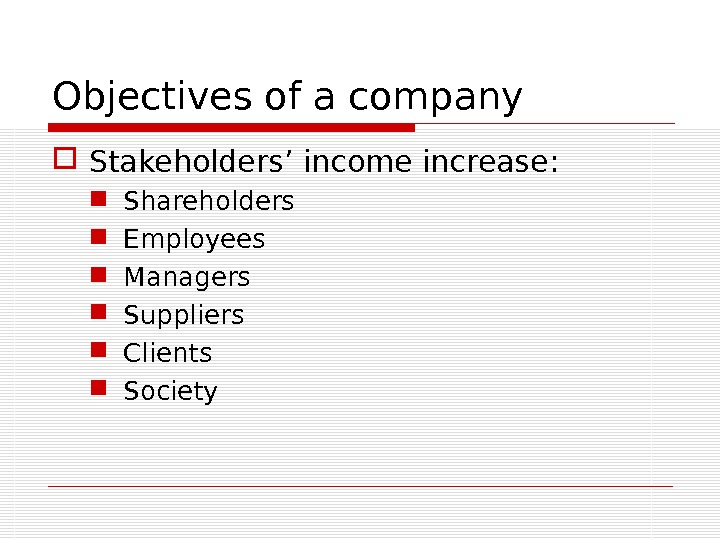
Objectives of a company Stakeholders’ income increase: Shareholders Employees Managers Suppliers Clients Society
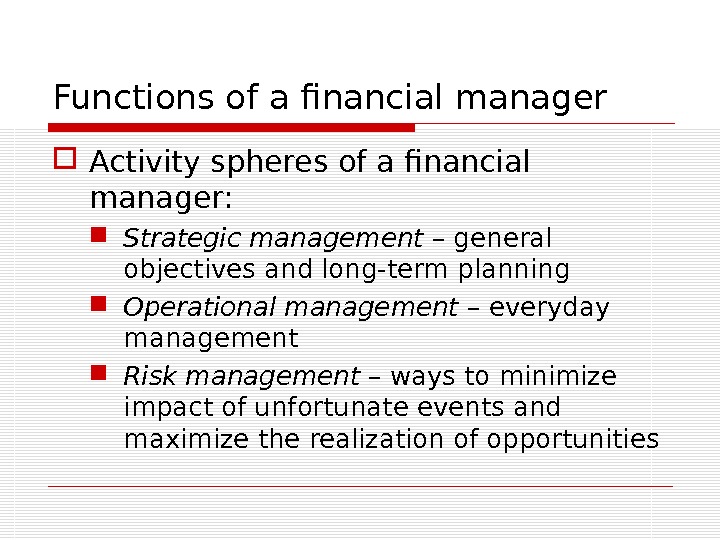
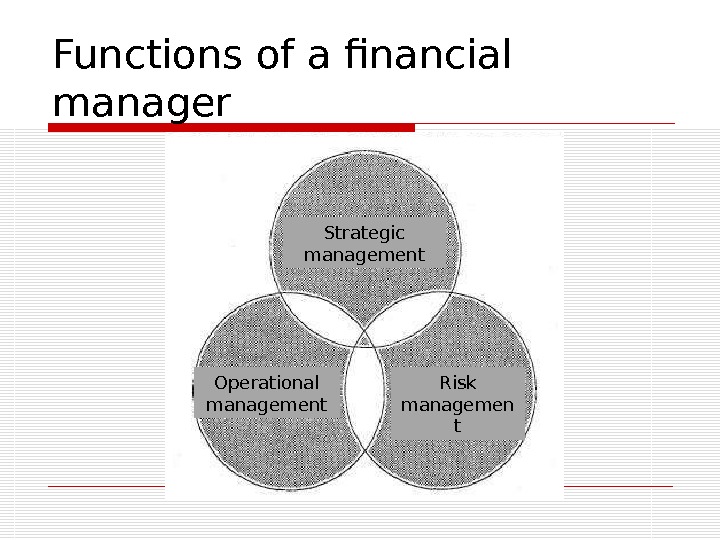
Functions of a financial manager Activity spheres of a financial manager: Strategic management – general objectives and long-term planning Operational management – everyday management Risk management – ways to minimize impact of unfortunate events and maximize the realization of opportunities
Functions of a financial manager Strategic management Operational management Risk managemen t
Functions of a financial manager Key objectives of a financial manager Financial planning Assessment of investment projects Decisions on financing Operations on capital markets Financial control
Financial structure of the company Financial structure is a hierarchical system of financial responsibility centres (FRC) which define the order of financial results forming and responsibility distribution to achieve one common objective of a company.
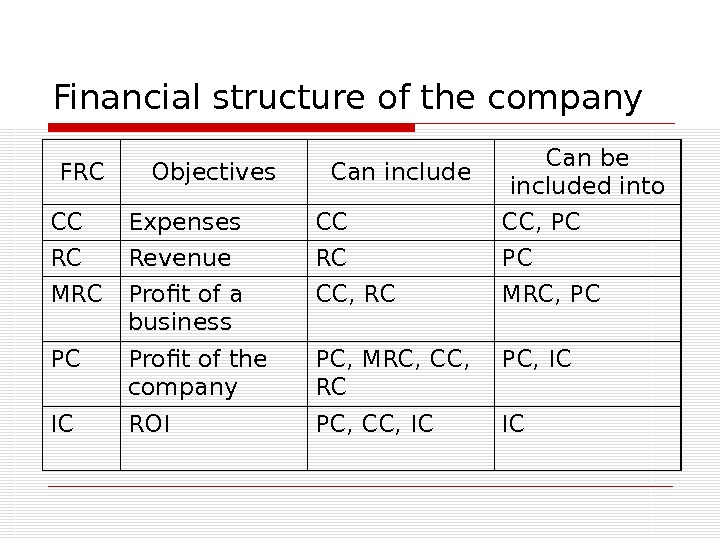
Financial structure of the company Financial responsibility centers (FRC): Cost center (CC) Revenue center (RC) Marginal revenue center (MRC) Profit center (PC) Investment center (IC)
Financial structure of the company FRC Objectives Can include Can be included into CC Expenses CC CC, PC RC Revenue RC PC MRC Profit of a business CC, RC MRC, PC PC Profit of the company PC, MRC, CC, RC PC, IC IC ROI PC, CC , IC I
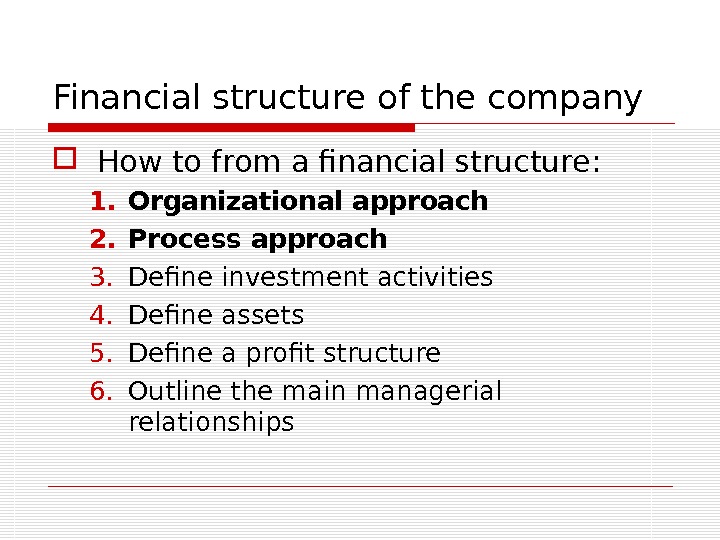
Financial structure of the company How to from a financial structure: 1. Organizational approach 2. Process approach 3. Define investment activities 4. Define assets 5. Define a profit structure 6. Outline the main managerial relationships
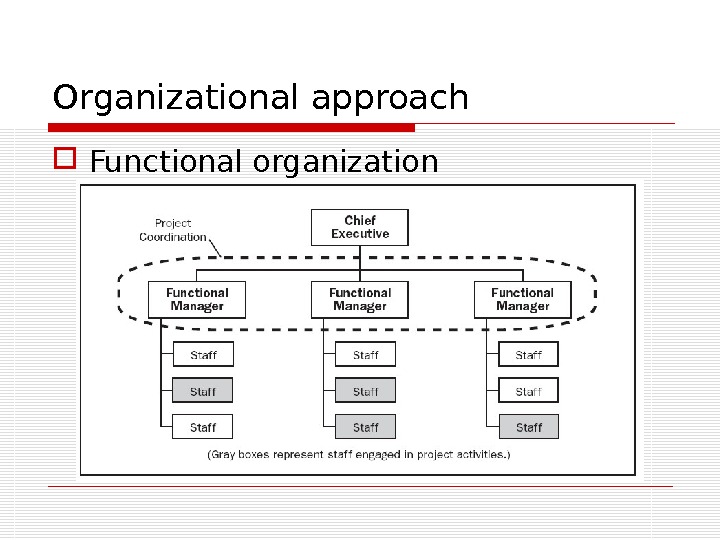
Organizational approach An organizational structure is a mainly hierarchical concept of subordination of entities that collaborate and contribute to serve one common aim. (Wikipedia)
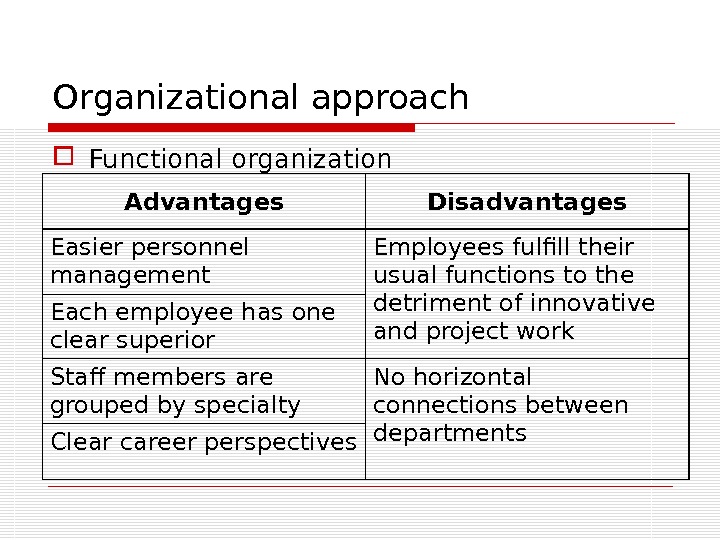
Organizational approach Functional organization
Organizational approach Functional organization Advantages Disadvantages Easier personnel management Employees fulfill their usual functions to the detriment of innovative and project work. Each employee has one clear superior Staff members are grouped by specialty No horizontal connections between departments Clear career perspectives
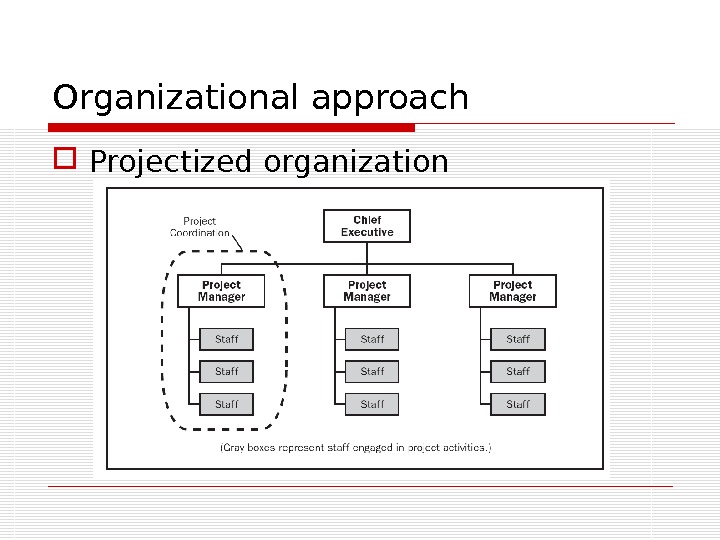
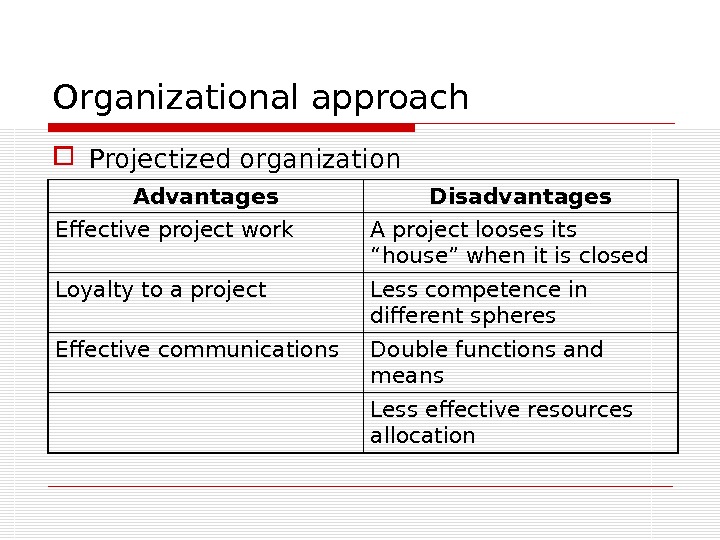
Organizational approach Projectized organization
Organizational approach Projectized organization Advantages Disadvantages Effective project work A project looses its “house” when it is closed Loyalty to a project Less competence in different spheres Effective communications Double functions and means Less effective resources allocation
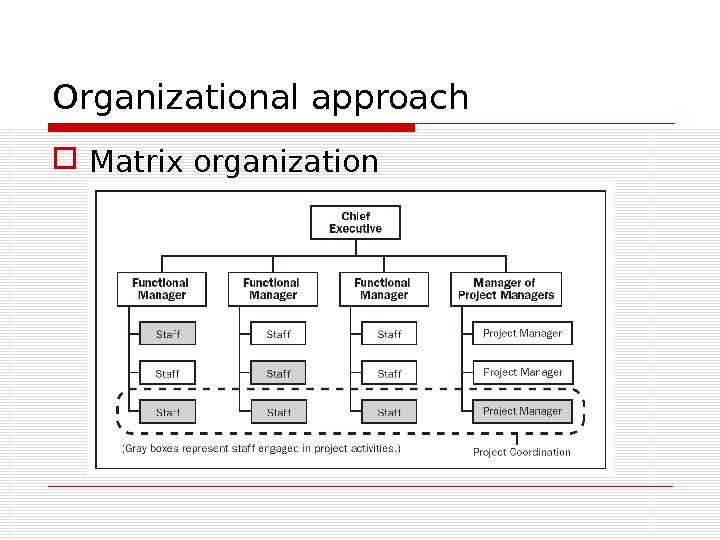
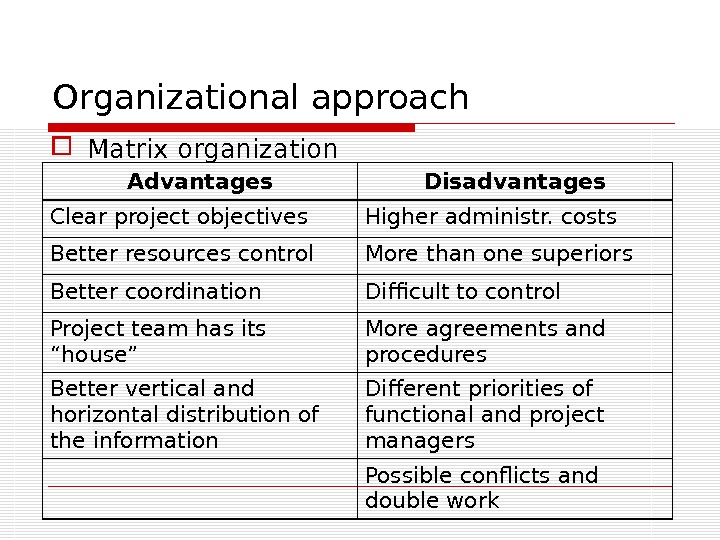
Organizational approach Matrix organization
Organizational approach Matrix organization Advantages Disadvantages Clear project objectives Higher administr. costs Better resources control More than one superiors Better coordination Difficult to control Project team has its “house” More agreements and procedures Better vertical and horizontal distribution of the information Different priorities of functional and project managers Possible conflicts and double work
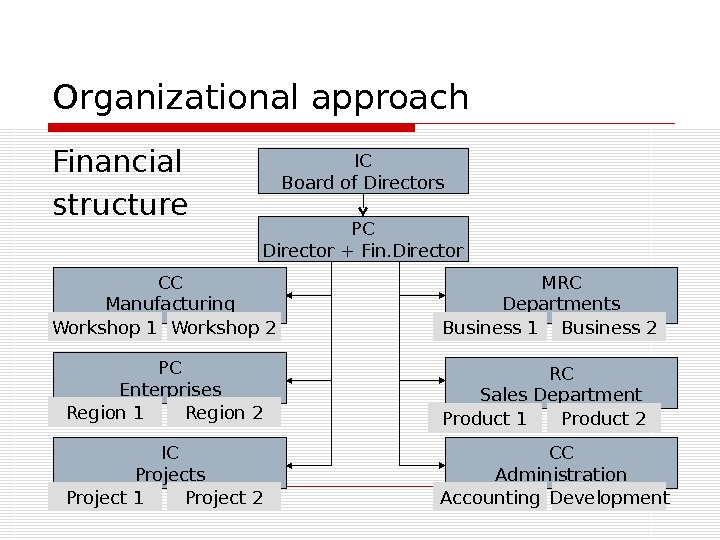
Organizational approach Financial structure PC Director + Fin. Director CC Manufacturing Workshop 1 Workshop 2 PC Enterprises Region 1 Region 2 MRC Departments Business 1 Business 2 RC Sales Department CC Administration Accounting Development. IC Projects Project 1 Project 2 Product 1 Product 2 IC Board of Directors
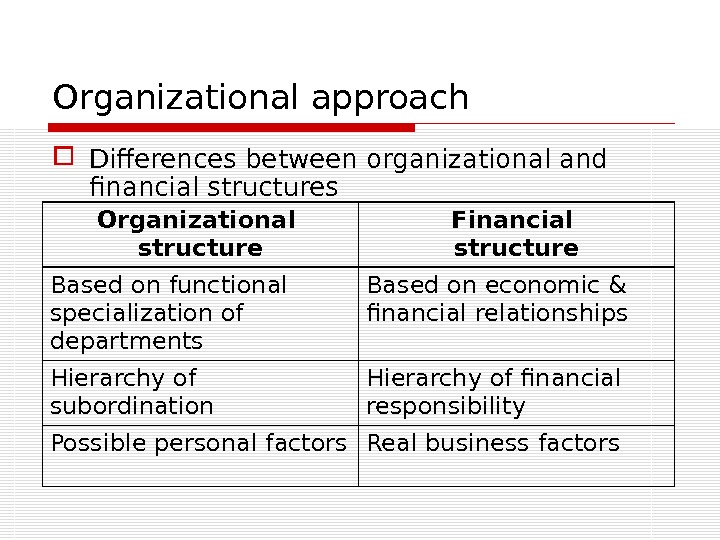
Organizational approach Differences between organizational and financial structures Organizational structure Financial structure Based on functional specialization of departments Based on economic & financial relationships Hierarchy of subordination Hierarchy of financial responsibility Possible personal factors Real business factors
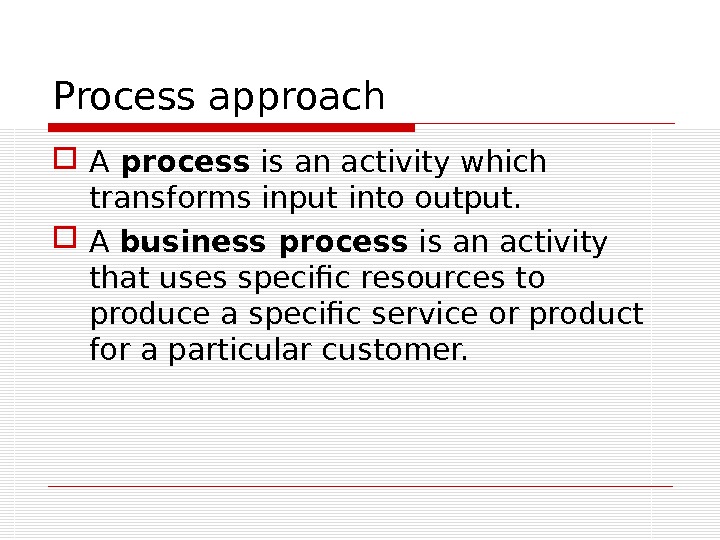
Process approach A process is an activity which transforms input into output. A business process is an activity that uses specific resources to produce a specific service or product for a particular customer.
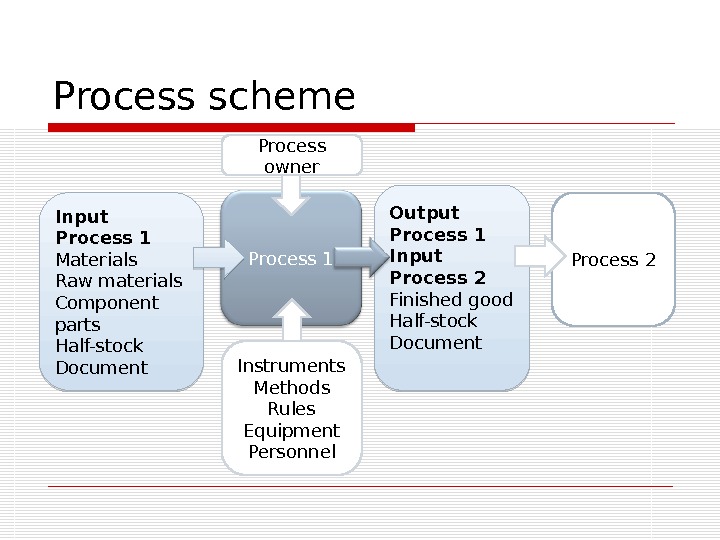
Process scheme Process 1 Process owner Instruments Methods Rules Equipment Personnel. Input Process 1 Materials Raw materials Component parts Half-stock Document Output Process 1 Input Process 2 Finished good Half-stock Document Process
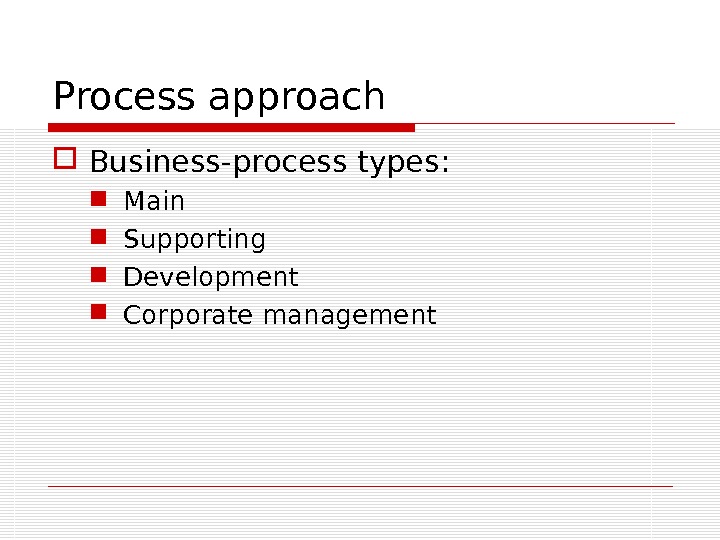
Process approach Business-process types: Main Supporting Development Corporate management
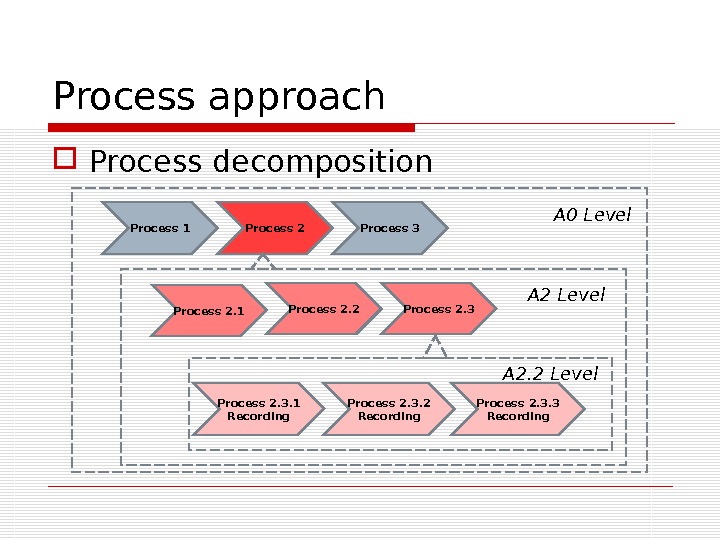
Process approach Process decomposition Process 1 Process 2 Process 3 Process 2. 1 Process 2. 2 Process 2. 3. 1 Recording Process 2. 3. 2 Recording Process 2. 3. 3 Recording A 0 Level A 2. 2 Level
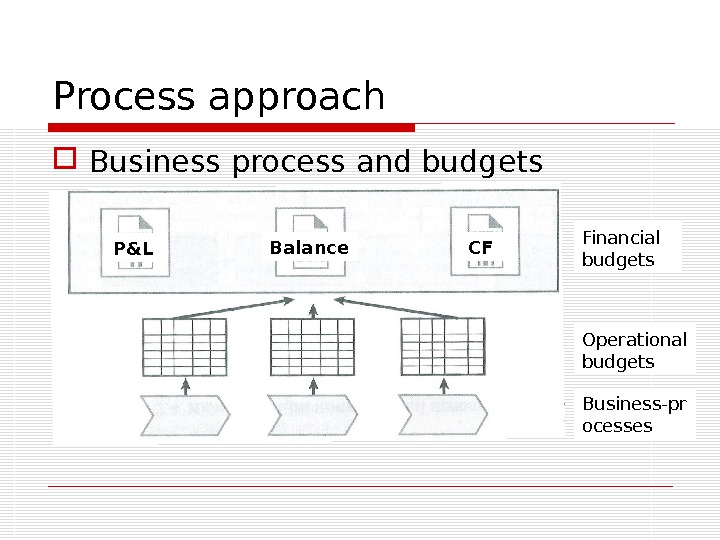
Process approach Business process and budgets P&L Balance CF Financial budgets Operational budgets Business-pr ocesses
BASIC PRINCIPLES OF FINANCIAL MANAGEMENT
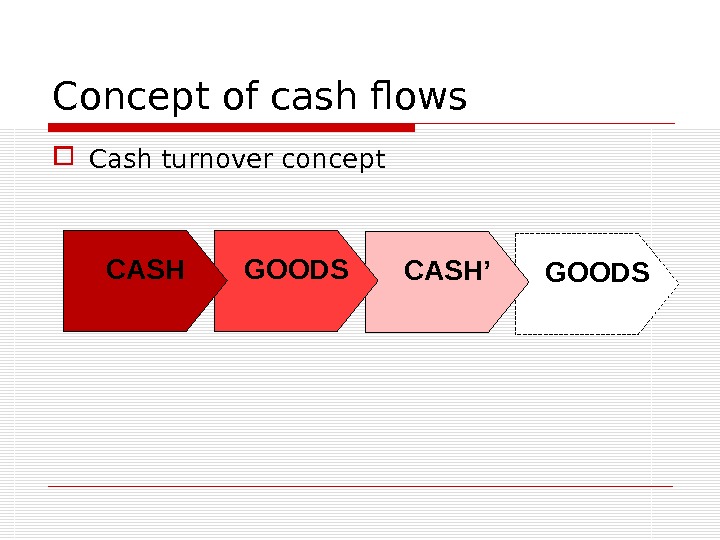
Concept of cash flows Cash turnover concept GOODSCASH’GOODSCASH
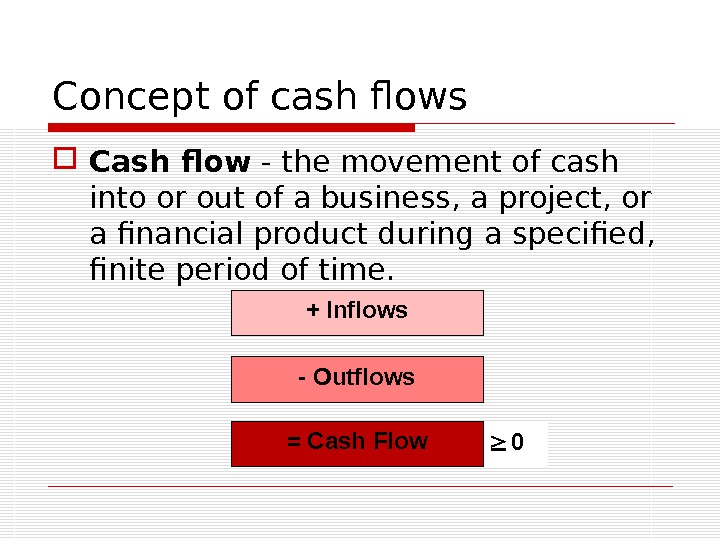
Concept of cash flows Cash flow — the movement of cash into or out of a business, a project, or a financial product during a specified, finite period of time. 0+ Inflows — Outflows = Cash Flow
Relationship between risk & profit Nothing ventured, nothing gained Britain’s Special Air Service motto: Who dares, wins The higher profits are usually connected with the higher risk
ACCOUNTING SYSTEMS
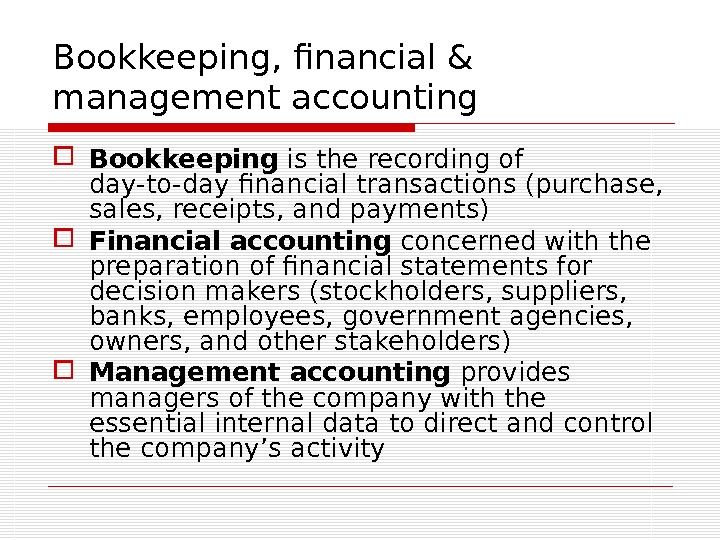
Bookkeeping, financial & management accounting Bookkeeping is the recording of day-to-day financial transactions (purchase, sales, receipts, and payments) Financial accounting concerned with the preparation of financial statements for decision makers (stockholders, suppliers, banks, employees, government agencies, owners, and other stakeholders) Management accounting provides managers of the company with the essential internal data to direct and control the company’s activity
Bookkeeping, financial & management accounting Bookkeeping Financial accounting Managemen t accounting Users Internal, external Internal Objectives Ongoing accounting of all company’s operations Accounting of finances movement Financial statements Internal analysis of production costs and benefits
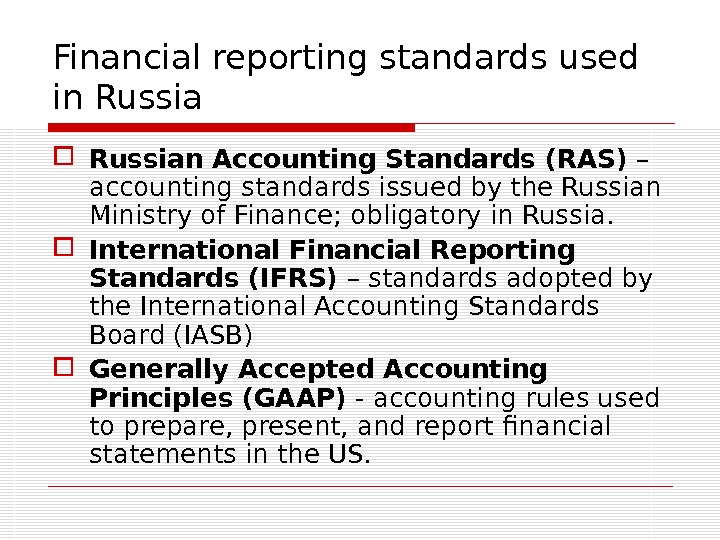
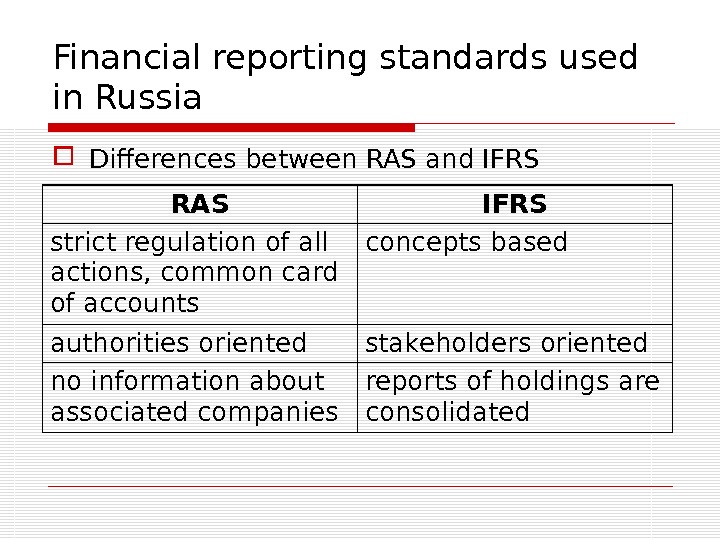
Financial reporting standards used in Russian Accounting Standards (RAS) – accounting standards issued by the Russian Ministry of Finance; obligatory in Russia. International Financial Reporting Standards (IFRS) – standards adopted by the International Accounting Standards Board (IASB) Generally Accepted Accounting Principles (GAAP) — accounting rules used to prepare, present, and report financial statements in the US.
Financial reporting standards used in Russia Differences between RAS and IFRS RAS IFRS strict regulation of all actions, common card of accounts concepts based authorities oriented stakeholders oriented no information about associated companies reports of holdings are consolidated
Financial reporting standards used in Russia Main concepts of the IFRS: accrual basis going concern individual evaluation concept conservatism matching substance over form
FINANCIAL STATEMENTS
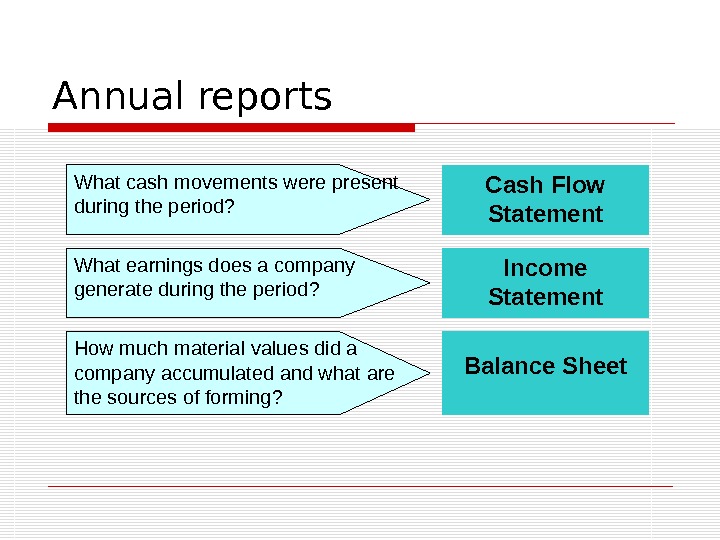
Annual reports What cash movements were present during the period? Cash Flow Statement What earnings does a company generate during the period? Income Statement How much material values did a company accumulated and what are the sources of forming? Balance Sheet
BALANCE SHEET
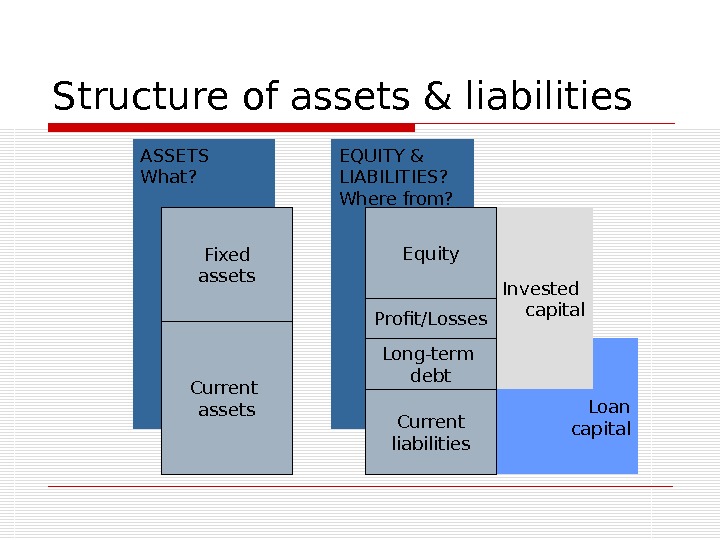
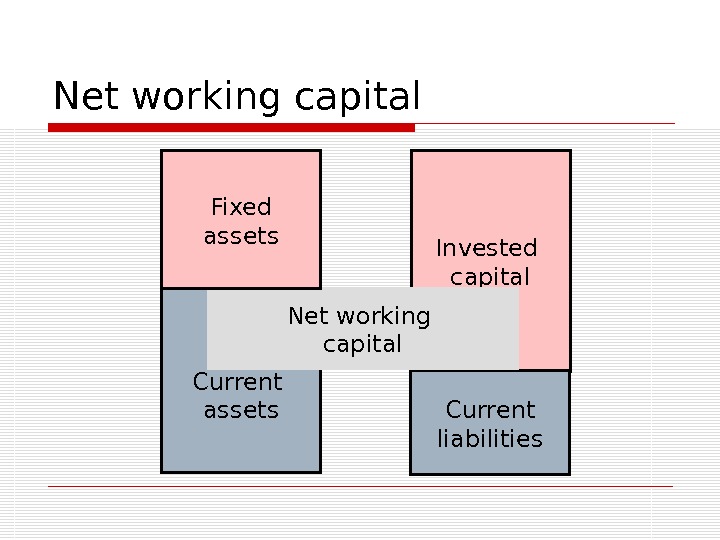
Loan capital. Invested capital. EQUITY & LIABILITIES? Where from? ASSETS What? Structure of assets & liabilities Fixed assets Current assets Equity Profit/Losses Long-term debt Current liabilities
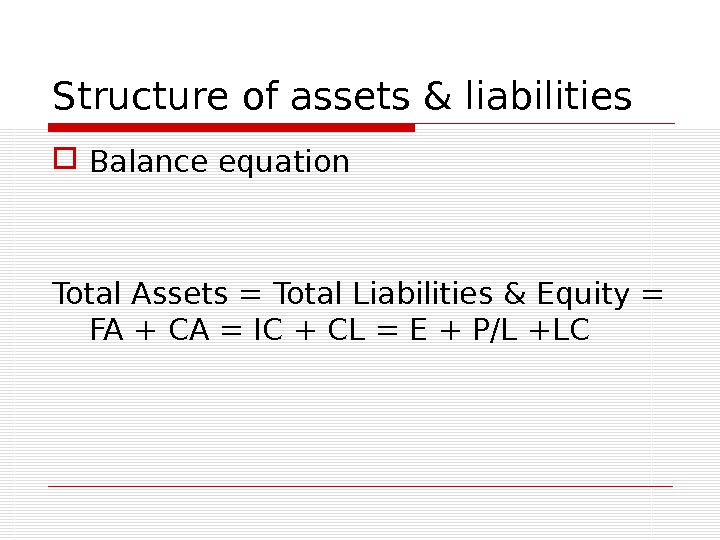
Structure of assets & liabilities Balance equation Total Assets = Total Liabilities & Equity = FA + CA = IC + CL = E + P/L +L
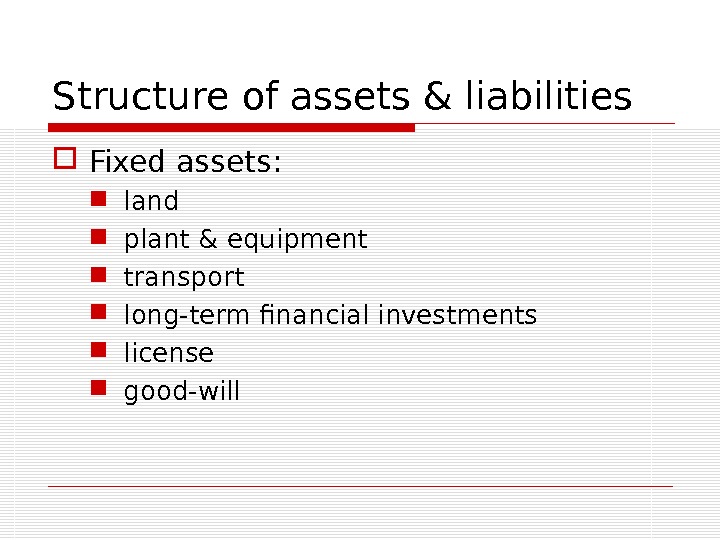
Structure of assets & liabilities Fixed assets: land plant & equipment transport long-term financial investments license good-will
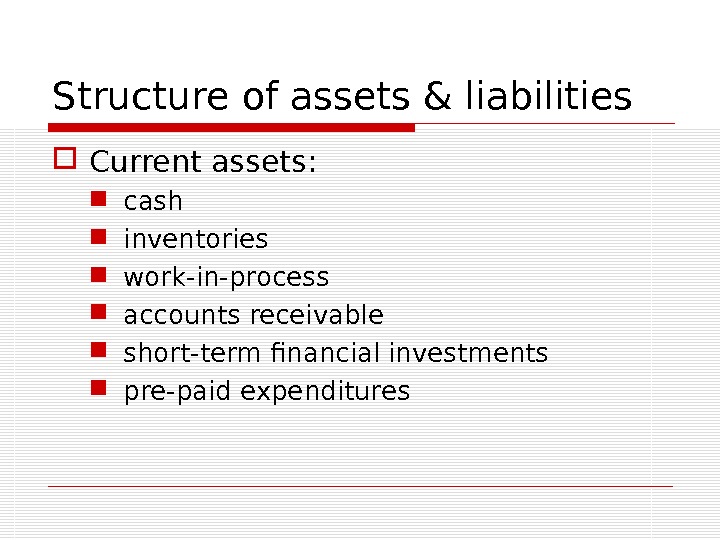
Structure of assets & liabilities Current assets: cash inventories work-in-process accounts receivable short-term financial investments pre-paid expenditures
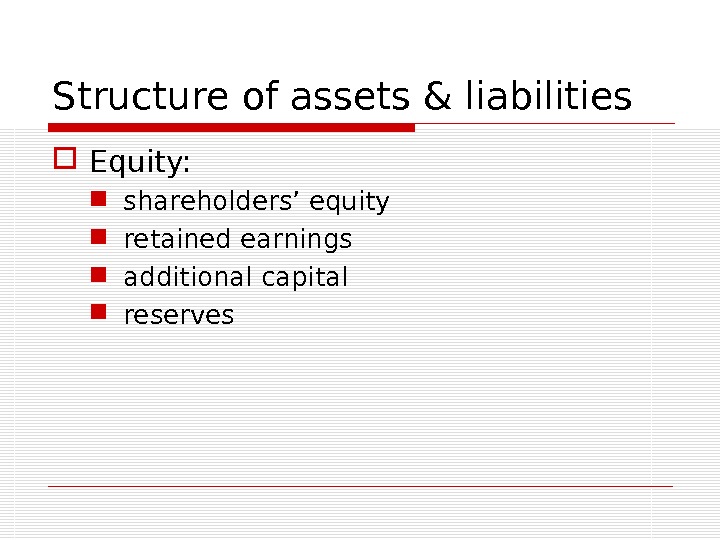
Structure of assets & liabilities Equity: shareholders’ equity retained earnings additional capital reserves
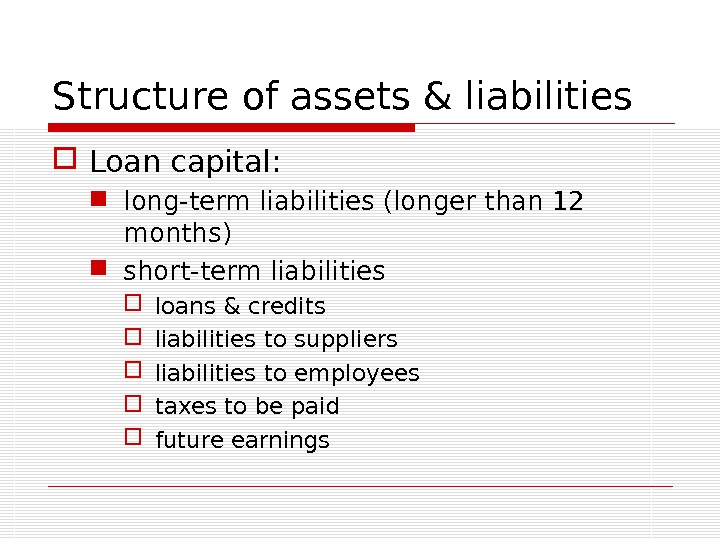
Structure of assets & liabilities Loan capital: long-term liabilities (longer than 12 months) short-term liabilities loans & credits liabilities to suppliers liabilities to employees taxes to be paid future earnings
Net working capital Invested capital Current assets Current liabilities. Net working capital. Fixed assets
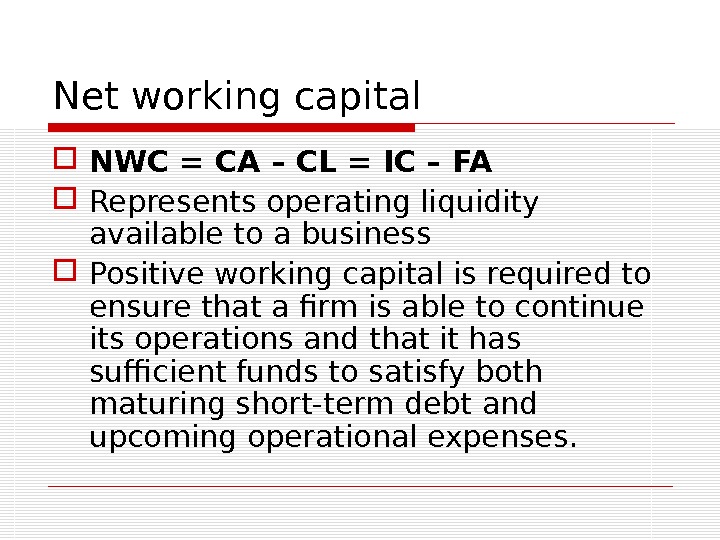
Net working capital NWC = CA – CL = IC – FA Represents operating liquidity available to a business Positive working capital is required to ensure that a firm is able to continue its operations and that it has sufficient funds to satisfy both maturing short-term debt and upcoming operational expenses.
INCOME STATEMENT
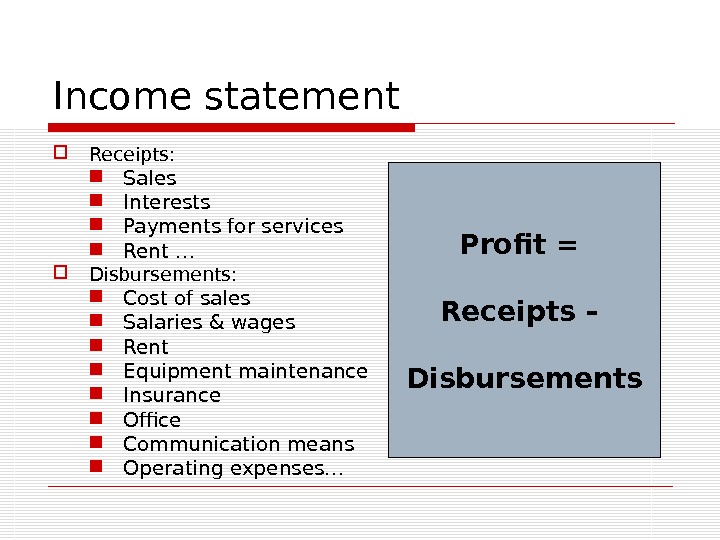
Income statement Receipts: Sales Interests Payments for services Rent … Disbursements: Cost of sales Salaries & wages Rent Equipment maintenance Insurance Office Communication means Operating expenses… Profit = Receipts – Disbursements
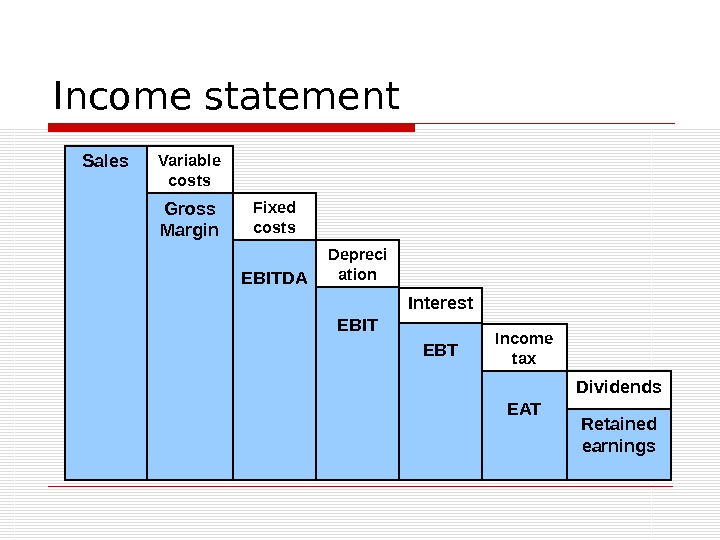
Income statement Variable costs Gross Margin EBITDA EBT Retained earnings. Income tax EATSales Dividends. Interest. Fixed costs Depreci ation EBIT
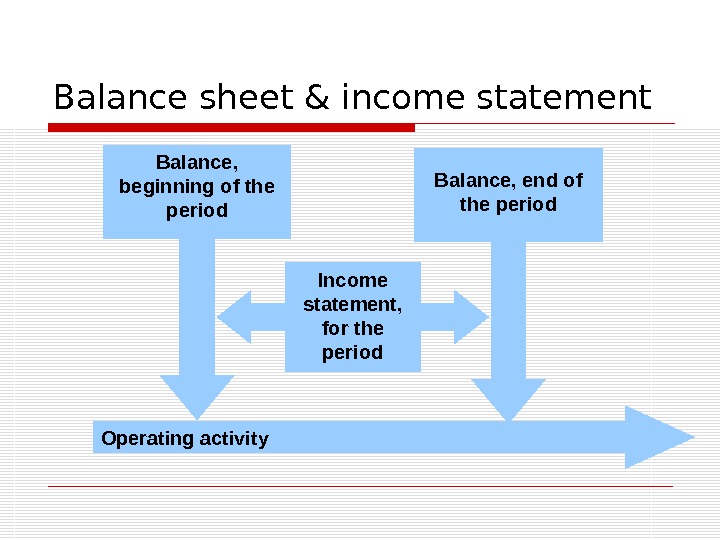
Balance sheet & income statement Operating activity Balance, end of the period Income statement, for the period. Balance, beginning of the period
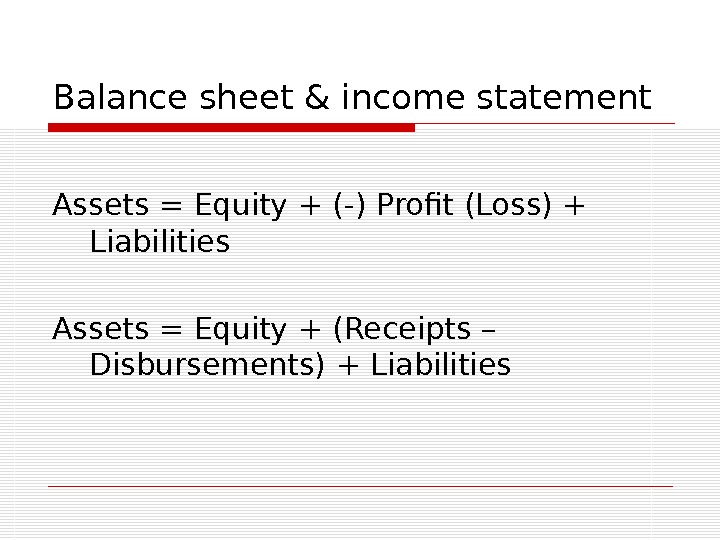
Balance sheet & income statement Assets = Equity + (-) Profit (Loss) + Liabilities Assets = Equity + (Receipts – Disbursements) + Liabilities
STATEMENT OF CASH FLOWS
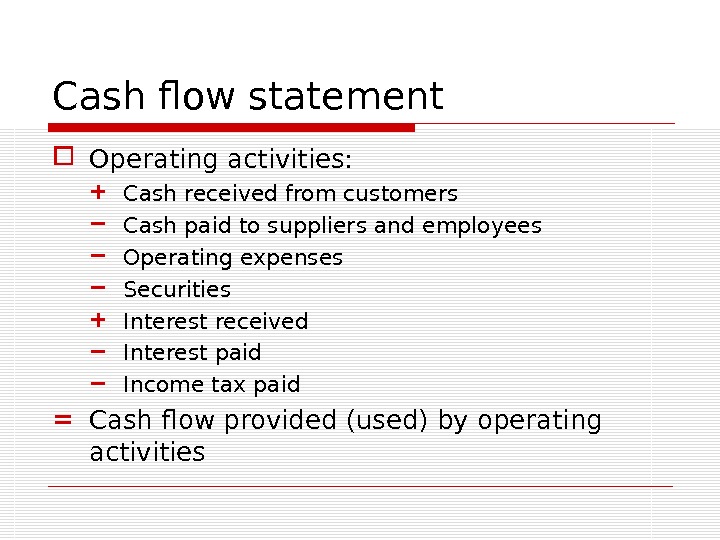
Cash flow statement Operating activities: + Cash received from customers − Cash paid to suppliers and employees − Operating expenses − Securities + Interest received − Interest paid − Income tax paid = Cash flow provided (used) by operating activities
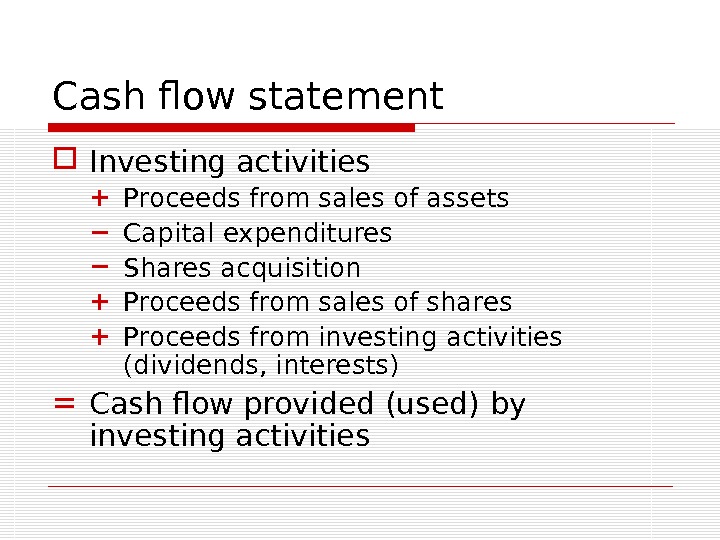
Cash flow statement Investing activities + Proceeds from sales of assets − Capital expenditures − Shares acquisition + Proceeds from sales of shares + Proceeds from investing activities (dividends, interests) = Cash flow provided (used) by investing activities
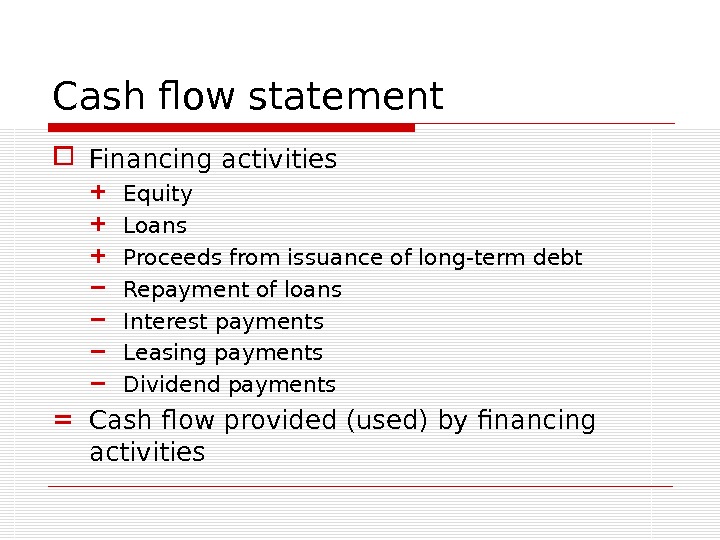
Cash flow statement Financing activities + Equity + Loans + Proceeds from issuance of long-term debt − Repayment of loans − Interest payments − Leasing payments − Dividend payments = Cash flow provided (used) by financing activities
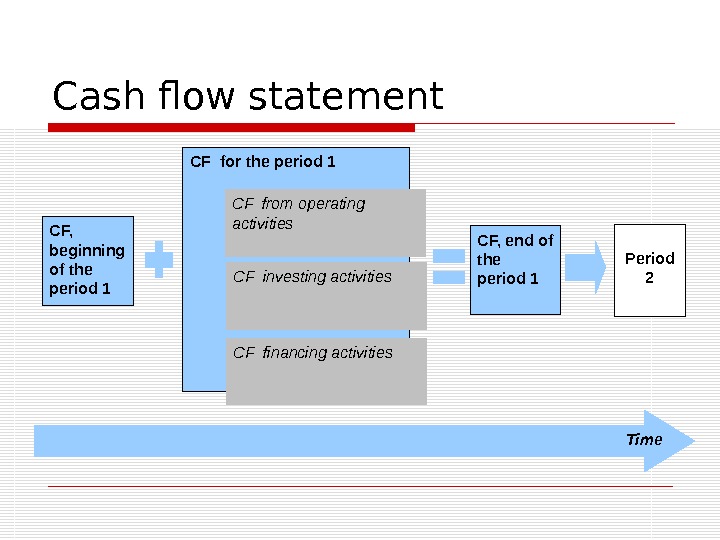
Cash flow statement СF for the period 1 СF, beginning of the period 1 СF from operating activities СF investing activities СF financing activities СF, end of the period 1 Period 2 Time
Cash flow statement Methods of representing cash flows from operating activities: Direct — all the inflows and outflows are calculated using accrual method Indirect — adjusting net income to reconcile it to net cash flow from operating activities
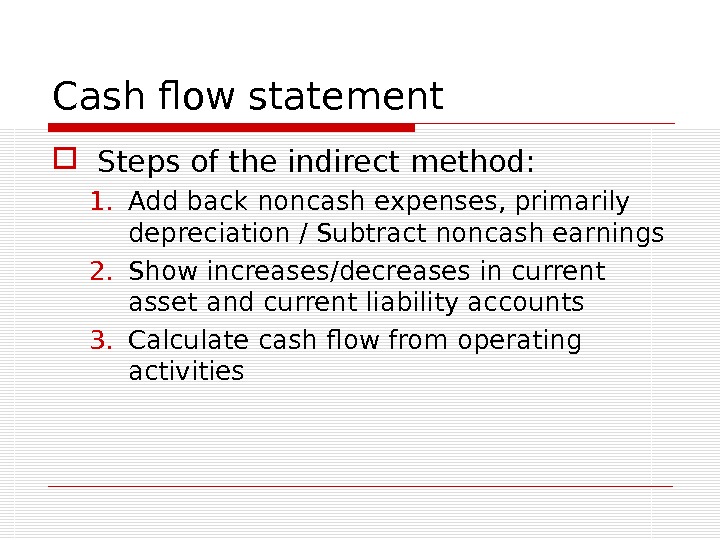
Cash flow statement Steps of the indirect method: 1. Add back noncash expenses, primarily depreciation / Subtract noncash earnings 2. Show increases/decreases in current asset and current liability accounts 3. Calculate cash flow from operating activities
Cash flow statement Signs for adjustments (indirect method) − Current assets − Current liabilities − Noncash earnings + Current assets + Current liabilities + Noncash expenses
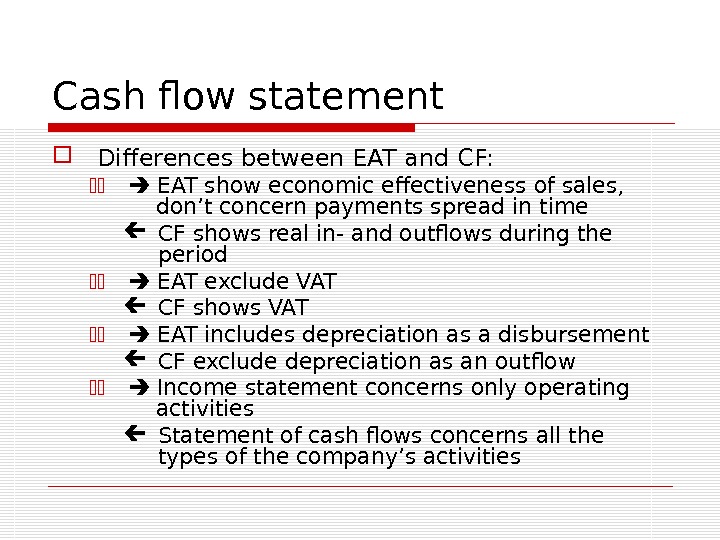
Cash flow statement Differences between EAT and CF: 11 EAT show economic effectiveness of sales, don’t concern payments spread in time CF shows real in- and outflows during the period 11 EAT exclude VAT CF shows VAT 11 EAT includes depreciation as a disbursement CF exclude depreciation as an outflow 11 Income statement concerns only operating activities Statement of cash flows concerns all the types of the company’s activities
FINANCIAL ANALYSIS
BASIC PRINCIPLES
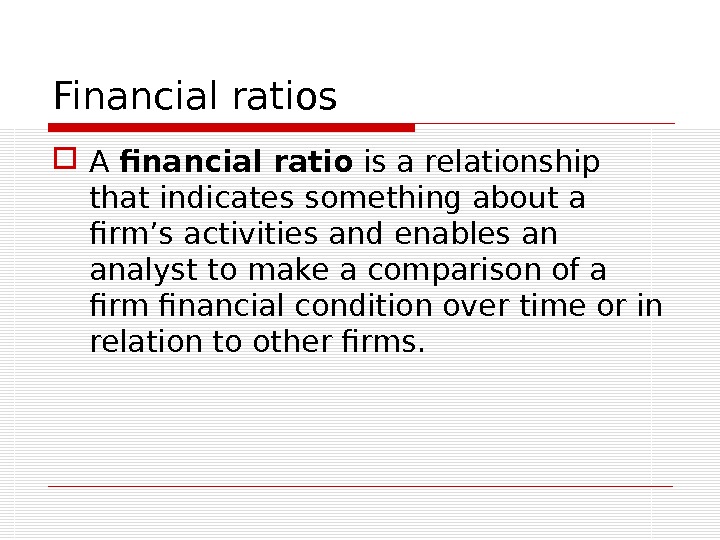
Financial ratios A financial ratio is a relationship that indicates something about a firm’s activities and enables an analyst to make a comparison of a firm financial condition over time or in relation to other firms.
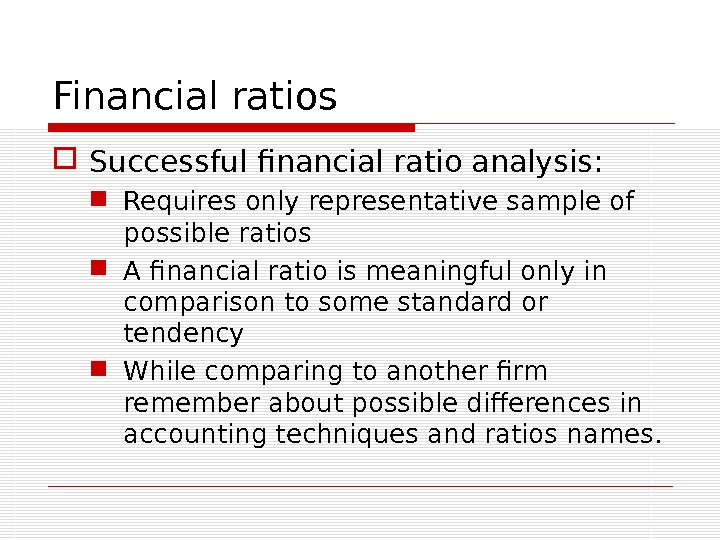
Financial ratios Successful financial ratio analysis: Requires only representative sample of possible ratios A financial ratio is meaningful only in comparison to some standard or tendency While comparing to another firm remember about possible differences in accounting techniques and ratios names.
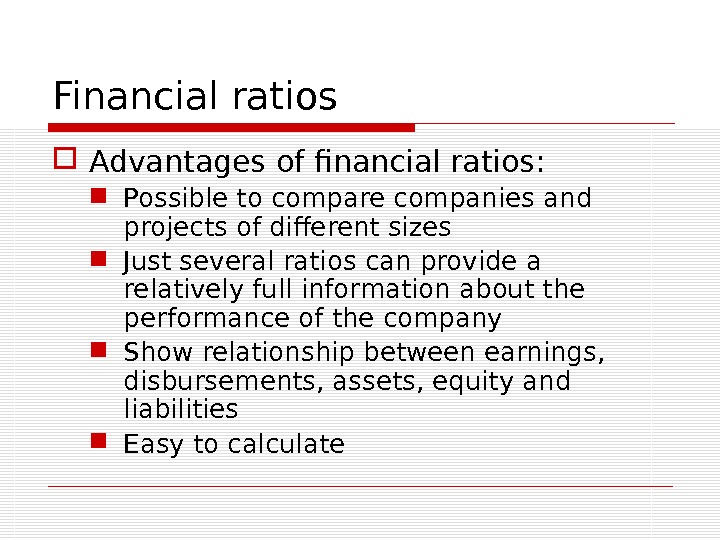
Financial ratios Advantages of financial ratios: Possible to compare companies and projects of different sizes Just several ratios can provide a relatively full information about the performance of the company Show relationship between earnings, disbursements, assets, equity and liabilities Easy to calculate
Financial ratios Disadvantages of financial ratios: Strongly depend on accuracy of reports Don’t analyze absolute values of sales, profit, used capital Difficult to find a standard or a base for comparison Ratios based on annual reports don’t show the company’s performance during the year Don’t consider sudden changes on the market or inflation
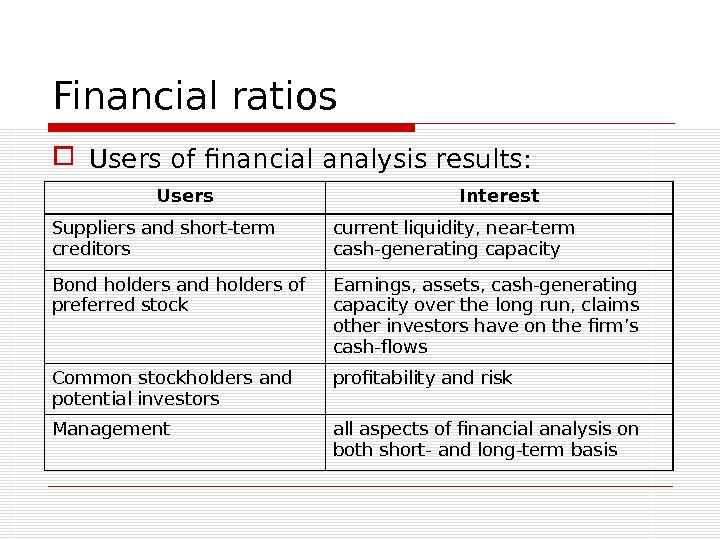
Financial ratios Users of financial analysis results: Users Interest Suppliers and short-term creditors current liquidity, near-term cash-generating capacity Bond holders and holders of preferred stock Earnings, assets, cash-generating capacity over the long run, claims other investors have on the firm’s cash-flows Common stockholders and potential investors profitability and risk Management all aspects of financial analysis on both short- and long-term basis
FIVE GROUPS OF FINANCIAL RAIOS
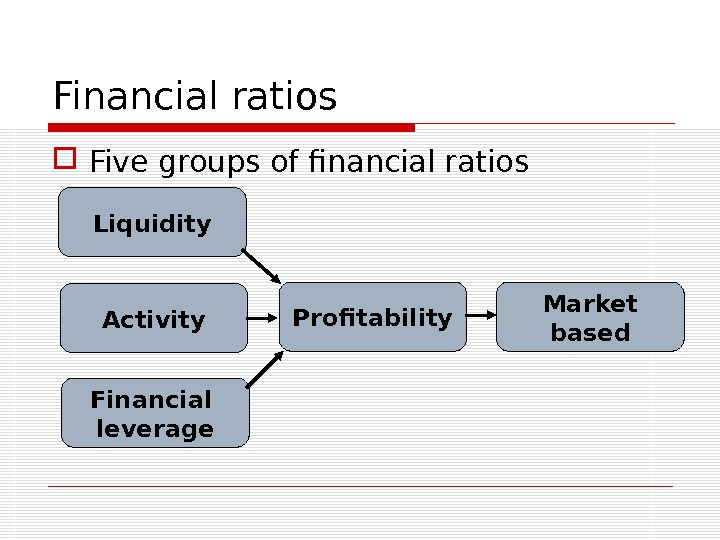
Financial ratios Five groups of financial ratios Profitability. Liquidity Activity Financial leverage Market based
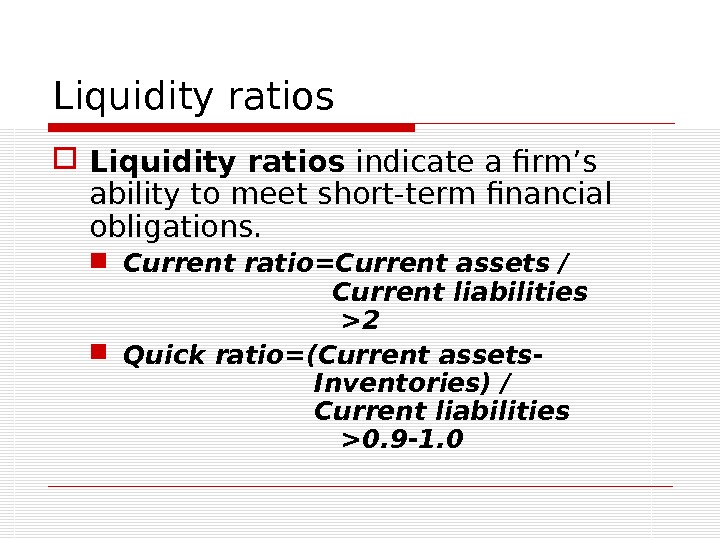
Liquidity ratios indicate a firm’s ability to meet short-term financial obligations. Current ratio=Current assets / Current liabilities >2 Quick ratio=(Current assets- Inventories) / Current liabilities >0. 9 -1.
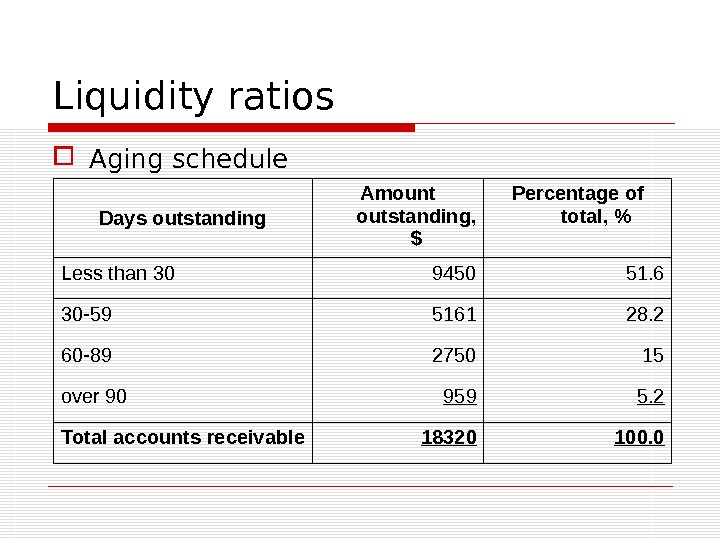
Liquidity ratios Aging schedule Days outstanding Amount outstanding, $ Percentage of total, % Less than 30 9450 51. 6 30 -59 5161 28. 2 60 -89 2750 15 over 90 959 5. 2 Total accounts receivable 18320 100.
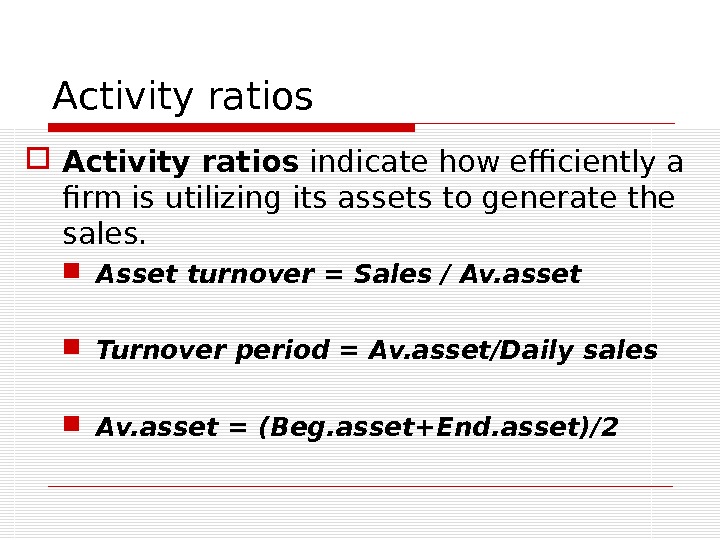
Activity ratios indicate how efficiently a firm is utilizing its assets to generate the sales. Asset turnover = Sales / Av. asset Turnover period = Av. asset/Daily sales Av. asset = (Beg. asset+End. asset)/
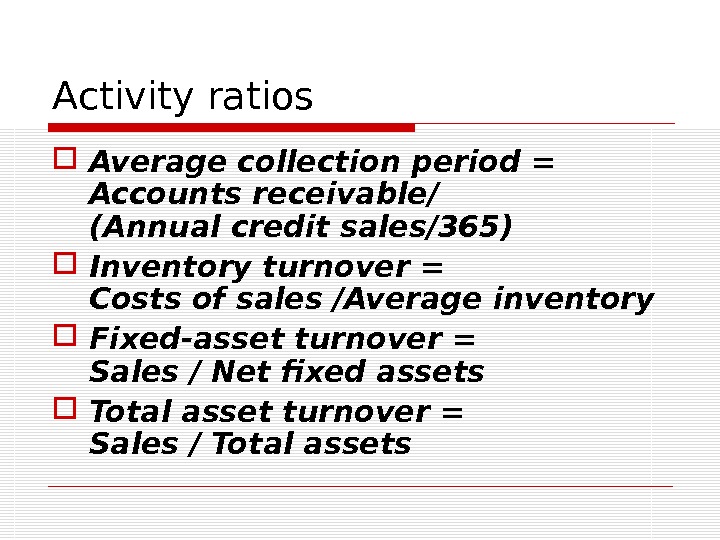
Activity ratios Average collection period = Accounts receivable/ (Annual credit sales/365) Inventory turnover = Costs of sales /Average inventory Fixed-asset turnover = Sales / Net fixed assets Total asset turnover = Sales / Total assets
Financial leverage ratios measure the degree to which a firm is financing its assets with fixed-charge sources of funds such as debt, preferred stock, or leases Debt ratio = Total debt/Total assets Debt-to-equity = Total debt / Total equity
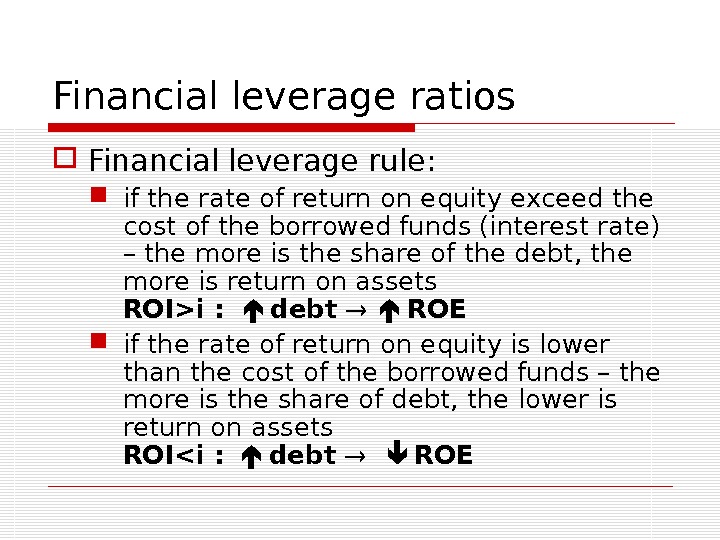
Financial leverage ratios Financial leverage rule: if the rate of return on equity exceed the cost of the borrowed funds (interest rate) – the more is the share of the debt, the more is return on assets ROI>i : debt ROE if the rate of return on equity is lower than the cost of the borrowed funds – the more is the share of debt, the lower is return on assets ROI<i : debt RO
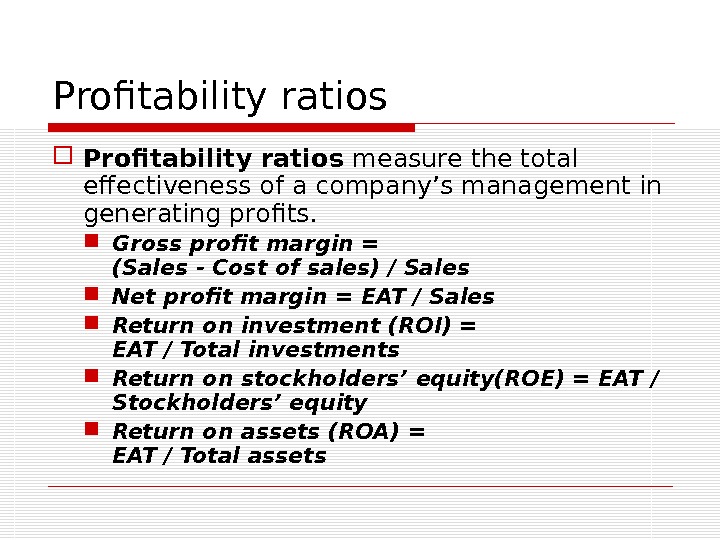
Profitability ratios measure the total effectiveness of a company’s management in generating profits. Gross profit margin = (Sales — Cost of sales) / Sales Net profit margin = EAT / Sales Return on investment (ROI) = EAT / Total investments Return on stockholders’ equity(ROE) = EAT / Stockholders’ equity Return on assets (ROA) = EAT / Total assets
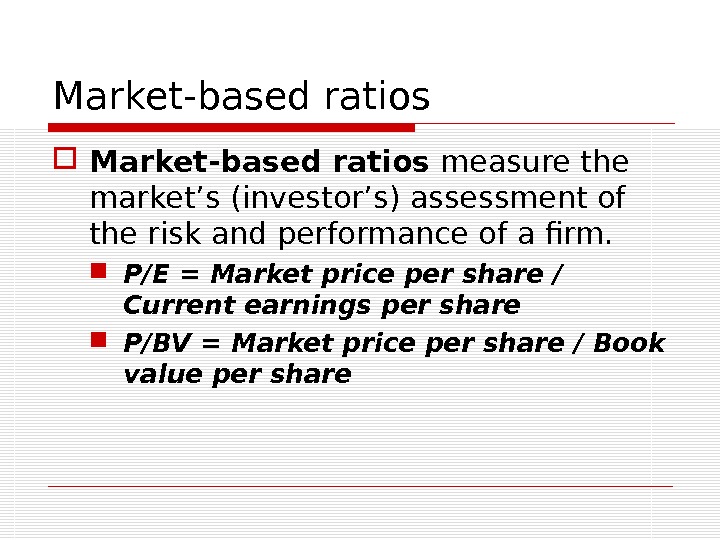
Market-based ratios measure the market’s (investor’s) assessment of the risk and performance of a firm. P/E = Market price per share / Current earnings per share P/BV = Market price per share / Book value per share
SOME METHODS OF FINANCIAL ANALYSIS
Methods of financial analysis Vertical analysis – structure analysis of a company’s statements Horizontal analysis – comparison of a company’s statements through several periods Trend analysis – comparison of a company’s results to a basic period or industry standards Du. Pont chart – profitability analysis Factor analysis – assessment of the most important factors influencing ROE Z-analysis – forecasting probability of bankruptcy
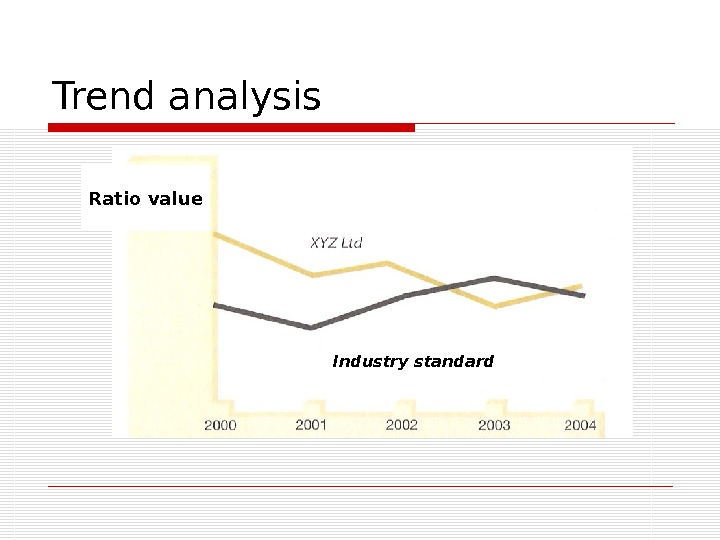
Trend analysis Steps of the trend analysis: 1. Choose a ratio 2. Choose a basic period / find industry standards 3. Find information on the previous periods 4. Draw a trend for the previous periods 5. Analyze the trend comparing to the basic period or industry standard 6. Make forecast for the future periods and draw the results at the trend
Trend analysis Ratio value Industry standard
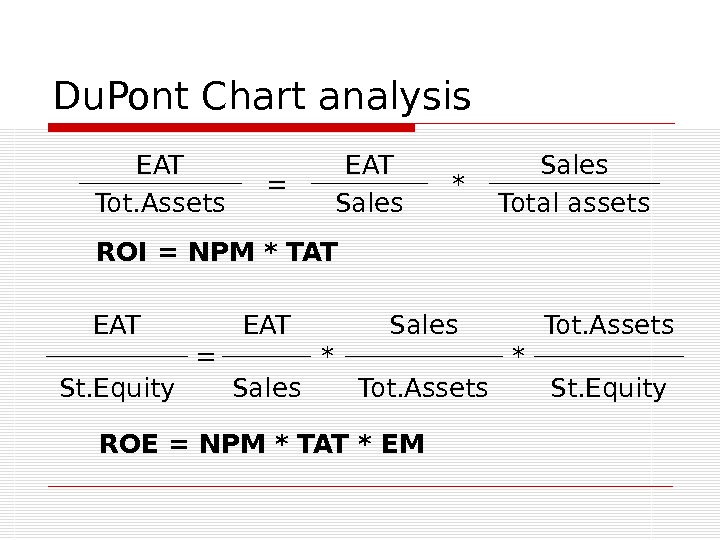
Du. Pont Chart analysis EAT = EAT * Sales Tot. Assets Sales Total assets ROI = NPM * TAT EAT = EAT * Sales * Tot. Assets St. Equity Sales Tot. Assets St. Equity ROE = NPM * TAT * EM
Du. Pont Chart analysis Net profit margin 4, 45% Total Asset Turnover 1, 377 Earnings after taxes $5, 016 Sales $112, 760 Total assets $81, 890 Sales $112, 760 Total Expenses Cost of sales $85, 300 Operating expenses $15, 940 Interest Charges $3, 160 Income taxes $3, 344 Current Assets. ROI 6, 13% Cash $2, 540 Marketable securities $1, 800 Accounts receiv. $18, 320 Invento-ri es $27, 530 Net plant and equipment $31, 700 Total Assets to stockholders’ equity 2, 382 ROE 14, 60%
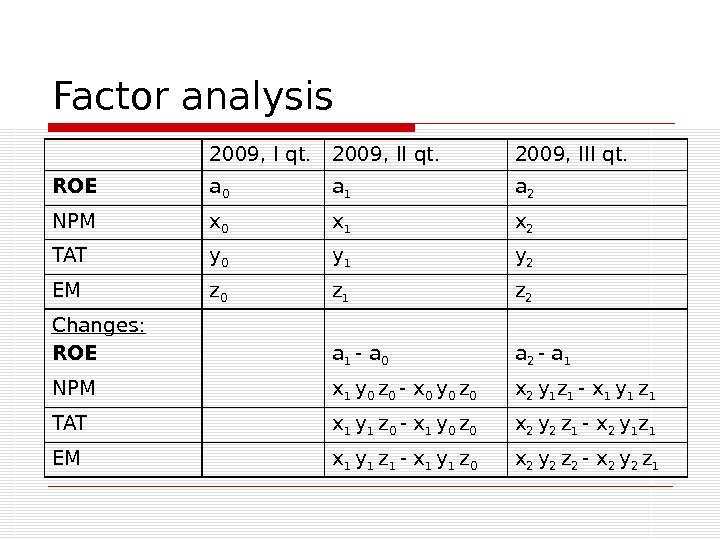
Factor analysis 2009, I qt. 2009, III qt. ROE a 0 a 1 a 2 NPM x 0 x 1 x 2 TAT y 0 y 1 y 2 EM z 0 z 1 z 2 Changes: ROE a 1 — a 0 a 2 — a 1 NPM x 1 y 0 z 0 — x 0 y 0 z 0 x 2 y 1 z 1 — x 1 y 1 z 1 TAT x 1 y 1 z 0 — x 1 y 0 z 0 x 2 y 2 z 1 — x 2 y 1 z 1 EM x 1 y 1 z 1 — x 1 y 1 z 0 x 2 y 2 z 2 — x 2 y 2 z
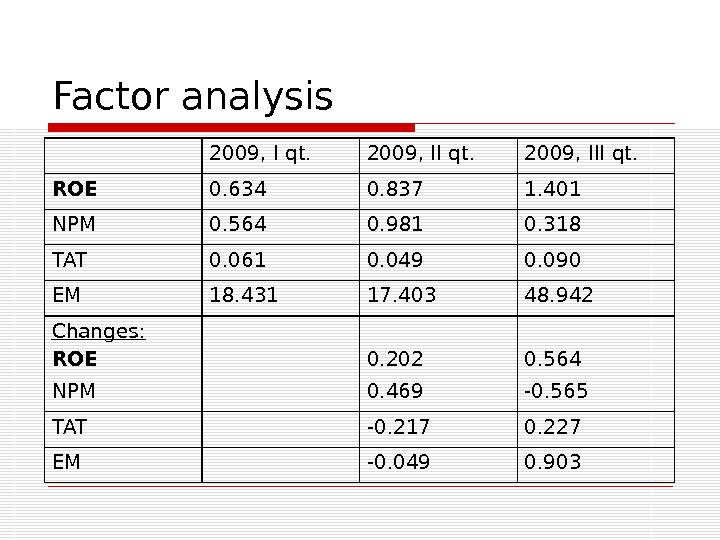
Factor analysis 2009, I qt. 2009, III qt. ROE 0. 634 0. 837 1. 401 NPM 0. 564 0. 981 0. 318 TAT 0. 061 0. 049 0. 090 EM 18. 431 17. 403 48. 942 Changes: ROE 0. 202 0. 564 NPM 0. 469 -0. 565 TAT -0. 217 0. 227 EM -0. 049 0.
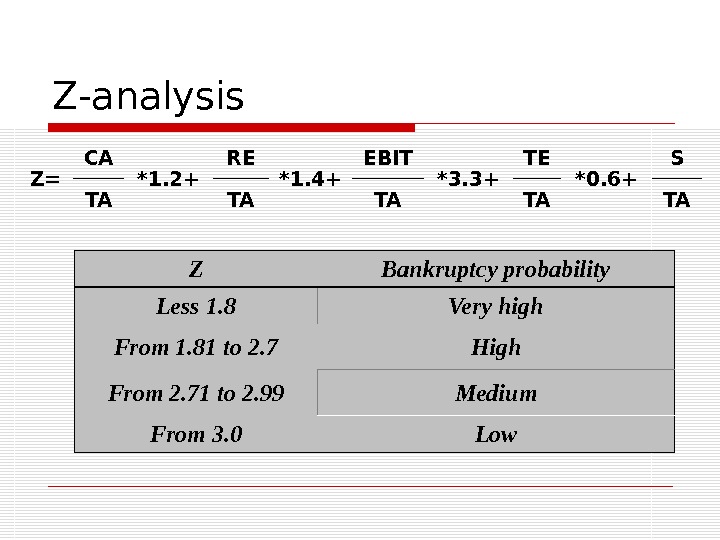
Z-analysis Z= CA *1. 2+ RE *1. 4+ EBIT *3. 3+ TE *0. 6+ S TA TA TA Z Bankruptcy probability Less 1. 8 Very high From 1. 81 to 2. 7 High From 2. 71 to 2. 99 Medium From 3. 0 Low
CASH FLOW MANAGEMENT
NET CASH FLOW
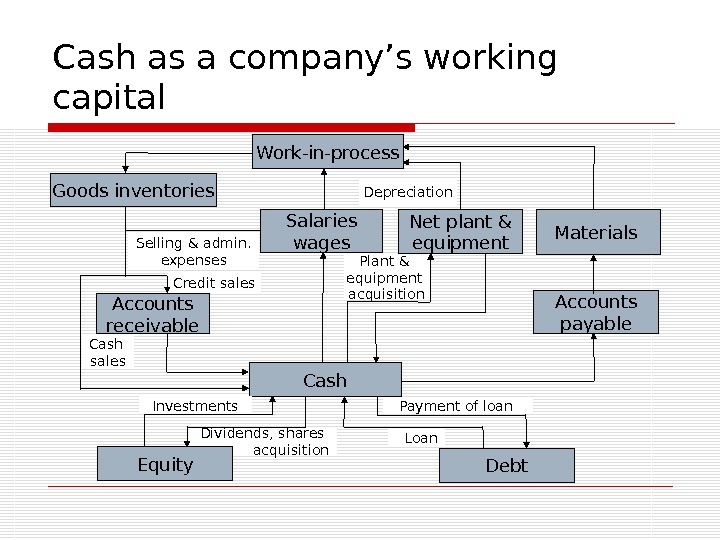
Cash as a company’s working capital Cash. Salaries wages. Work-in-process Goods inventories Accounts receivable Net plant & equipment Materials Plant & equipment acquisition Depreciation Selling & admin. expenses Credit sales Cash sales Investments Dividends, shares acquisition Equity Debt. Loan. Payment of loan Accounts payable
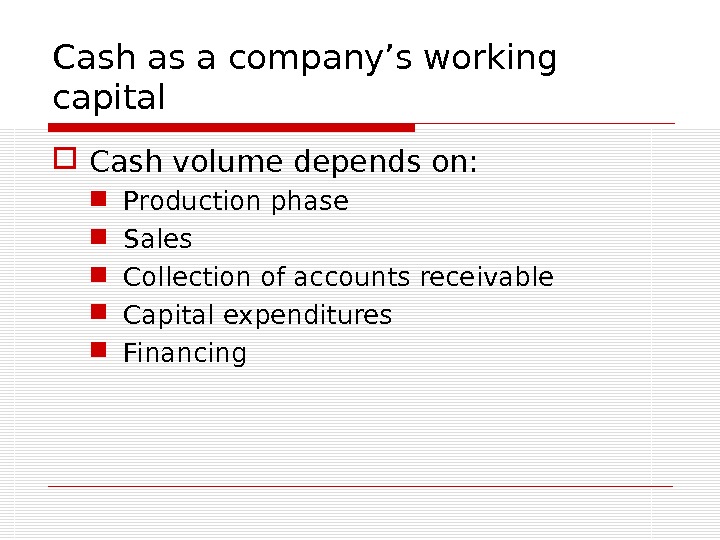
Cash as a company’s working capital Cash volume depends on: Production phase Sales Collection of accounts receivable Capital expenditures Financing
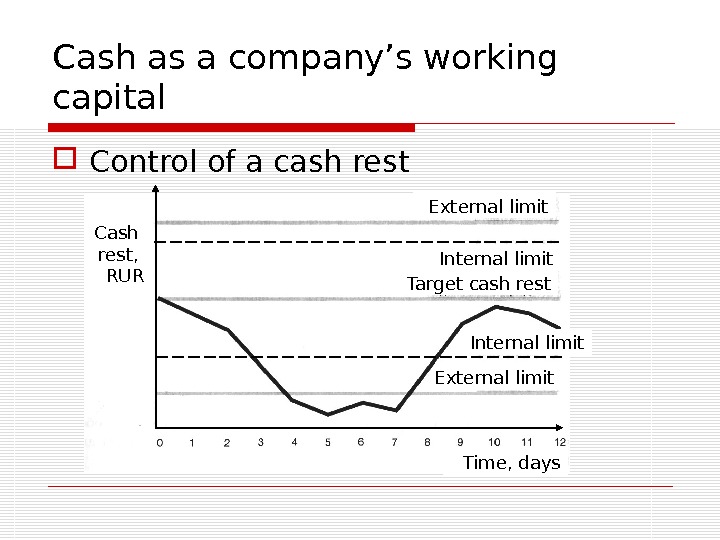
Cash as a company’s working capital Control of a cash rest Cash rest, RUR External limit Internal limit Target cash rest Time, days
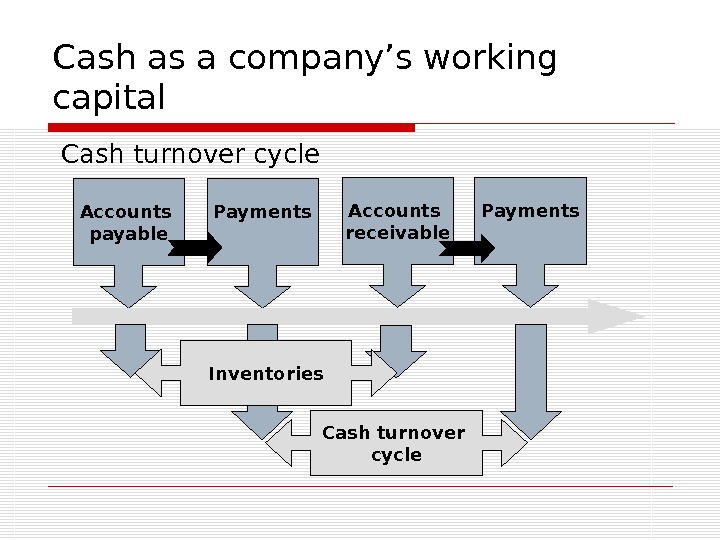
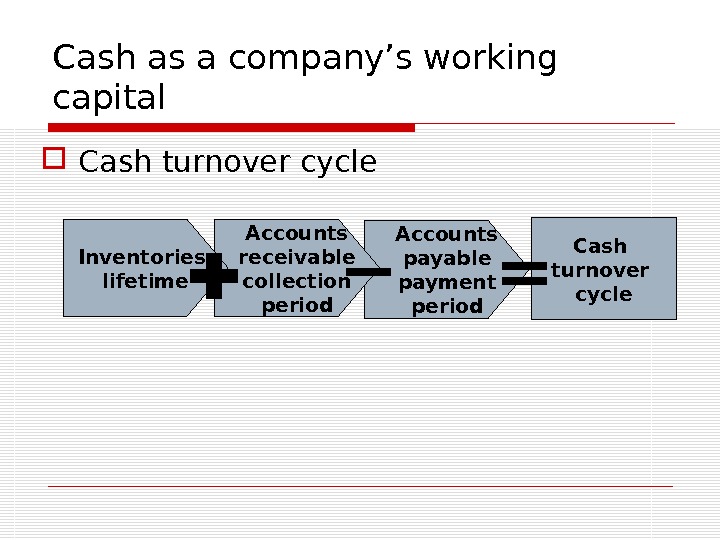
Cash as a company’s working capital Cash turnover cycle Accounts payable Payments Accounts receivable Payments Inventories Cash turnover cycle
Accounts payable payment period. Accounts receivable collection period. Cash as a company’s working capital Cash turnover cycle Inventories lifetime Cash turnover cycle
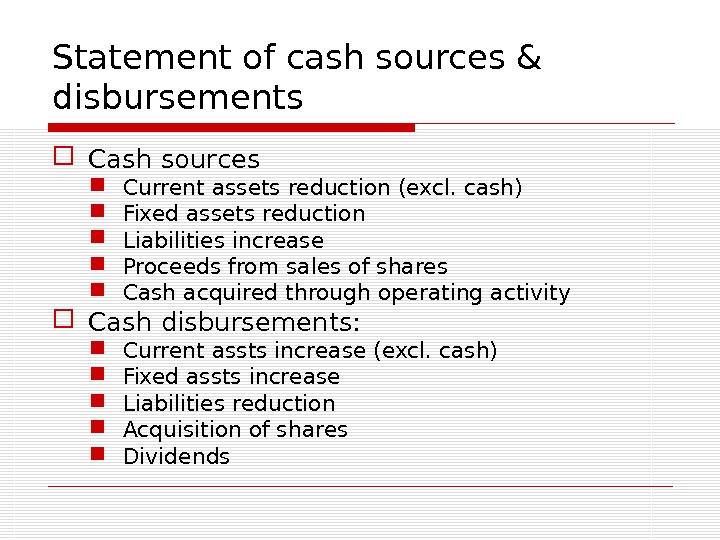
Statement of cash sources & disbursements Cash sources Current assets reduction (excl. cash) Fixed assets reduction Liabilities increase Proceeds from sales of shares Cash acquired through operating activity Cash disbursements: Current assts increase (excl. cash) Fixed assts increase Liabilities reduction Acquisition of shares Dividends
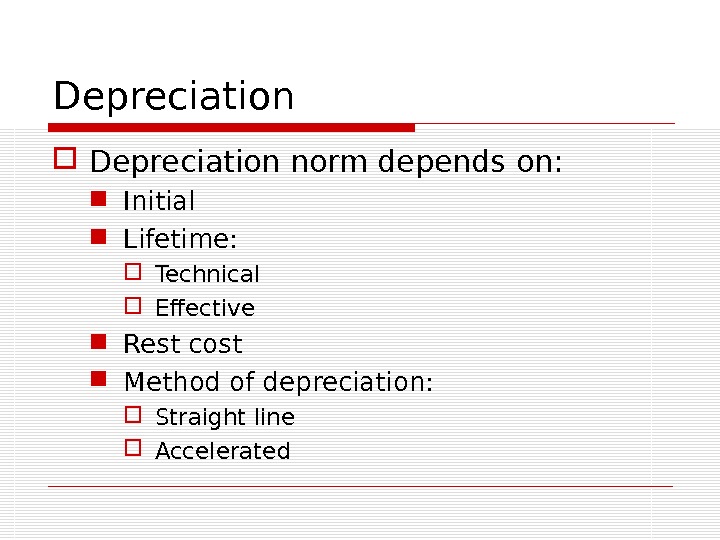
Depreciation norm depends on: Initial Lifetime: Technical Effective Rest cost Method of depreciation: Straight line Accelerated
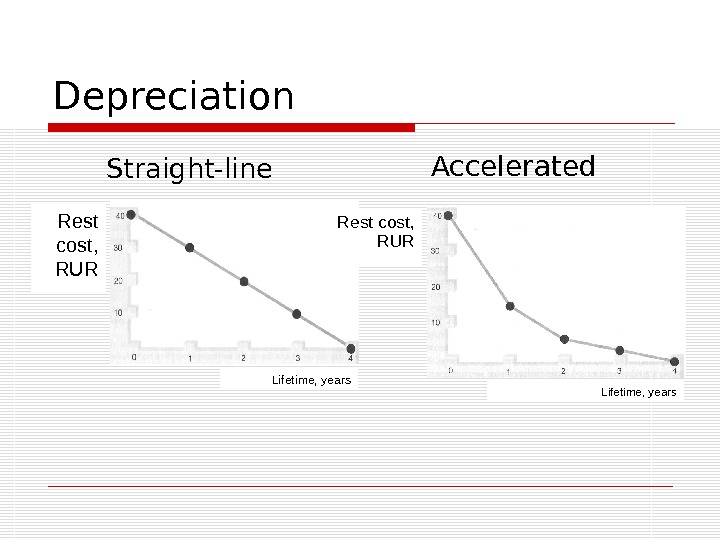
Depreciation Straight-line Rest cost, RUR Lifetime, years Rest cost, RUR Lifetime, years. Accelerated
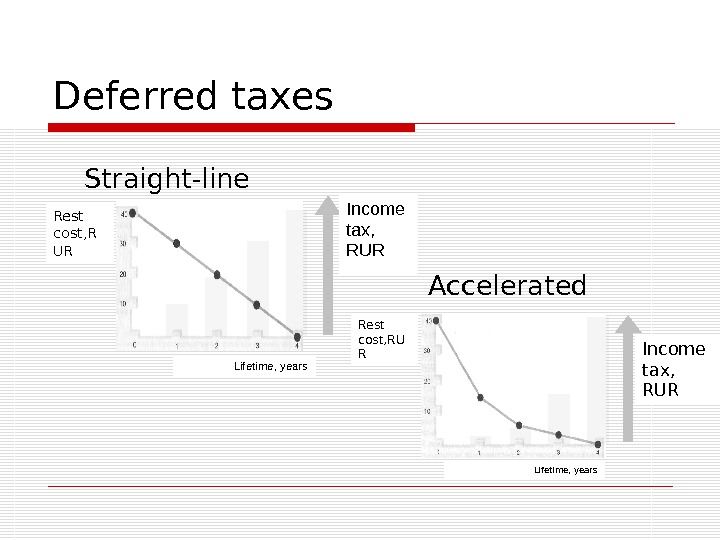
Deferred taxes Straight-line Accelerated. Rest cost, R UR Lifetime, years Income tax, RUR Rest cost, RU R Lifetime, years Income tax, RUR
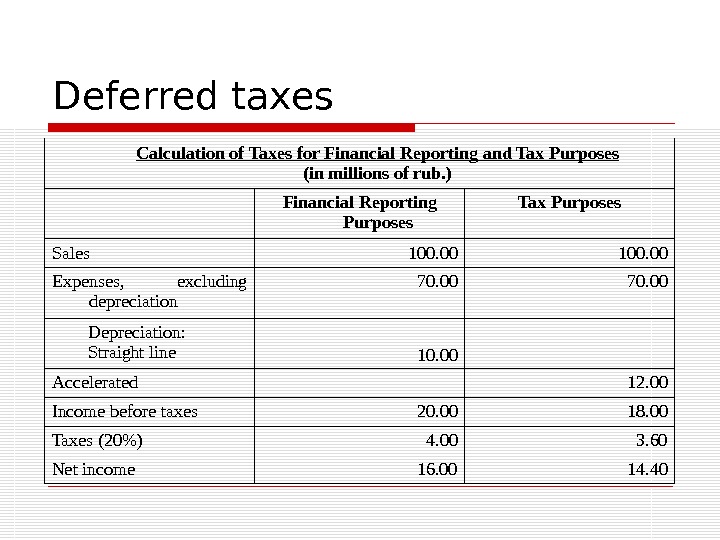
Deferred taxes Calculation of Taxes for Financial Reporting and Tax Purposes (in millions of rub. ) Financial Reporting Purposes Tax Purposes Sales 100. 00 Expenses, excluding depreciation 70. 00 Depreciation: Straight line 10. 00 Accelerated 12. 00 Income before taxes 20. 00 18. 00 Taxes (20%) 4. 00 3. 60 Net income 16. 00 14.
CASH FLOW FORECASTING
Forecasting of financial statements 5 steps: 1. Define basic data forecasting: external income tax rate interest rate inflation technological changes volume of the market and growth perspectives competition level market strength of suppliers and customers…
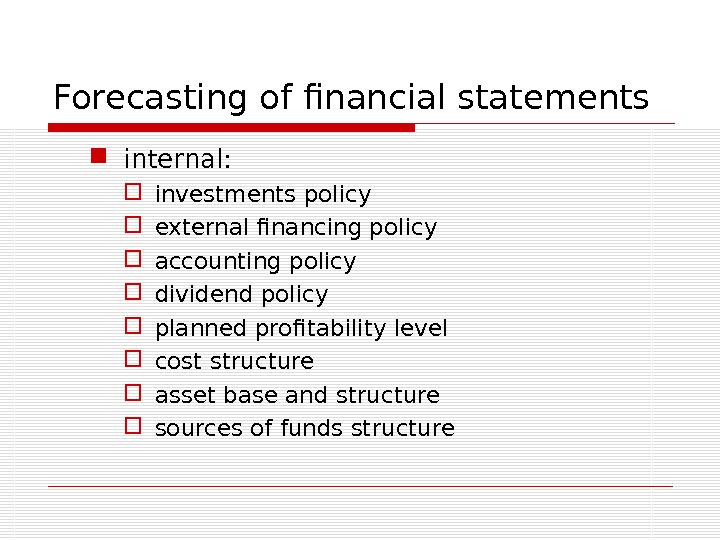
Forecasting of financial statements internal: investments policy external financing policy accounting policy dividend policy planned profitability level cost structure asset base and structure sources of funds structure
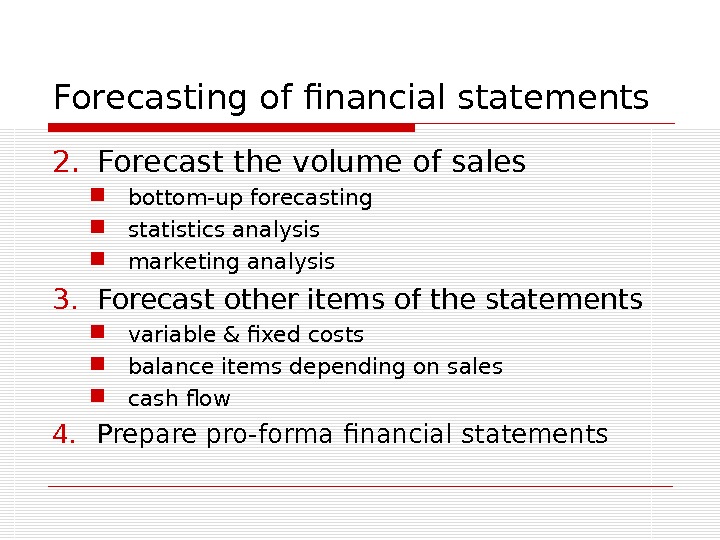
Forecasting of financial statements 2. Forecast the volume of sales bottom-up forecasting statistics analysis marketing analysis 3. Forecast other items of the statements variable & fixed costs balance items depending on sales cash flow 4. Prepare pro-forma financial statements
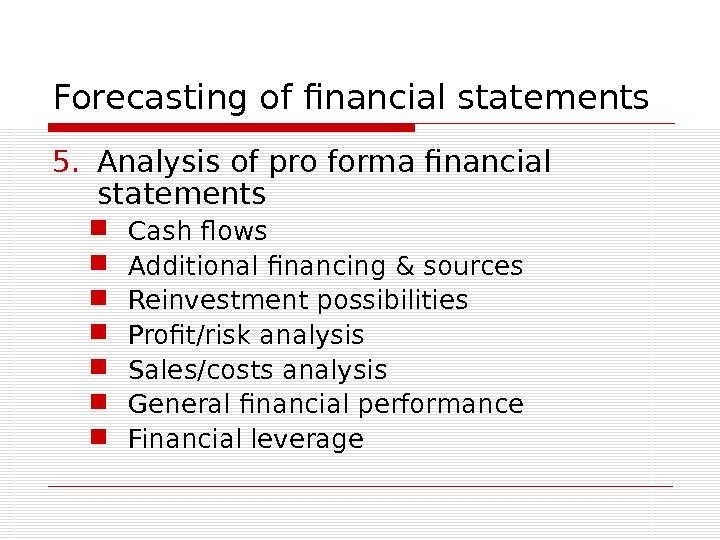
Forecasting of financial statements 5. Analysis of pro forma financial statements Cash flows Additional financing & sources Reinvestment possibilities Profit/risk analysis Sales/costs analysis General financial performance Financial leverage
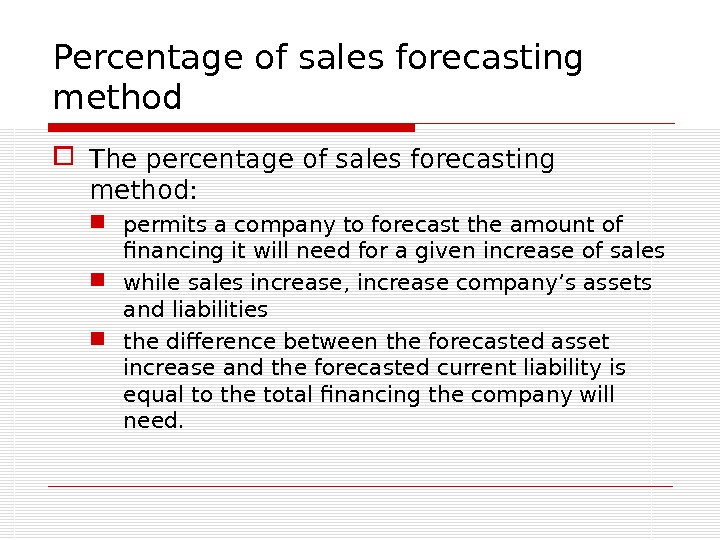
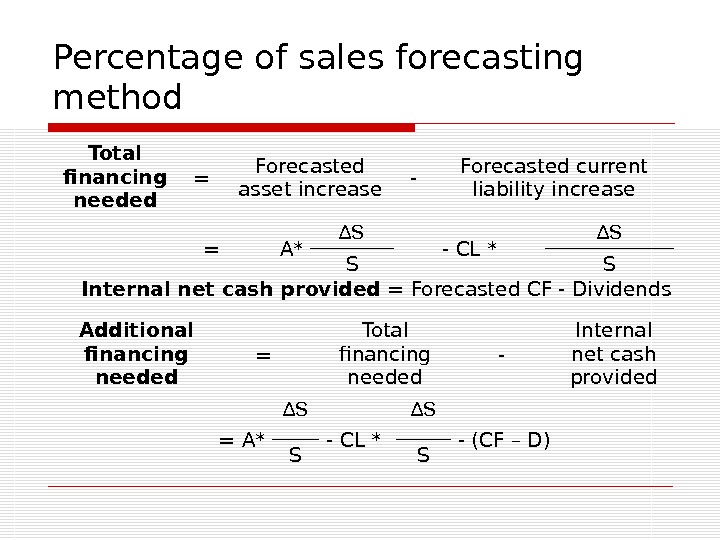
Percentage of sales forecasting method The percentage of sales forecasting method: permits a company to forecast the amount of financing it will need for a given increase of sales while sales increase, increase company’s assets and liabilities the difference between the forecasted asset increase and the forecasted current liability is equal to the total financing the company will need.
Percentage of sales forecasting method Total financing needed = Forecasted asset increase — Forecasted current liability increase = A* ∆ S — CL * ∆ S S S Internal net cash provided = Forecasted CF — Dividends Additional financing needed = Total financing needed — Internal net cash provided = A* ∆ S — CL * ∆ S — (CF – D) S S
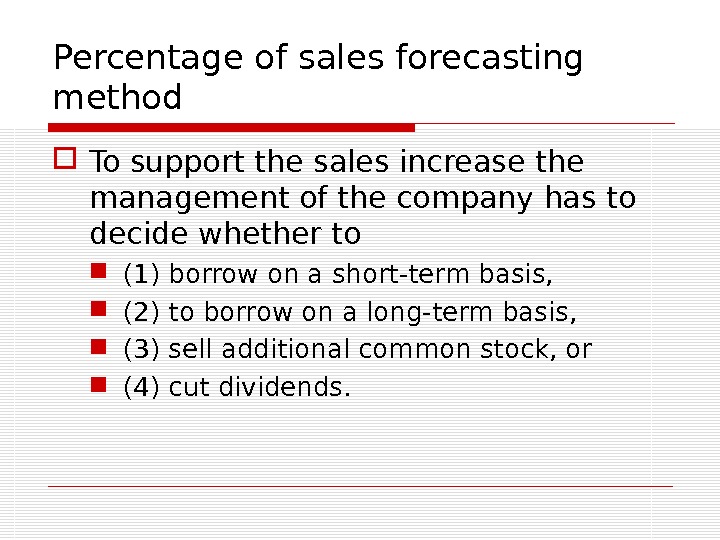
Percentage of sales forecasting method To support the sales increase the management of the company has to decide whether to (1) borrow on a short-term basis, (2) to borrow on a long-term basis, (3) sell additional common stock, or (4) cut dividends.
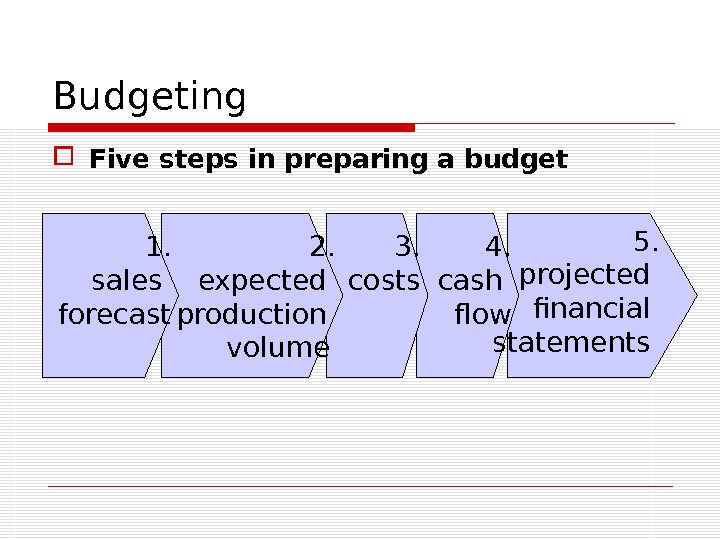
Budgeting Five steps in preparing a budget 4. cash flow 3. costs 2. expected production volume 1. sales forecast 5. projected financial statements
COSTS PLANNING
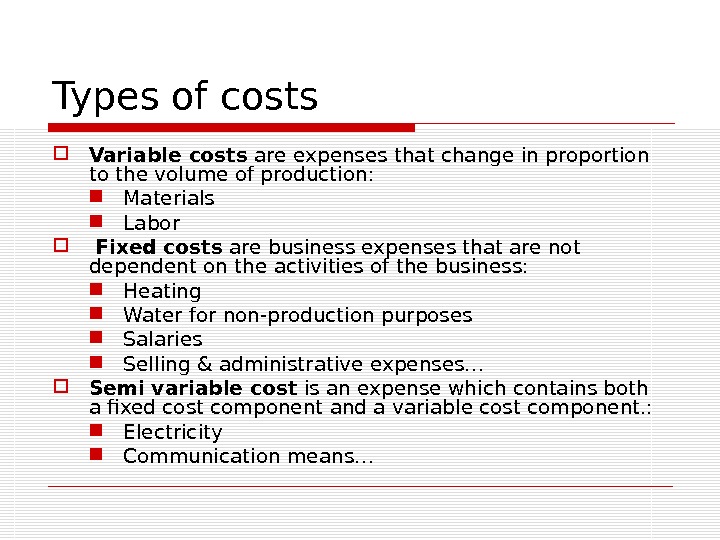
Types of costs Variable costs are expenses that change in proportion to the volume of production: Materials Labor Fixed costs are business expenses that are not dependent on the activities of the business: Heating Water for non-production purposes Salaries Selling & administrative expenses… Semi variable cost is an expense which contains both a fixed cost component and a variable cost component. : Electricity Communication means…
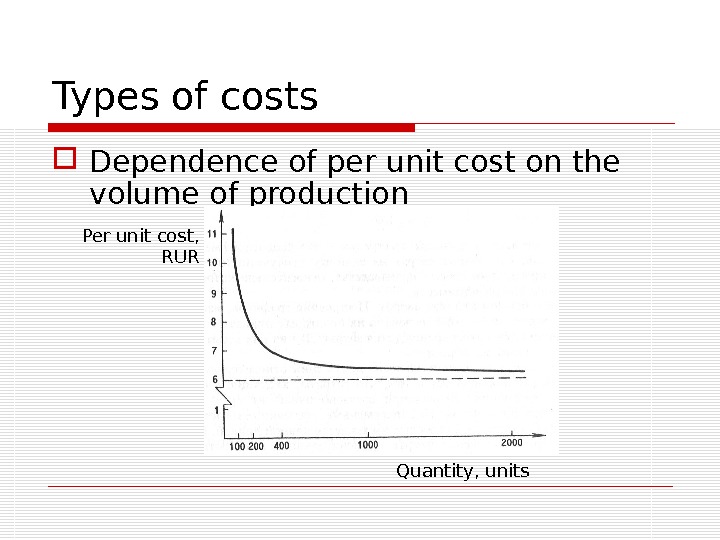
Types of costs Dependence of per unit cost on the volume of production Per unit cost, RUR Quantity, units
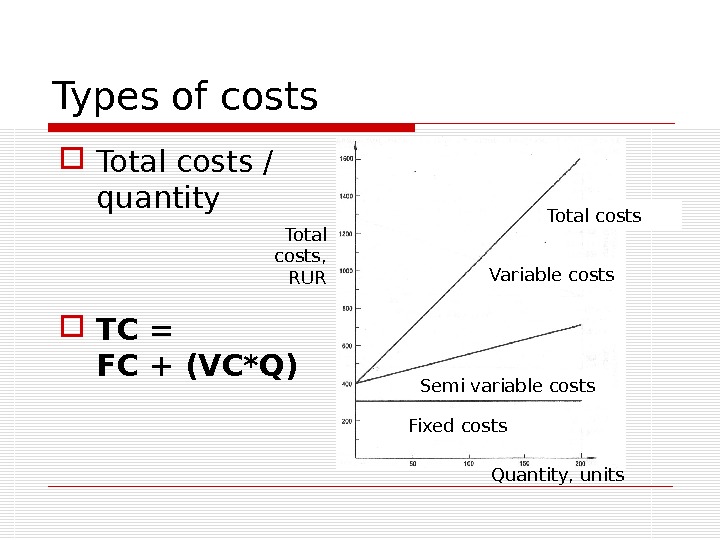
Types of costs Total costs / quantity TC = FC + (VC*Q) Total costs, RUR Quantity, units. Fixed costs Semi variable costs Variable costs Total costs
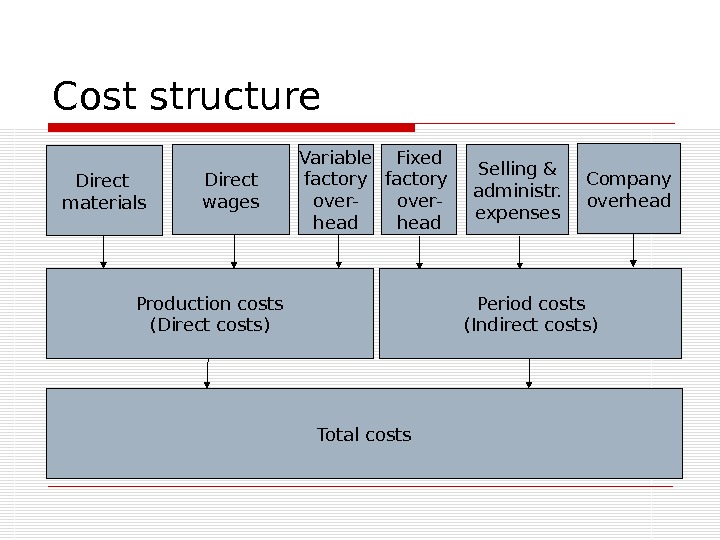
Cost structure A cost is the value of money that has been used up to produce something Direct costs are those for activities or services that benefit specific projects Indirect costs are those for activities or services that benefit more than one project.
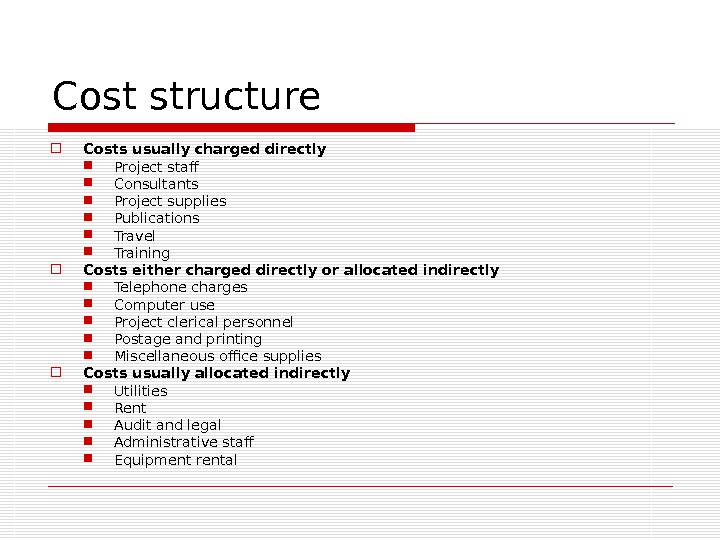
Cost structure Costs usually charged directly Project staff Consultants Project supplies Publications Travel Training Costs either charged directly or allocated indirectly Telephone charges Computer use Project clerical personnel Postage and printing Miscellaneous office supplies Costs usually allocated indirectly Utilities Rent Audit and legal Administrative staff Equipment rental
Cost structure Direct materials Direct wages Variable factory over- head Fixed factory over- head Selling & administr. expenses Company overhead Production costs (Direct costs) Period costs (Indirect costs) Total costs