
Copyright © 2006 Pearson Addison-Wesley. All rights reserved.


13_-stock_the_capital_markets.ppt
- Размер: 754 Кб
- Количество слайдов: 30
Описание презентации Copyright © 2006 Pearson Addison-Wesley. All rights reserved. по слайдам
Copyright © 2006 Pearson Addison-Wesley. All rights reserved. 11 — 1 Ch 13 The Capital Markets: stocks
Copyright © 2006 Pearson Addison-Wesley. All rights reserved. 11 — 2 Overview I. Capital market securities: stocks II. Valuation of the Common Stock Price: Dividend discount model Dividend growth model P/E ratio model Errors in valuation III. Stock Indexes
Copyright © 2006 Pearson Addison-Wesley. All rights reserved. 11 — 3 I. CAPITAL MARKET SECURITIES : STOCKS 1. Represents ownership in a firm 2. Earn a return in two ways – Price of the stock rises over time – Dividends are paid to the stockholder 3. Stockholders have claim on all assets 4. Right to vote for directors and on certain issues 5. Common stocks (right to vote, receive dividends) 6. Preferred stocks (Receive a fixed dividends, do not usually vote)
Copyright © 2006 Pearson Addison-Wesley. All rights reserved. 11 — 4 How Stocks are Sold • Organized exchanges – Account for over 72% of total dollar volume – Largest U. S. Exchange is the NYSE – Others include Nikkei, LSE, DAX, etc. – Listing requirements exclude small firms • Over-the-counter markets – Best example is NASDAQ – Dealers stand ready to make a market
Copyright © 2006 Pearson Addison-Wesley. All rights reserved. 11 — 5 Investing in Stocks: Organized vs. OTC • Organized exchanges (e. g. , NYSE) – Auction markets with floor specialists – 25% of trades are filled directly by specialist – Remaining trades are filled through Super. DOT • Over-the-counter markets (e. g. , NASDAQ) – Multiple market makers set bid and ask prices – Multiple dealers for any given security
Copyright © 2006 Pearson Addison-Wesley. All rights reserved. 11 — 6 Investing in Stocks: ECNs (electronic communication networks) allow brokers and traders to trade without the need of the middleman. They provide: – Transparency: everyone can see unfilled orders – Cost reduction: smaller spreads – Faster execution – After-hours trading
Copyright © 2006 Pearson Addison-Wesley. All rights reserved. 11 — 7 II. Computing the Price of Common Stock Valuing common stock is, in theory, no different from valuing debt securities: determine the future cash flows and discount them to the present at an appropriate discount rate. There are 4 different methods for valuing stocks: a) One period valuation model; b) Generalized valuation model; c) Gordon growth model; d) P/E ratio model.
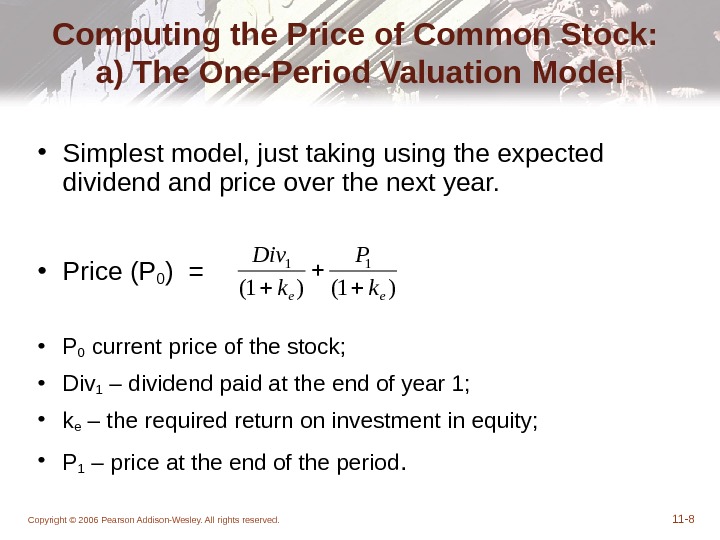
Copyright © 2006 Pearson Addison-Wesley. All rights reserved. 11 — 8 Computing the Price of Common Stock: a) The One-Period Valuation Model • Simplest model, just taking using the expected dividend and price over the next year. • Price (P 0 ) = • P 0 current price of the stock; • Div 1 – dividend paid at the end of year 1; • k e – the required return on investment in equity; • P 1 – price at the end of the period. )1()1( 11 eek P k Div
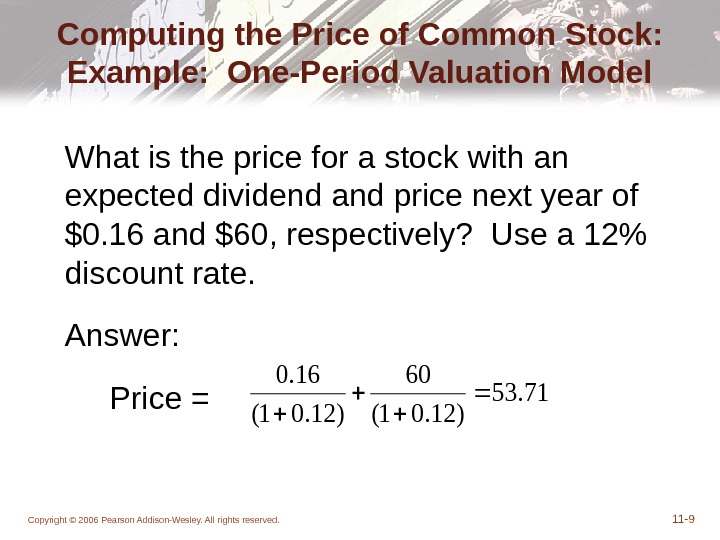
Copyright © 2006 Pearson Addison-Wesley. All rights reserved. 11 — 971. 53 )12. 01( 60 )12. 01( 16. 0 Computing the Price of Common Stock: Example: One-Period Valuation Model What is the price for a stock with an expected dividend and price next year of $0. 16 and $60, respectively? Use a 12% discount rate. Answer: Price =
Copyright © 2006 Pearson Addison-Wesley. All rights reserved. 11 — 10 Computing the Price of Common Stock: b) The Generalized Dividend Valuation Model • Most general model, but the infinite sum may not converge. • Price = • This model assumes that the Dividends payments will be constant within the t-period. • Price at the end of the period (Pn ) can be omitted because if it is far in future it will not affect P 0. 1)1(t t e t k Div
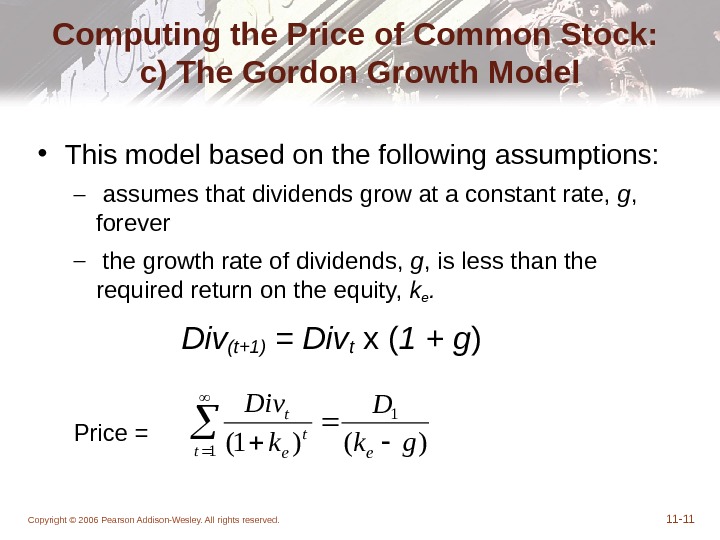
Copyright © 2006 Pearson Addison-Wesley. All rights reserved. 11 — 11 Computing the Price of Common Stock: c) The Gordon Growth Model • This model based on the following assumptions: – assumes that dividends grow at a constant rate, g , forever – the growth rate of dividends, g , is less than the required return on the equity, ke. Div (t+1) = Divt x ( 1 + g ) Price = )()1( 1 1 gk D k Div et t e t
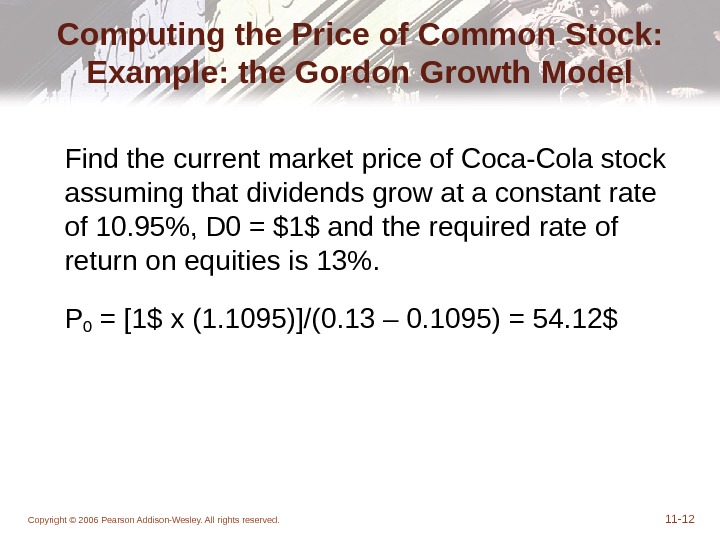
Copyright © 2006 Pearson Addison-Wesley. All rights reserved. 11 — 12 Computing the Price of Common Stock: Example: the Gordon Growth Model Find the current market price of Coca-Cola stock assuming that dividends grow at a constant rate of 10. 95%, D 0 = $1$ and the required rate of return on equities is 13%. P 0 = [1$ x (1. 1095)]/(0. 13 – 0. 1095) = 54. 12$
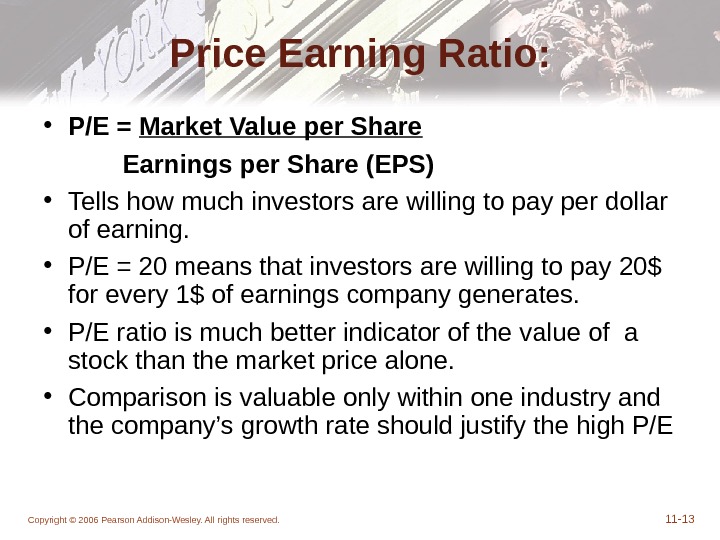
Copyright © 2006 Pearson Addison-Wesley. All rights reserved. 11 — 13 Price Earning Ratio: • P/E = Market Value per Share Earnings per Share (EPS) • Tells how much investors are willing to pay per dollar of earning. • P/E = 20 means that investors are willing to pay 20$ for every 1$ of earnings company generates. • P/E ratio is much better indicator of the value of a stock than the market price alone. • Comparison is valuable only within one industry and the company’s growth rate should justify the high P/
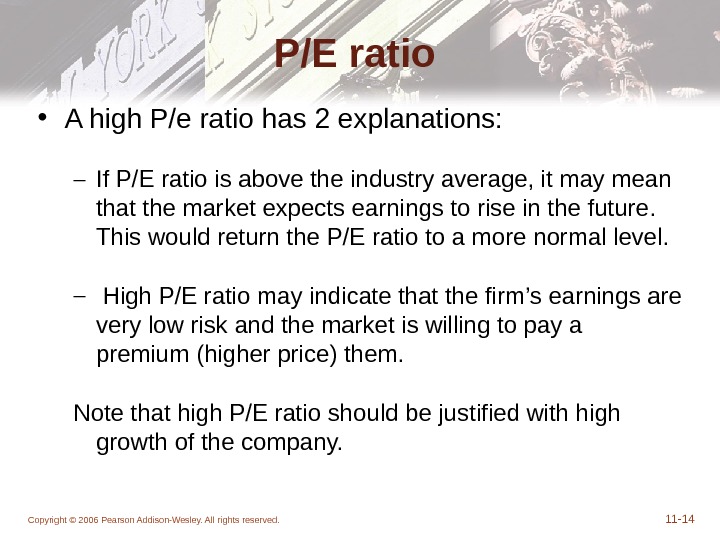
Copyright © 2006 Pearson Addison-Wesley. All rights reserved. 11 — 14 P/E ratio • A high P/e ratio has 2 explanations: – If P/E ratio is above the industry average, it may mean that the market expects earnings to rise in the future. This would return the P/E ratio to a more normal level. – High P/E ratio may indicate that the firm’s earnings are very low risk and the market is willing to pay a premium (higher price) them. Note that high P/E ratio should be justified with high growth of the company.
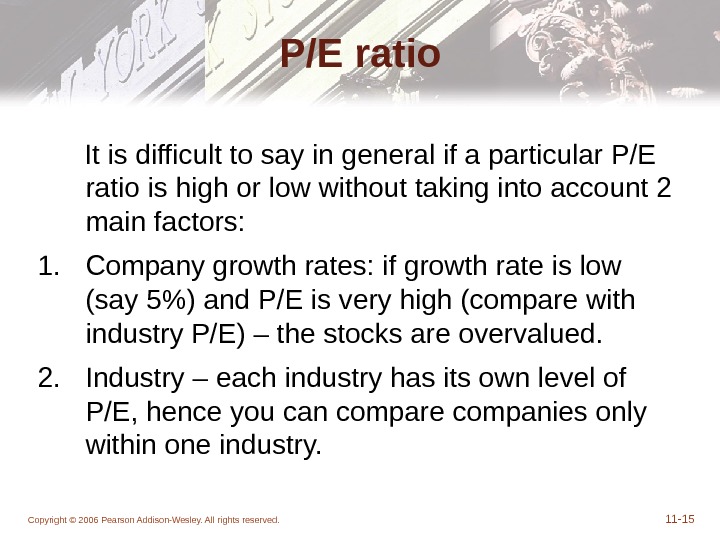
Copyright © 2006 Pearson Addison-Wesley. All rights reserved. 11 — 15 P/E ratio It is difficult to say in general if a particular P/E ratio is high or low without taking into account 2 main factors: 1. Company growth rates: if growth rate is low (say 5%) and P/E is very high (compare with industry P/E) – the stocks are overvalued. 2. Industry – each industry has its own level of P/E, hence you can compare companies only within one industry.
Copyright © 2006 Pearson Addison-Wesley. All rights reserved. 11 — 16 Computing the Price of Common Stock: Example: the Price Earnings ratio model P = If the industry P/E ratio for a firm is 16, what is the current stock price for a firm with earnings for $1. 13 per share? Answer: Price = 16 x $1. 13 = $18. 08 E E P
Copyright © 2006 Pearson Addison-Wesley. All rights reserved. 11 — 17 Errors in Valuations Although the pricing models are useful, market participants frequently encounter problems in using them. Any of these can have a significant impact on price: • Problems with Estimating Growth • Problems with Estimating Risk • Problems with Forecasting Dividends
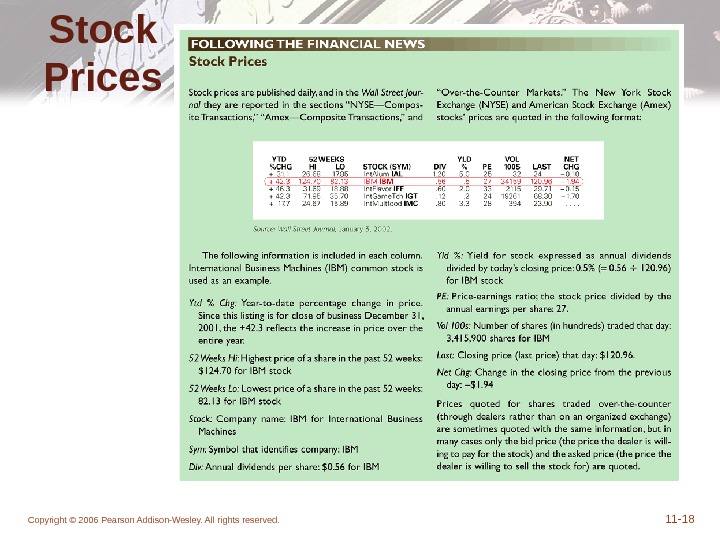
Copyright © 2006 Pearson Addison-Wesley. All rights reserved. 11 — 18 Stock Prices
Copyright © 2006 Pearson Addison-Wesley. All rights reserved. 11 — 19 What courses Stock prices change? • Prices are set in competitive markets and changed by supply and demand forces. • However, investors have strong preferences for some stocks and dislike other stocks. Why? • The buyer willing to pay the most for an asset usually dictates the prices. • Superior information can play an important role in setting stock prices
Copyright © 2006 Pearson Addison-Wesley. All rights reserved. 11 — 20 How the Market Sets Security Prices • Consider the following three valuations for a stock with certain dividends but different perceived risk: • Bud, who perceives the lowest risk, is willing to pay the most and will determine the “market” price.
Copyright © 2006 Pearson Addison-Wesley. All rights reserved. 11 — 21 Buying Foreign Stocks • Buying foreign stocks is useful from a diversification perspective. However, the purchase may be complicated if the shares are not traded in the U. S. • American depository receipts (ADRs) allow foreign firms to trade on U. S. exchanges, facilitating their purchase. U. S. banks buy foreign shares and issue receipts against the shares in U. S. markets.
Copyright © 2006 Pearson Addison-Wesley. All rights reserved. 11 — 22 III. STOCK INDEXES • Monitor and measure market movements • Economic indicators • Benchmarks in fund management • Creation of new products (Index funds, options, futures indices) • Analysts’ forecast, risk management etc.
Copyright © 2006 Pearson Addison-Wesley. All rights reserved. 11 — 23 INDEX CONSTRUCTION • Arithmetic Averaging: • Suppose the index base value is 100. By the next day the share prices on A, B, C (with the market values of 1 mill) changed by +15%, + 11% and – 20%. • (15%+11%-20%)/3 = +2%, or • 1. 15 +1. 11 + 0. 8 = 3. 06 mill, 3. 06/3 – 1 = 0. 02 • Hence the Index =
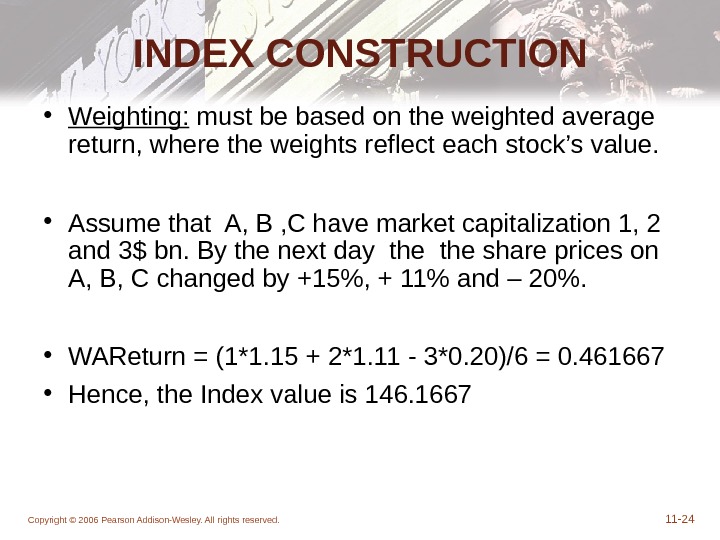
Copyright © 2006 Pearson Addison-Wesley. All rights reserved. 11 — 24 INDEX CONSTRUCTION • Weighting: must be based on the weighted average return, where the weights reflect each stock’s value. • Assume that A, B , C have market capitalization 1, 2 and 3$ bn. By the next day the share prices on A, B, C changed by +15%, + 11% and – 20%. • WAReturn = (1*1. 15 + 2*1. 11 — 3*0. 20)/6 = 0. 461667 • Hence, the Index value is 146.
Copyright © 2006 Pearson Addison-Wesley. All rights reserved. 11 — 25 COMPLICATIONS WITH INDICES • Some companies are under restructuring, mergers and acquisitions; • Cross holding should be excluded to avoid double counting. • International indices should be adjusted for currency movements.
Copyright © 2006 Pearson Addison-Wesley. All rights reserved. 11 — 26 Examples of Indexes • Dow Jones Industrial Average (30 Stocks) • Standard & Poor’s 500 Composite • NASDAQ 100 composite • Nikkei 225 & Nikkei 300 • FTSE (Financial Times of London) • Dax, CAC • RCBK • Region and Country Indexes – EAFE – Far East
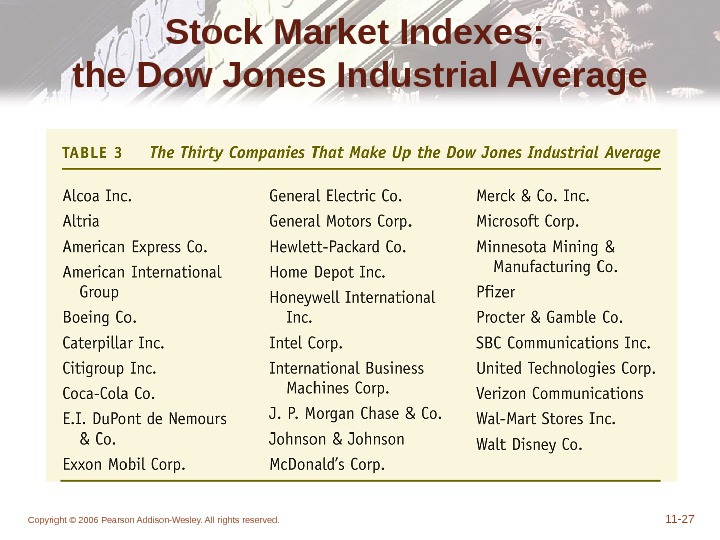
Copyright © 2006 Pearson Addison-Wesley. All rights reserved. 11 — 27 Stock Market Indexes: the Dow Jones Industrial Average
Copyright © 2006 Pearson Addison-Wesley. All rights reserved. 11 — 28 Stock Market Indexes, DJIA Figure 11. 2 b Dow Jones Industrial Average, 1990 -2004 Historical stocks charts are found at http: //stockcharts. com/charts/historical/
Copyright © 2006 Pearson Addison-Wesley. All rights reserved. 11 — 29 Stock Market Indexes • The next two slides show the Dow Jones Industrial Average from 1980– 2004. • As can be seen, $1. 00 invested in the DJIA back in 1980, when the DJIA was around 800, would have grown to about $12. 50 in 2004, when the Dow reached 10, 000. This represented an annual growth rate around 10. 6%.
Copyright © 2006 Pearson Addison-Wesley. All rights reserved. 11 — 30 Standard & Poor’s 500 • Based on a portfolio of 500 different stocks: – 400 industrials, 40 utilities, 20 transportation companies, 40 financial institutions. • Based on market capitalization weighting; • The index is account for 80% of the market capitalization of all the stocks listed on NYS