011d1f9bfcf4cea74138be55ae03f84b.ppt
- Количество слайдов: 29
 Copyright © 2006 Intel Corporation. All Rights Reserved. Techniques for Speeding up Pin -based Simulation Harish Patil -1 -
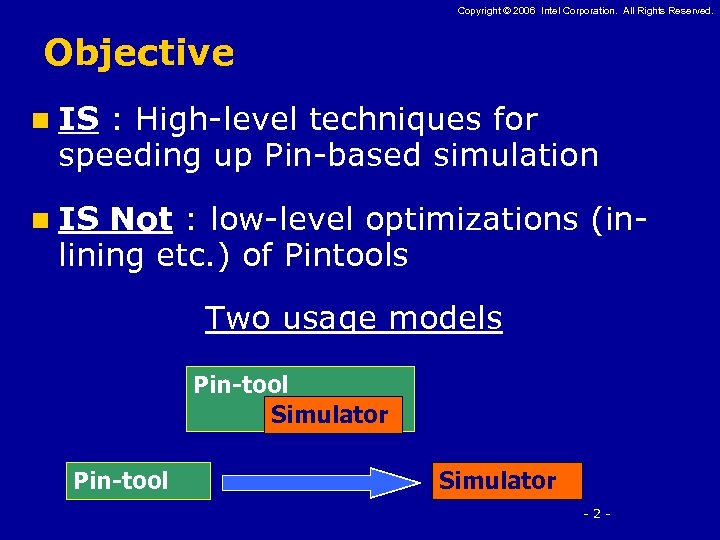 Copyright © 2006 Intel Corporation. All Rights Reserved. Objective n IS : High-level techniques for speeding up Pin-based simulation n IS Not : low-level optimizations (inlining etc. ) of Pintools Two usage models Pin-tool Simulator -2 -
 Copyright © 2006 Intel Corporation. All Rights Reserved. Outline n Two techniques: 1. Selective simulation 2. Conditional instrumentation n Pin. Points : Selecting simulation regions with Pin and Sim. Point n Case Study: Pin Simple. Scalar. x 86 -3 -
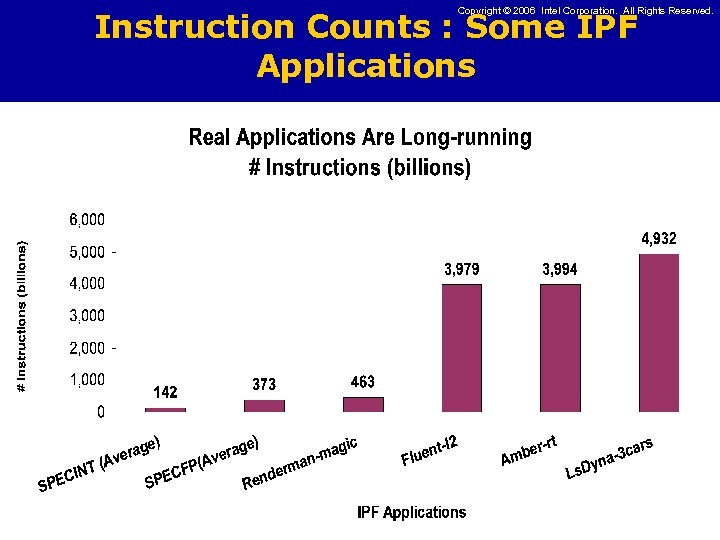 Copyright © 2006 Intel Corporation. All Rights Reserved. Instruction Counts : Some IPF Applications -4 -
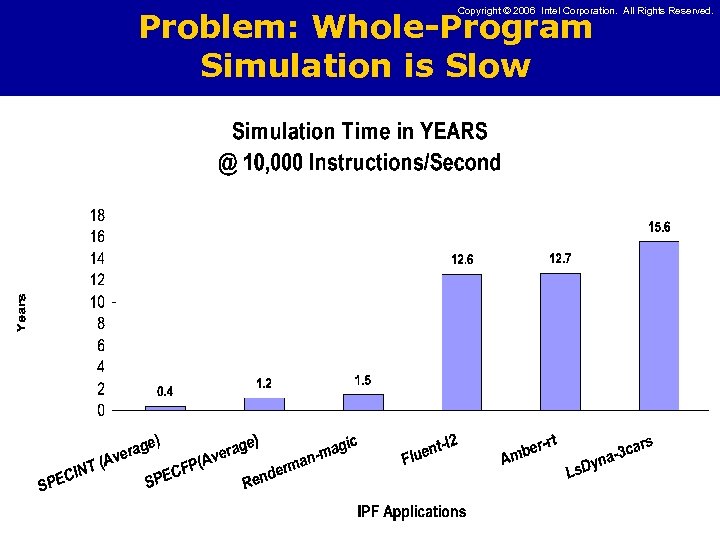 Copyright © 2006 Intel Corporation. All Rights Reserved. Problem: Whole-Program Simulation is Slow -5 -
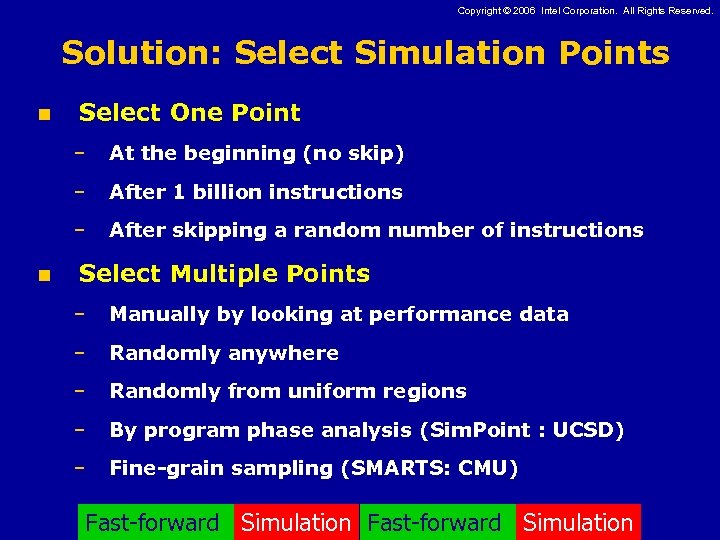 Copyright © 2006 Intel Corporation. All Rights Reserved. Solution: Select Simulation Points n Select One Point – – After 1 billion instructions – n At the beginning (no skip) After skipping a random number of instructions Select Multiple Points – Manually by looking at performance data – Randomly anywhere – Randomly from uniform regions – By program phase analysis (Sim. Point : UCSD) – Fine-grain sampling (SMARTS: CMU) -6 - Fast-forward Simulation
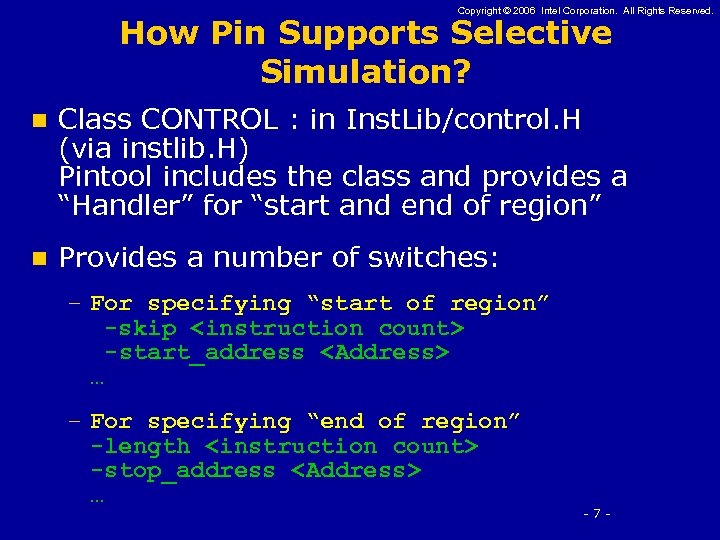 Copyright © 2006 Intel Corporation. All Rights Reserved. How Pin Supports Selective Simulation? n Class CONTROL : in Inst. Lib/control. H (via instlib. H) Pintool includes the class and provides a “Handler” for “start and end of region” n Provides a number of switches: – For specifying “start of region” -skip
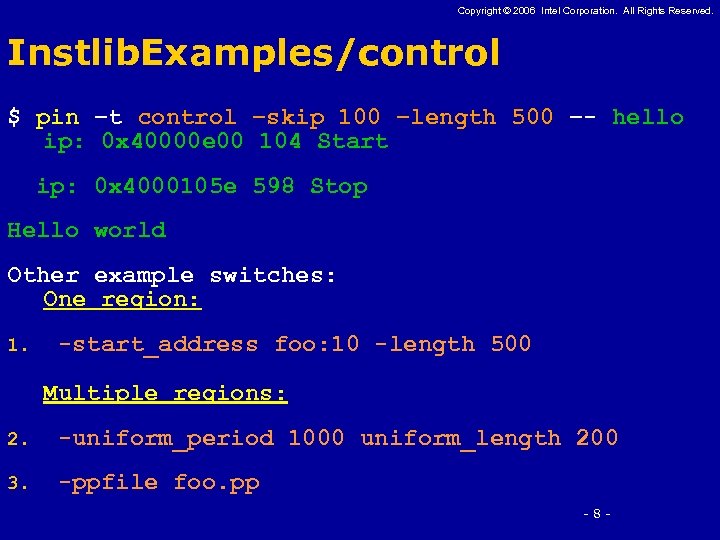 Copyright © 2006 Intel Corporation. All Rights Reserved. Instlib. Examples/control $ pin –t control –skip 100 –length 500 –- hello ip: 0 x 40000 e 00 104 Start ip: 0 x 4000105 e 598 Stop Hello world Other example switches: One region: 1. -start_address foo: 10 -length 500 Multiple regions: 2. -uniform_period 1000 uniform_length 200 3. -ppfile foo. pp -8 -
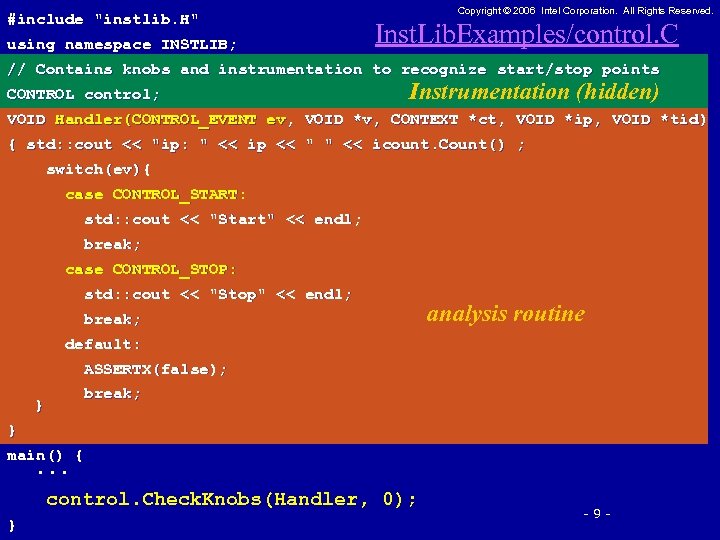 #include "instlib. H" using namespace INSTLIB; Copyright © 2006 Intel Corporation. All Rights Reserved. Inst. Lib. Examples/control. C // Contains knobs and instrumentation to recognize start/stop points CONTROL control; Instrumentation (hidden) VOID Handler(CONTROL_EVENT ev, VOID *v, CONTEXT *ct, VOID *ip, VOID *tid) { std: : cout << "ip: " << ip << " " << icount. Count() ; switch(ev){ case CONTROL_START: std: : cout << "Start" << endl; break; case CONTROL_STOP: std: : cout << "Stop" << endl; break; analysis routine default: ASSERTX(false); break; } } main() { . . . control. Check. Knobs(Handler, 0); } -9 -
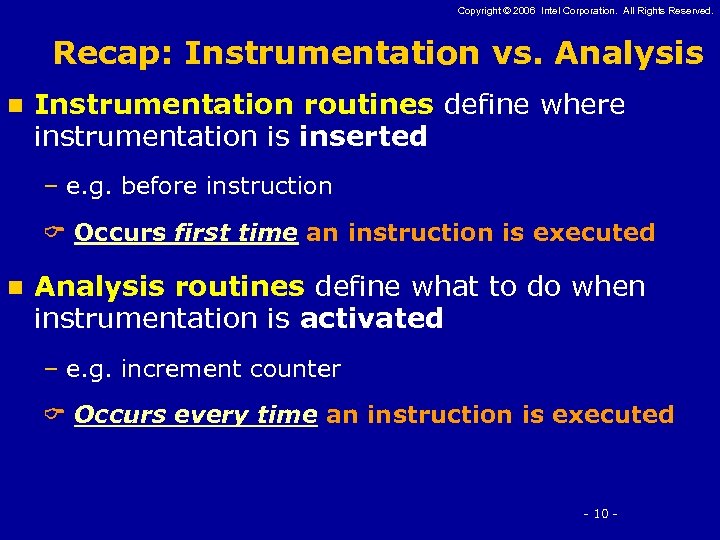 Copyright © 2006 Intel Corporation. All Rights Reserved. Recap: Instrumentation vs. Analysis n Instrumentation routines define where instrumentation is inserted – e. g. before instruction C Occurs first time an instruction is executed n Analysis routines define what to do when instrumentation is activated – e. g. increment counter C Occurs every time an instruction is executed - 10 -
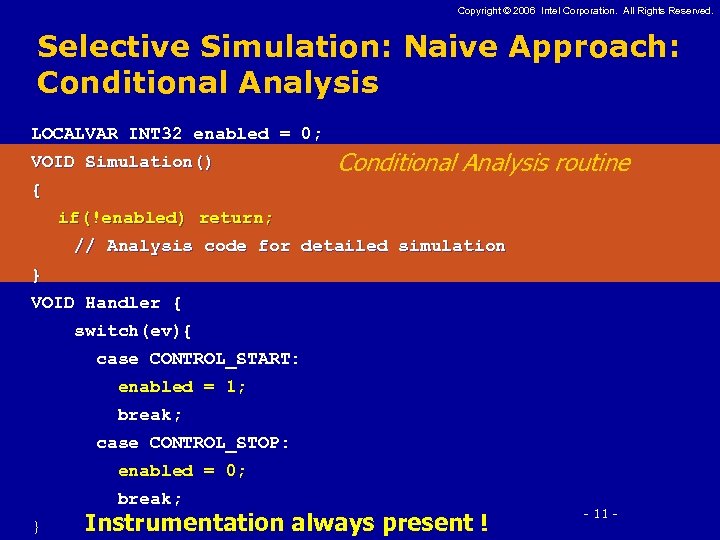 Copyright © 2006 Intel Corporation. All Rights Reserved. Selective Simulation: Naive Approach: Conditional Analysis LOCALVAR INT 32 enabled = 0; VOID Simulation() Conditional Analysis routine { if(!enabled) return; // Analysis code for detailed simulation } VOID Handler { switch(ev){ case CONTROL_START: enabled = 1; break; case CONTROL_STOP: enabled = 0; break; } Instrumentation always present ! - 11 -
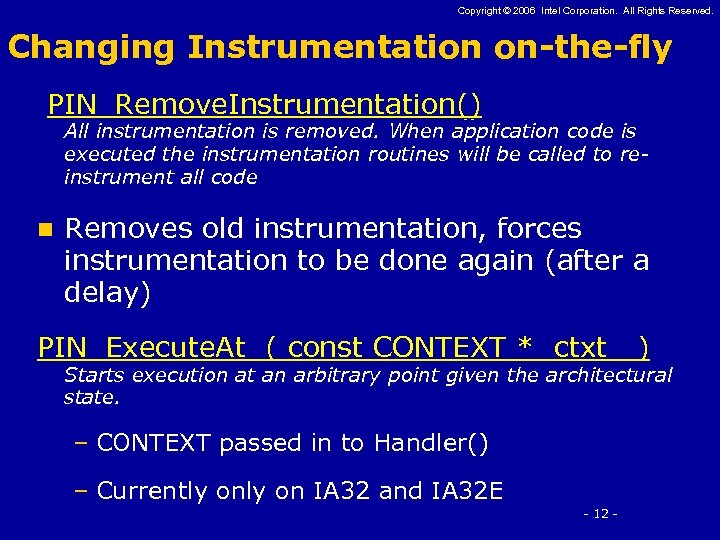 Copyright © 2006 Intel Corporation. All Rights Reserved. Changing Instrumentation on-the-fly PIN_Remove. Instrumentation() All instrumentation is removed. When application code is executed the instrumentation routines will be called to reinstrument all code n Removes old instrumentation, forces instrumentation to be done again (after a delay) PIN_Execute. At ( const CONTEXT * ctxt ) Starts execution at an arbitrary point given the architectural state. – CONTEXT passed in to Handler() – Currently on IA 32 and IA 32 E - 12 -
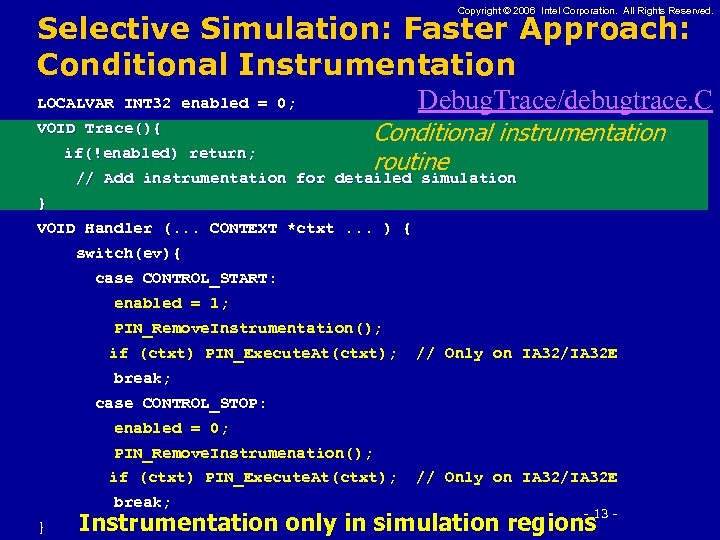 Copyright © 2006 Intel Corporation. All Rights Reserved. Selective Simulation: Faster Approach: Conditional Instrumentation Debug. Trace/debugtrace. C LOCALVAR INT 32 enabled = 0; VOID Trace(){ if(!enabled) return; Conditional instrumentation routine detailed simulation // Add instrumentation for detailed simulation } VOID Handler (. . . CONTEXT *ctxt. . . ) { switch(ev){ case CONTROL_START: enabled = 1; PIN_Remove. Instrumentation(); if (ctxt) PIN_Execute. At(ctxt); // Only on IA 32/IA 32 E break; case CONTROL_STOP: enabled = 0; PIN_Remove. Instrumenation(); if (ctxt) PIN_Execute. At(ctxt); break; } // Only on IA 32/IA 32 E - 13 - Instrumentation only in simulation regions
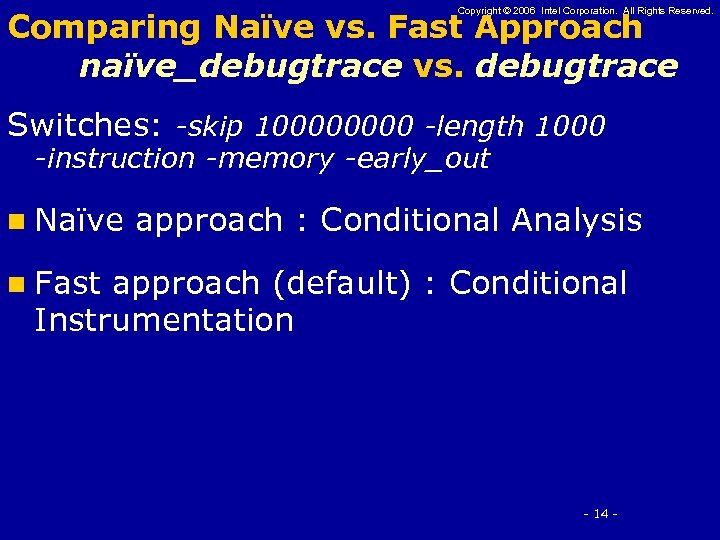 Copyright © 2006 Intel Corporation. All Rights Reserved. Comparing Naïve vs. Fast Approach naïve_debugtrace vs. debugtrace Switches: -skip 10000 -length 1000 -instruction -memory -early_out n Naïve approach : Conditional Analysis n Fast approach (default) : Conditional Instrumentation - 14 -
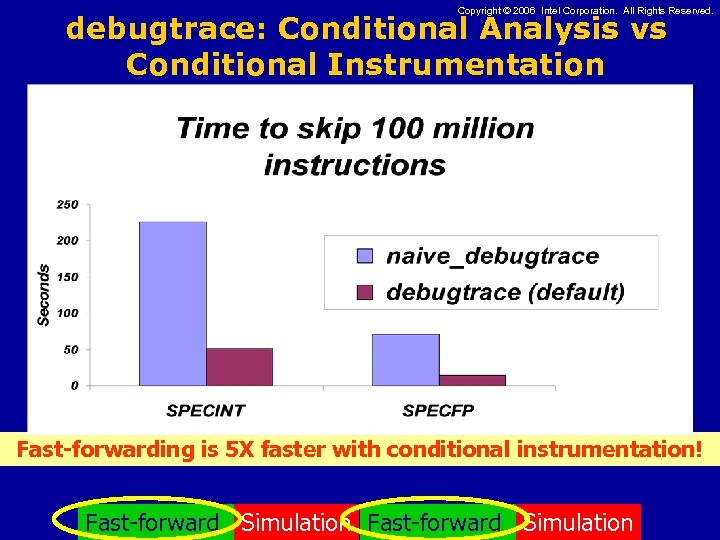 Copyright © 2006 Intel Corporation. All Rights Reserved. debugtrace: Conditional Analysis vs Conditional Instrumentation Fast-forwarding is 5 X faster with conditional instrumentation! - 15 - Fast-forward Simulation
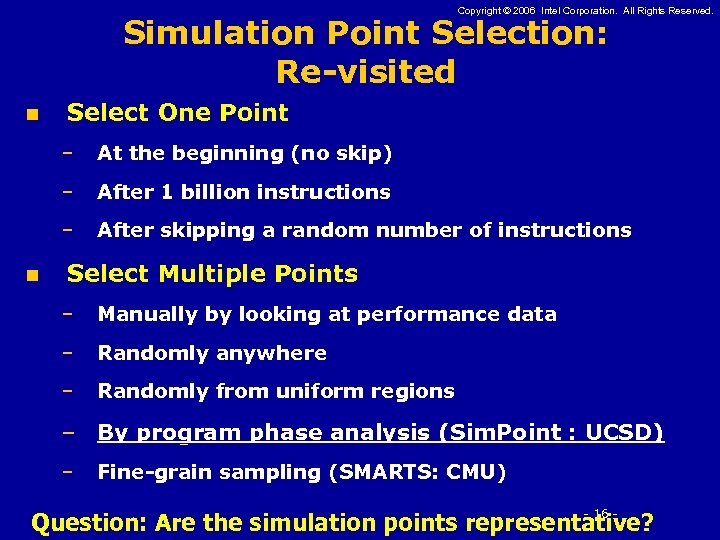 Copyright © 2006 Intel Corporation. All Rights Reserved. Simulation Point Selection: Re-visited n Select One Point – – After 1 billion instructions – n At the beginning (no skip) After skipping a random number of instructions Select Multiple Points – Manually by looking at performance data – Randomly anywhere – Randomly from uniform regions – By program phase analysis (Sim. Point : UCSD) – Fine-grain sampling (SMARTS: CMU) - 16 - Question: Are the simulation points representative?
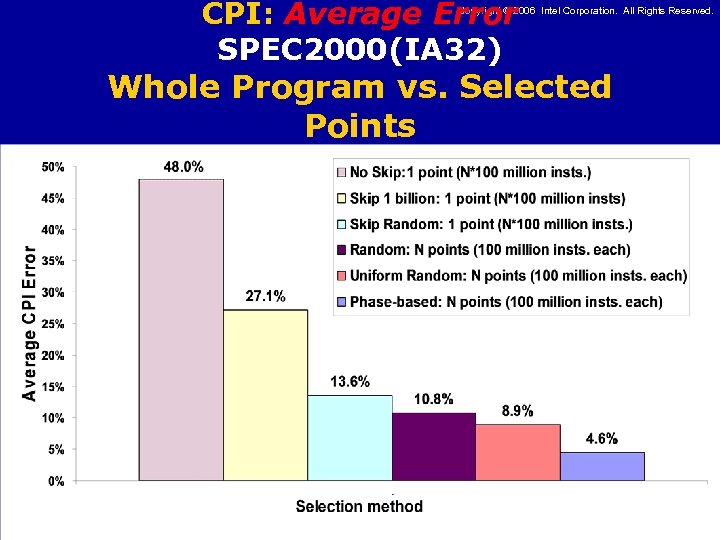 CPI: Average Error SPEC 2000(IA 32) Copyright © 2006 Intel Corporation. All Rights Reserved. Whole Program vs. Selected Points - 17 -
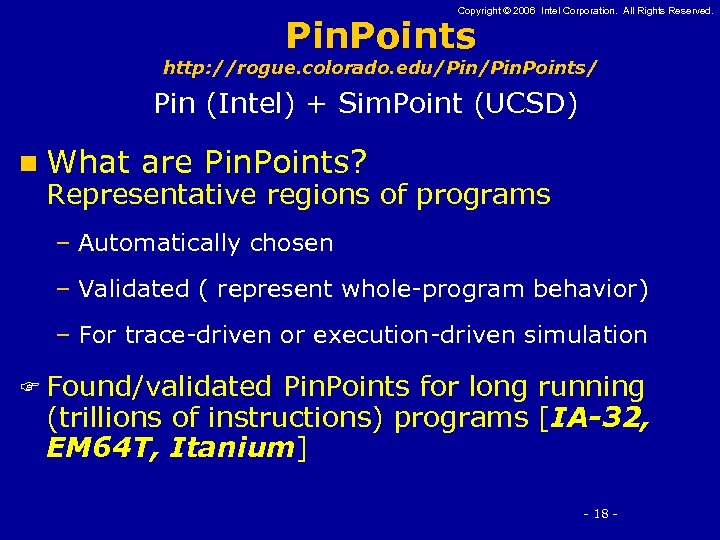 Copyright © 2006 Intel Corporation. All Rights Reserved. Pin. Points http: //rogue. colorado. edu/Pin. Points/ Pin (Intel) + Sim. Point (UCSD) n What are Pin. Points? Representative regions of programs – Automatically chosen – Validated ( represent whole-program behavior) – For trace-driven or execution-driven simulation F Found/validated Pin. Points for long running (trillions of instructions) programs [IA-32, EM 64 T, Itanium] - 18 -
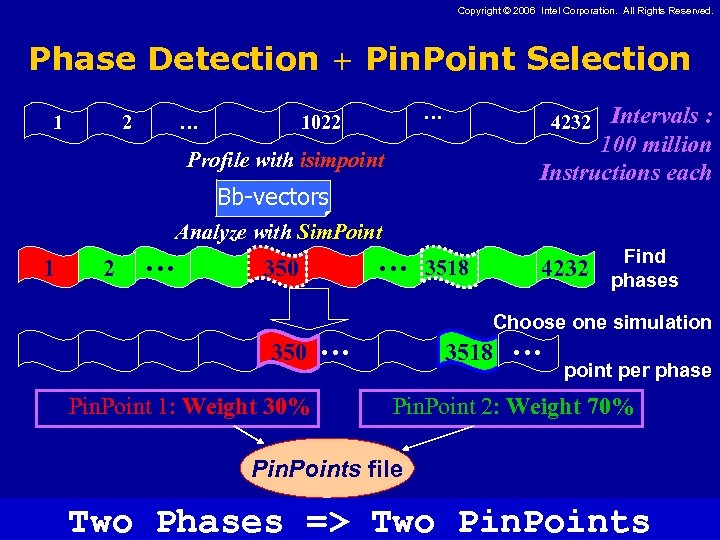 Copyright © 2006 Intel Corporation. All Rights Reserved. Phase Detection + Pin. Point Selection 1 2 … Intervals : 100 million Instructions each … 1022 4232 Profile with isimpoint Bb-vectors Analyze with Sim. Point 1 2 … … 350 Pin. Point 1: Weight 30% 4232 3518 Find phases Choose one simulation … 3518 … point per phase Pin. Point 2: Weight 70% Pin. Points file Two Phases => Two Pin. Points - 19 -
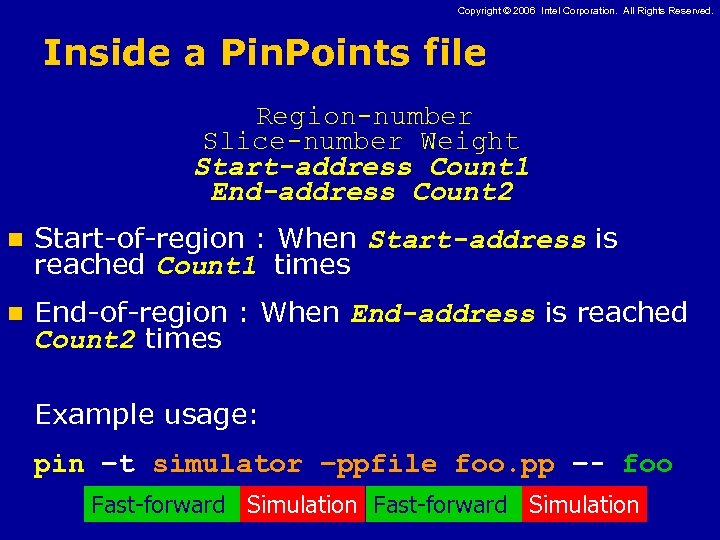 Copyright © 2006 Intel Corporation. All Rights Reserved. Inside a Pin. Points file Region-number Slice-number Weight Start-address Count 1 End-address Count 2 n Start-of-region : When Start-address is reached Count 1 times n End-of-region : When End-address is reached Count 2 times Example usage: pin –t simulator –ppfile foo. pp –- foo Fast-forward Simulation - 20 -
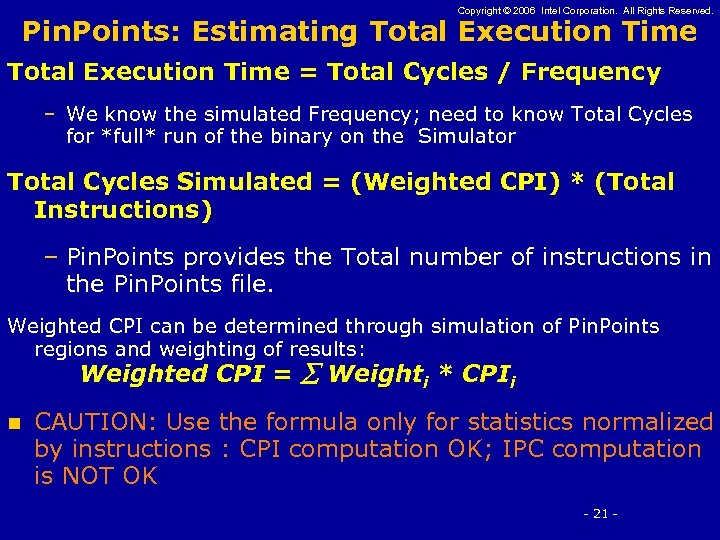 Copyright © 2006 Intel Corporation. All Rights Reserved. Pin. Points: Estimating Total Execution Time = Total Cycles / Frequency – We know the simulated Frequency; need to know Total Cycles for *full* run of the binary on the Simulator Total Cycles Simulated = (Weighted CPI) * (Total Instructions) – Pin. Points provides the Total number of instructions in the Pin. Points file. Weighted CPI can be determined through simulation of Pin. Points regions and weighting of results: Weighted CPI = Weighti * CPIi n CAUTION: Use the formula only for statistics normalized by instructions : CPI computation OK; IPC computation is NOT OK - 21 -
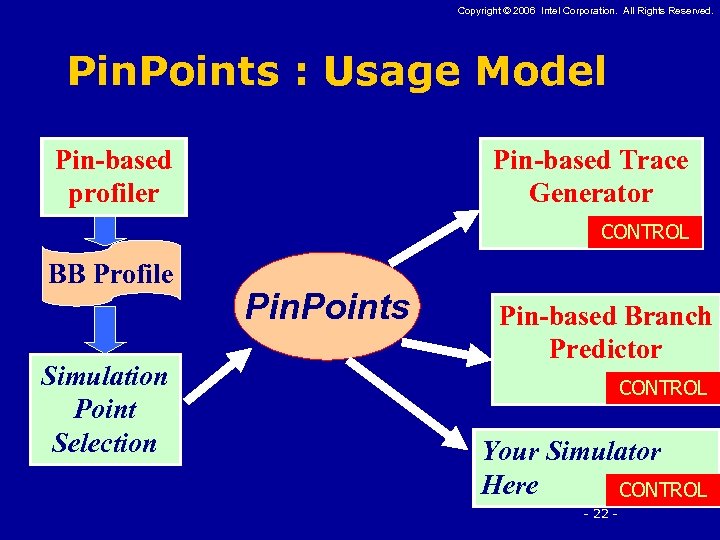 Copyright © 2006 Intel Corporation. All Rights Reserved. Pin. Points : Usage Model Pin-based profiler Pin-based Trace Generator CONTROL BB Profile Simulation Point Selection Pin. Points Pin-based Branch Predictor CONTROL Your Simulator Here CONTROL - 22 -
 A Case Study: Pin + Simple. Scalar. x 86
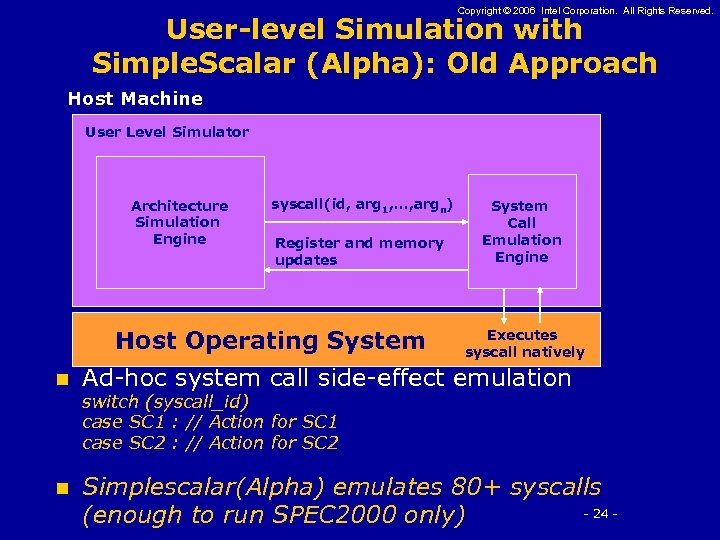 Copyright © 2006 Intel Corporation. All Rights Reserved. User-level Simulation with Simple. Scalar (Alpha): Old Approach Host Machine User Level Simulator Architecture Simulation Engine syscall(id, arg 1, …, argn) Register and memory updates Host Operating System Call Emulation Engine Executes syscall natively n Ad-hoc system call side-effect emulation n Simplescalar(Alpha) emulates 80+ syscalls - 24 (enough to run SPEC 2000 only) switch (syscall_id) case SC 1 : // Action for SC 1 case SC 2 : // Action for SC 2
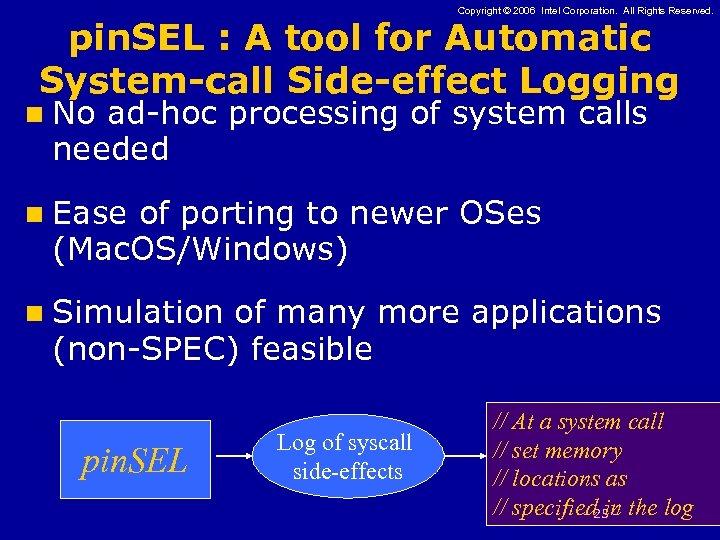 Copyright © 2006 Intel Corporation. All Rights Reserved. pin. SEL : A tool for Automatic System-call Side-effect Logging n No ad-hoc processing of system calls needed n Ease of porting to newer OSes (Mac. OS/Windows) n Simulation of many more applications (non-SPEC) feasible pin. SEL Log of syscall side-effects // At a system call // set memory // locations as // specified 25 in the log -
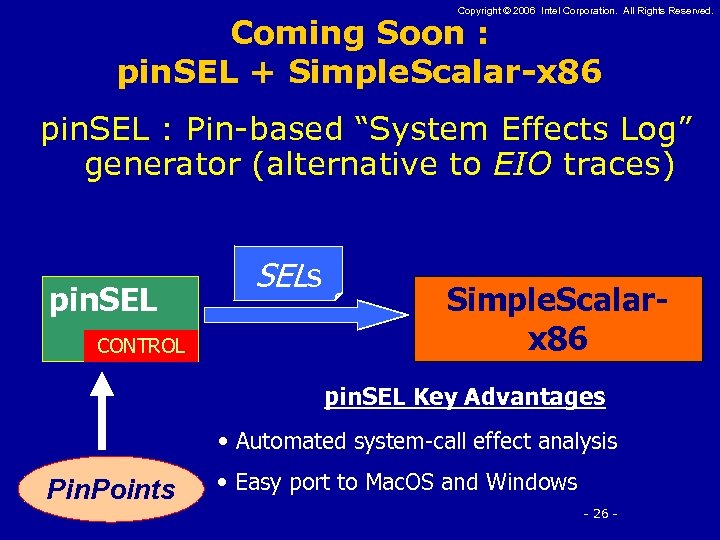 Copyright © 2006 Intel Corporation. All Rights Reserved. Coming Soon : pin. SEL + Simple. Scalar-x 86 pin. SEL : Pin-based “System Effects Log” generator (alternative to EIO traces) pin. SEL CONTROL SELs Simple. Scalarx 86 pin. SEL Key Advantages • Automated system-call effect analysis Pin. Points • Easy port to Mac. OS and Windows - 26 -
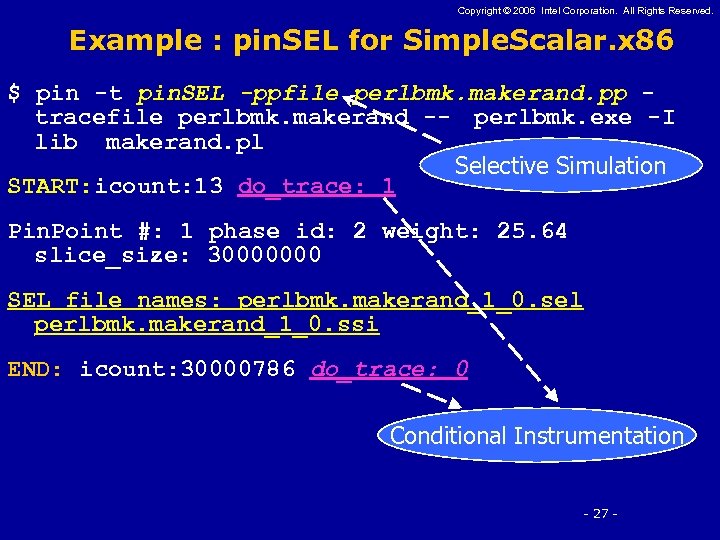 Copyright © 2006 Intel Corporation. All Rights Reserved. Example : pin. SEL for Simple. Scalar. x 86 $ pin -t pin. SEL -ppfile perlbmk. makerand. pp tracefile perlbmk. makerand -- perlbmk. exe -I lib makerand. pl Selective Simulation START: icount: 13 do_trace: 1 Pin. Point #: 1 phase id: 2 weight: 25. 64 slice_size: 30000000 SEL file names: perlbmk. makerand_1_0. sel perlbmk. makerand_1_0. ssi END: icount: 30000786 do_trace: 0 Conditional Instrumentation - 27 -
 Copyright © 2006 Intel Corporation. All Rights Reserved. Summary Techniques for speeding up Pin-based simulation 1. Be selective : choose simulation regions 2. Instrument conditionally : Only in “regions of interest” Coming Soon [ from UCSD] : pin. SEL + Simple. Scalar-x 86 - 28 -
 Copyright © 2006 Intel Corporation. All Rights Reserved. Resources n Pin Manual: Instrumentation Library: Library for common instrumentation tasks Controller : Identify start and stop points for instrumentation n Pin. Points: Harish Patil, Robert Cohn, Mark Charney, Rajiv Kapoor, Andrew Sun, and Anand Karunanidhi. “Pinpointing Representative Portions of Large Intel Itanium Programs with Dynamic Instrumentation” MICRO-37(2004) n pin. SEL: Satish Narayanasamy, Cristiano Pereira, Harish Patil, Robert Cohn, and Brad Calder. “Automatic Logging of Operating System Effects to Guide Application-Level Architecture Simulation” SIGMETRICS’ 06 - 29 -


