Copyright © 2004 South-Western/Thomson Learning 22 Thinking Like





sesssion1_thinking_like_an_economist.ppt
- Размер: 1.6 Mегабайта
- Количество слайдов: 29
Описание презентации Copyright © 2004 South-Western/Thomson Learning 22 Thinking Like по слайдам
 Copyright © 2004 South-Western/Thomson Learning 22 Thinking Like an Economist
 Copyright © 2004 South-Western/Thomson Learning. Thinking Like an Economist • Every field of study has its own terminology • Mathematics • integrals axioms vector spaces • Psychology • ego id cognitive dissonance • Law • promissory estoppel torts venues • Economics • supply opportunity cost elasticity consumer surplus demand comparative advantage deadweight loss
 Copyright © 2004 South-Western/Thomson Learning. Thinking Like an Economist • Economics trains you to. . • Think in terms of alternatives. • Evaluate the cost of individual and social choices. • Examine and understand how certain events and issues are related.
 Copyright © 2004 South-Western/Thomson Learning. THE ECONOMIST AS A SCIENTIST • The economic way of thinking. . . • Involves thinking analytically and objectively. • Makes use of the scientific method.
 Copyright © 2004 South-Western/Thomson Learning. The Scientific Method: Observation, Theory, and More Observation • Uses abstract models to help explain how a complex, real world operates. • Develops theories, collects, and analyzes data to evaluate theories.
 Copyright © 2004 South-Western/Thomson Learning. The Role of Assumptions • Economists make assumptions in order to make the world easier to understand. • The art in scientific thinking is deciding which assumptions to make. • Economists use different assumptions to answer different questions.
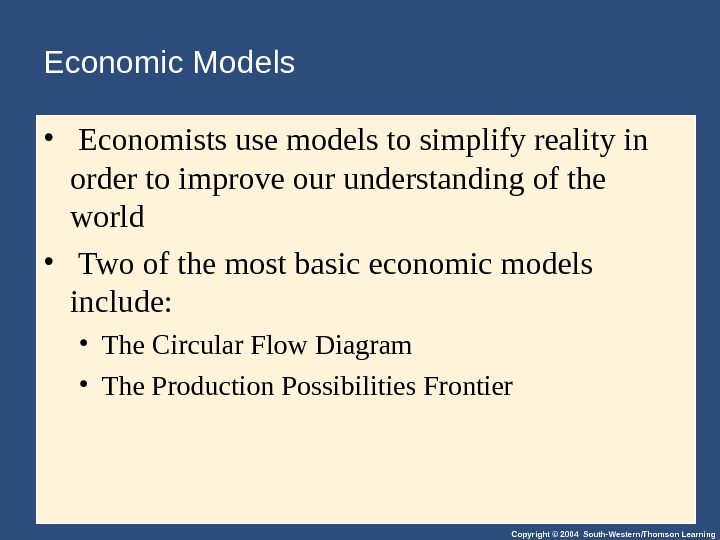
 Copyright © 2004 South-Western/Thomson Learning. Economic Models • Economists use models to simplify reality in order to improve our understanding of the world • Two of the most basic economic models include: • The Circular Flow Diagram • The Production Possibilities Frontier
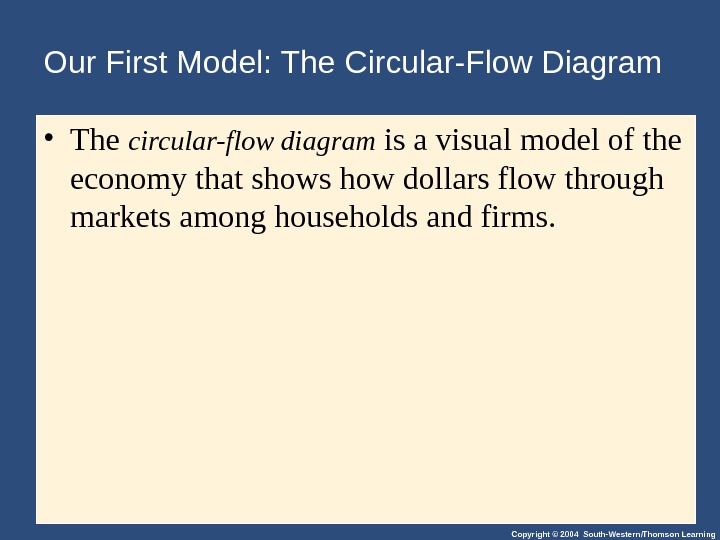
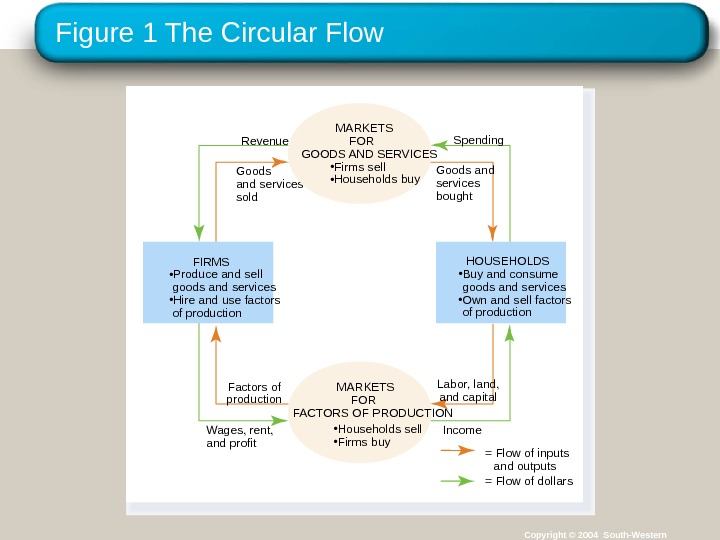
 Copyright © 2004 South-Western/Thomson Learning. Our First Model: The Circular-Flow Diagram • The circular-flow diagram is a visual model of the economy that shows how dollars flow through markets among households and firms.
 Figure 1 The Circular Flow Copyright © 2004 South-Western. Spending Goods and services bought. Revenue Goods and services sold Labor, land, and capital Income = Flow of inputs and outputs = Flow of dollars. Factors of production Wages, rent, and profit FIRMS • Produce and sell goods and services • Hire and use factors of production • Buy and consume goods and services • Own and sell factors of production HOUSEHOLDS • Households sell • Firms buy. MARKETS FOR FACTORS OF PRODUCTION • Firms sell • Households buy MARKETS FOR GOODS AND SERVICES
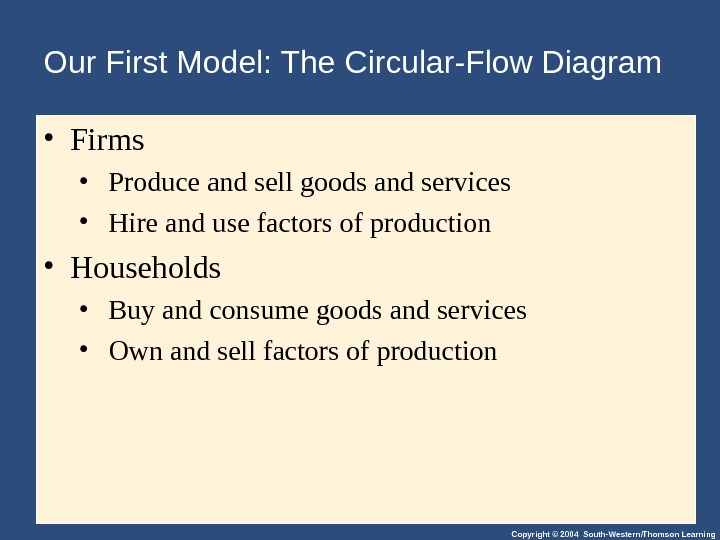
 Copyright © 2004 South-Western/Thomson Learning. Our First Model: The Circular-Flow Diagram • Firms • Produce and sell goods and services • Hire and use factors of production • Households • Buy and consume goods and services • Own and sell factors of production
 Copyright © 2004 South-Western/Thomson Learning. Our First Model: The Circular-Flow Diagram • Markets for Goods and Services • Firms sell • Households buy • Markets for Factors of Production • Households sell • Firms buy
 Copyright © 2004 South-Western/Thomson Learning. Our First Model: The Circular-Flow Diagram • Factors of Production • Inputs used to produce goods and services • Land, labor, and capital
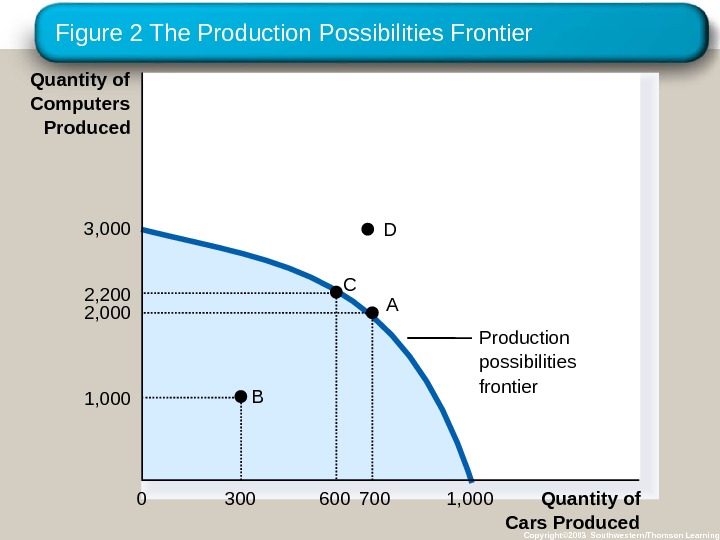
 Copyright © 2004 South-Western/Thomson Learning. Our Second Model: The Production Possibilities Frontier • The production possibilities frontier is a graph that shows the combinations of output that the economy can possibly produce given the available factors of production and the available production technology.
 Figure 2 The Production Possibilities Frontier Copyright© 2003 Southwestern/Thomson Learning. Production possibilities frontier. A B C Quantity of Cars Produced 2, 200 6001, 000 3000 7002, 0003, 000 1, 000 Quantity of Computers Produced
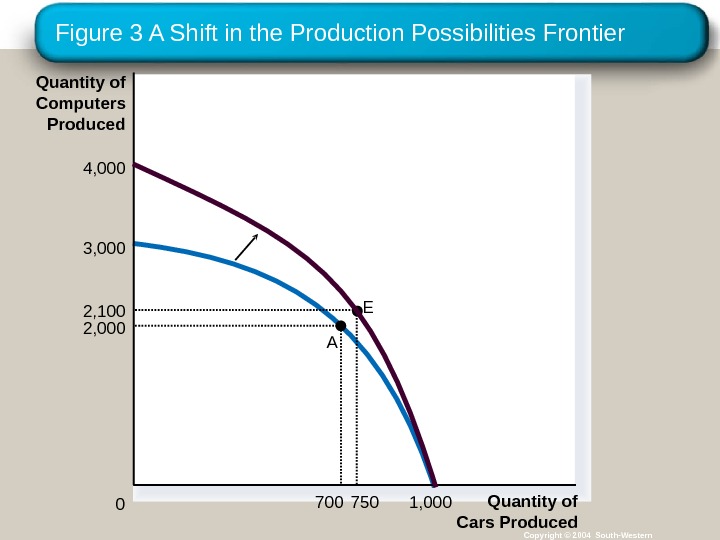
 Copyright © 2004 South-Western/Thomson Learning. Our Second Model: The Production Possibilities Frontier • Concepts Illustrated by the Production Possibilities Frontier • Efficiency • Tradeoffs • Opportunity Cost • Economic Growth
 Figure 3 A Shift in the Production Possibilities Frontier Copyright © 2004 South-Western. E Quantity of Cars Produced 2, 000 7002, 100 750 04, 000 3, 000 1, 000 Quantity of Computers Produced
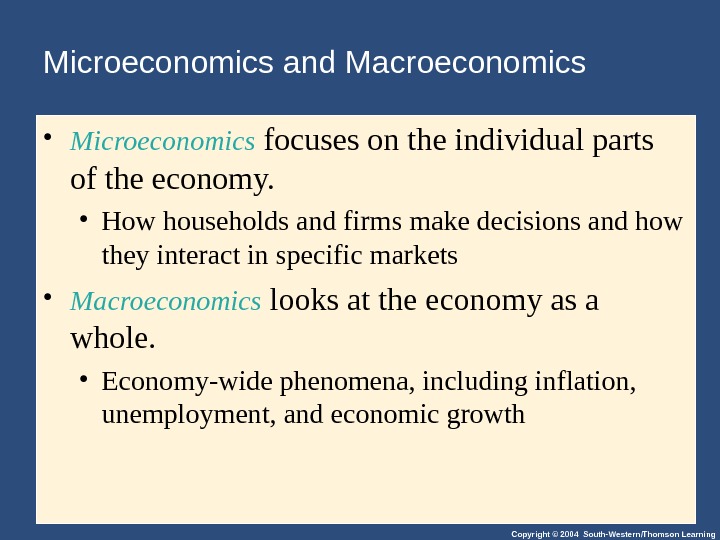
 Copyright © 2004 South-Western/Thomson Learning. Microeconomics and Macroeconomics • Microeconomics focuses on the individual parts of the economy. • How households and firms make decisions and how they interact in specific markets • Macroeconomics looks at the economy as a whole. • Economy-wide phenomena, including inflation, unemployment, and economic growth
 Copyright © 2004 South-Western/Thomson Learning. THE ECONOMIST AS POLICY ADVISOR • When economists are trying to explain the world, they are scientists. • When economists are trying to change the world, they are policy advisor.
 Copyright © 2004 South-Western/Thomson Learning. POSITIVE VERSUS NORMATIVE ANALYSIS • Positive statements are statements that attempt to describe the world as it is. • Called descriptive analysis • Normative statements are statements about how the world should be. • Called prescriptive analysis
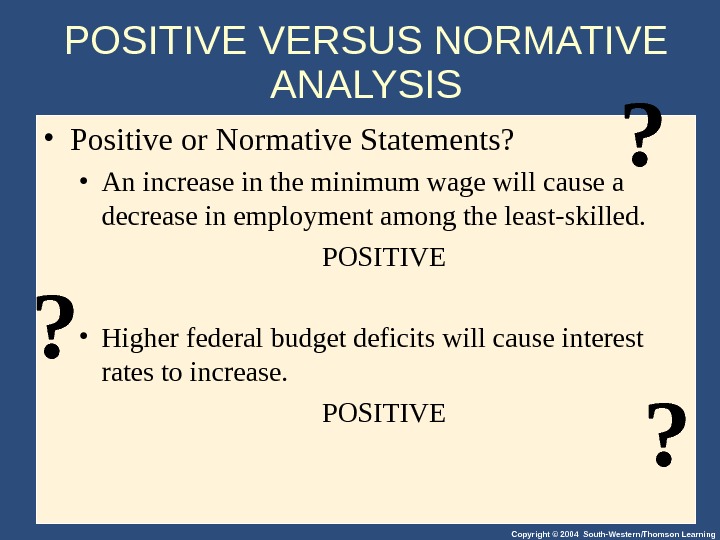
 Copyright © 2004 South-Western/Thomson Learning • Positive or Normative Statements? • An increase in the minimum wage will cause a decrease in employment among the least-skilled. POSITIVE • Higher federal budget deficits will cause interest rates to increase. POSITIVE? ? POSITIVE VERSUS NORMATIVE ANALYSIS ?
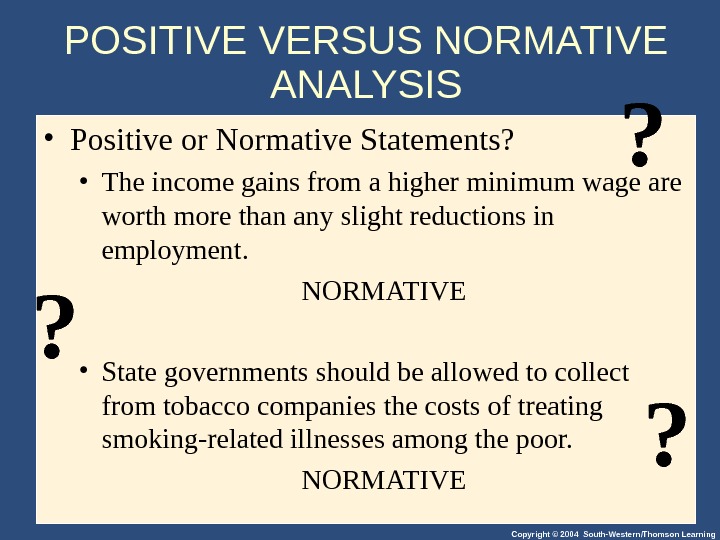
 Copyright © 2004 South-Western/Thomson Learning • Positive or Normative Statements? • The income gains from a higher minimum wage are worth more than any slight reductions in employment. NORMATIVE • State governments should be allowed to collect from tobacco companies the costs of treating smoking-related illnesses among the poor. NORMATIVE? ? POSITIVE VERSUS NORMATIVE ANALYSIS ?
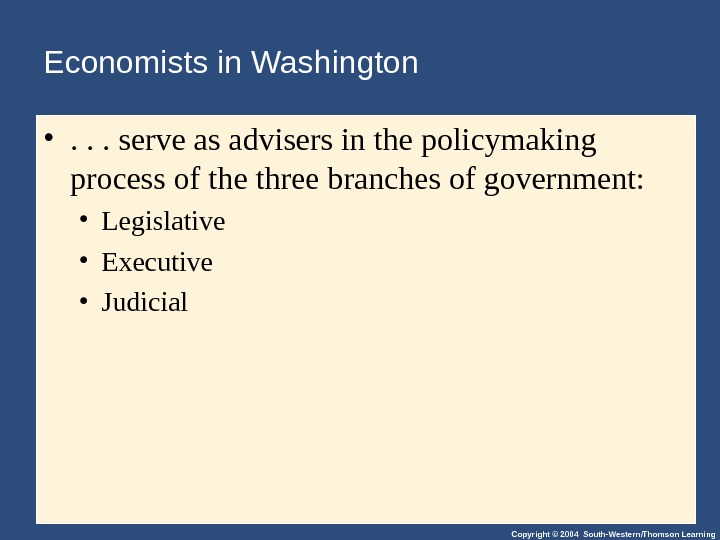
 Copyright © 2004 South-Western/Thomson Learning. Economists in Washington • . . . serve as advisers in the policymaking process of the three branches of government: • Legislative • Executive • Judicial
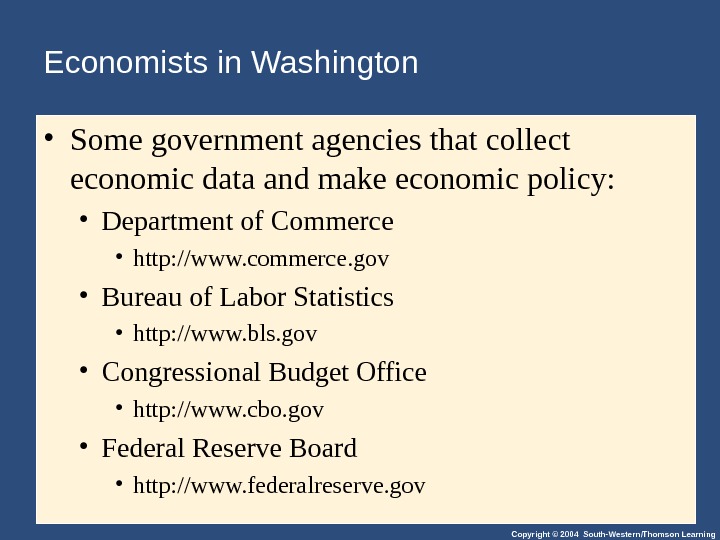
 Copyright © 2004 South-Western/Thomson Learning. Economists in Washington • Some government agencies that collect economic data and make economic policy: • Department of Commerce • http: //www. commerce. gov • Bureau of Labor Statistics • http: //www. bls. gov • Congressional Budget Office • http: //www. cbo. gov • Federal Reserve Board • http: //www. federalreserve. gov
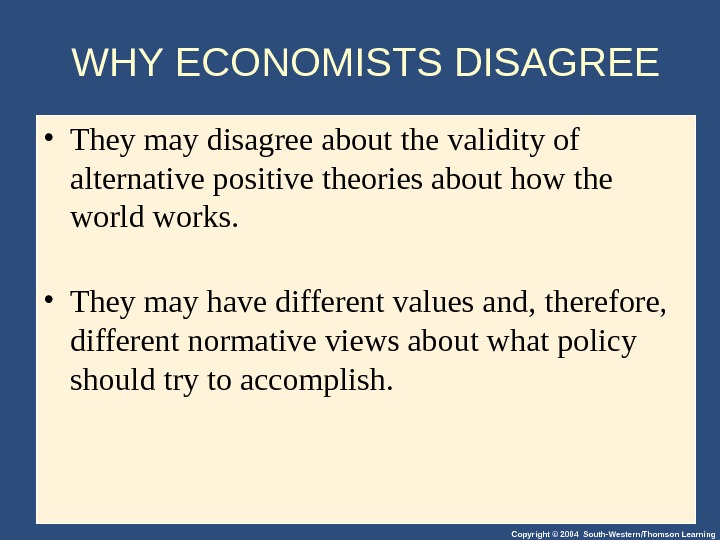
 Copyright © 2004 South-Western/Thomson Learning. WHY ECONOMISTS DISAGREE • They may disagree about the validity of alternative positive theories about how the world works. • They may have different values and, therefore, different normative views about what policy should try to accomplish.
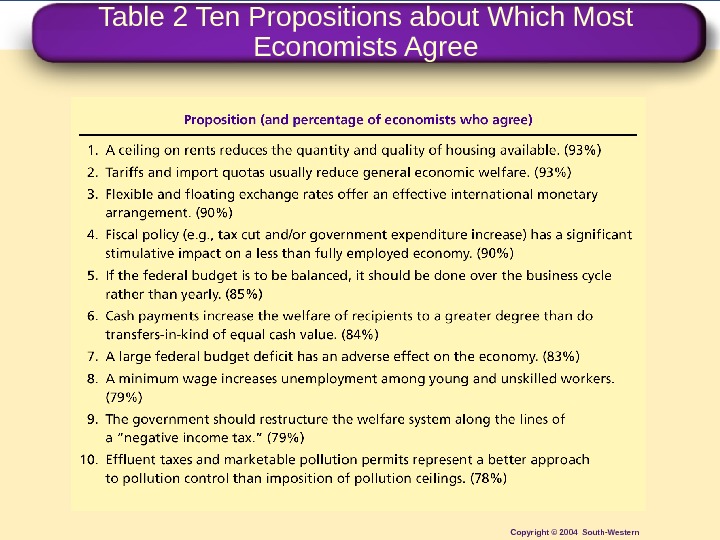
 Table 2 Ten Propositions about Which Most Economists Agree Copyright © 2004 South-Western
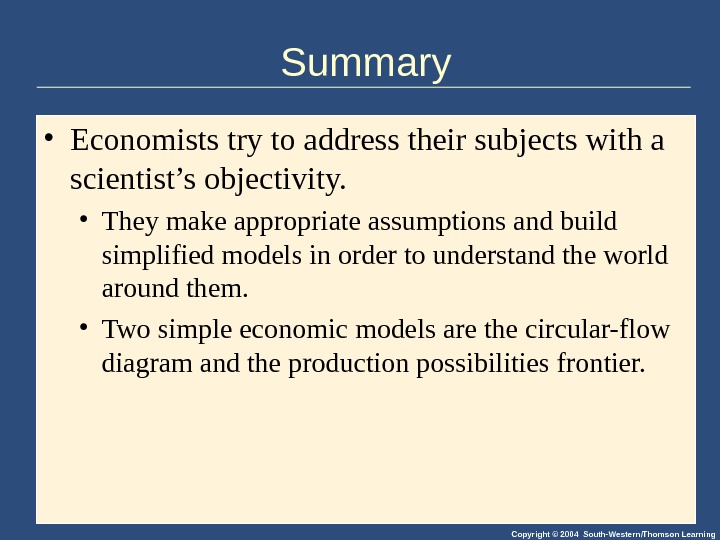
 Copyright © 2004 South-Western/Thomson Learning. Summary • Economists try to address their subjects with a scientist’s objectivity. • They make appropriate assumptions and build simplified models in order to understand the world around them. • Two simple economic models are the circular-flow diagram and the production possibilities frontier.
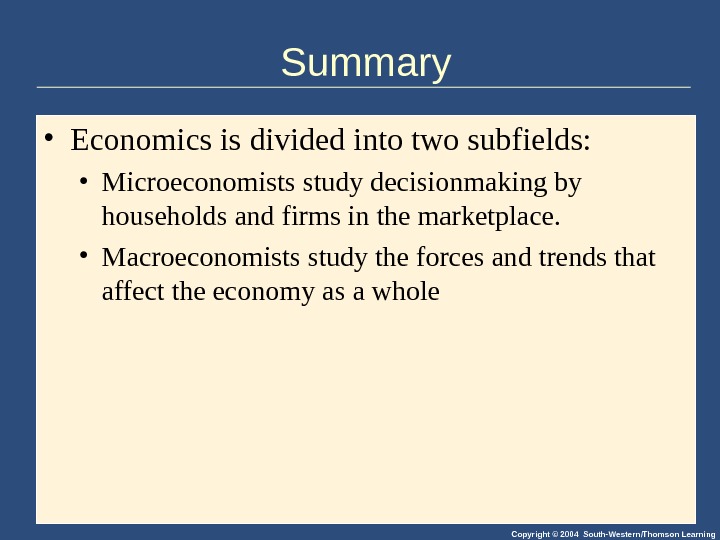
 Copyright © 2004 South-Western/Thomson Learning. Summary • Economics is divided into two subfields: • Microeconomists study decisionmaking by households and firms in the marketplace. • Macroeconomists study the forces and trends that affect the economy as a whole
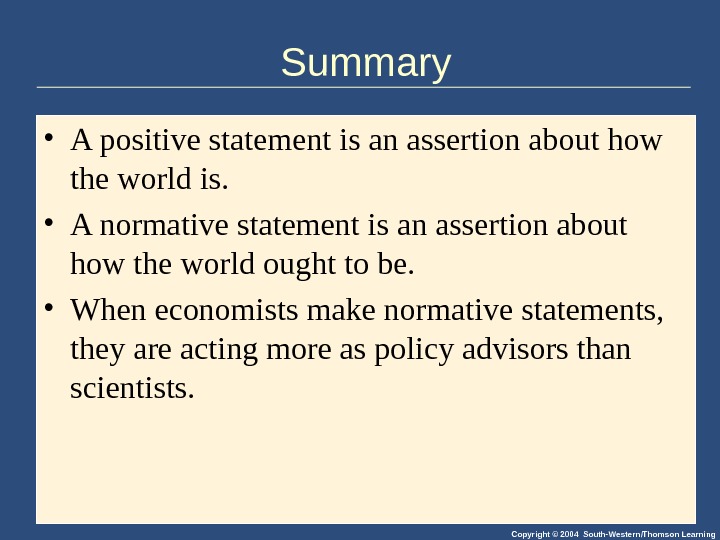
 Copyright © 2004 South-Western/Thomson Learning. Summary • A positive statement is an assertion about how the world is. • A normative statement is an assertion about how the world ought to be. • When economists make normative statements, they are acting more as policy advisors than scientists.
 Copyright © 2004 South-Western/Thomson Learning. Summary • Economists who advise policymakers offer conflicting advice either because of differences in scientific judgments or because of differences in values. • At other times, economists are united in the advice they offer, but policymakers may choose to ignore it.

