fe1b02da52d5ed5a0d0738017980a942.ppt
- Количество слайдов: 36
 Copyright © 2002 VERITAS Software Corporation. All Rights Reserved. VERITAS, VERITAS Software, the VERITAS logo, and all other VERITAS product names and slogans are trademarks or registered trademarks of VERITAS Software Corporation in the US and/or other countries. Other product names and/or slogans mentioned herein may be trademarks or registered trademarks of their respective companies.
 Speaker Name Speaker Title VERITAS Software
 Ora. Perf. com: Real Life Performance Data
 History of Ora. Perf. com • • • Started in December 1998, in the basement Cable modem introduction Redhat Linux 2 CPU (366 Mhz Celeron, over clocked) Based on YAPP Initially supported only Utlbstat/Utlestat
 YAPP • Ora. Perf. com is based on YAPP • YAPP = Yet Another Performance Profiling Methodology • Developed in 1996 as reaction to the Check list/Ratio tuning • Solved a real (large) customer performance problem, and they still use it today.
 Time based tuning (or taking a Holistic") So what is YAPP? • Basically (Response) Time based tuning (or taking a Holistic View of your system) • R=C+W – R = (Response) Time – C = CPU/Service Time – W = Wait Time • The basic idea is to look at all the time that is spent inside the database.
So what is YAPP? • Basically (Response) Time based tuning (or taking a Holistic View of your system) • R=C+W – R = (Response) Time – C = CPU/Service Time – W = Wait Time • The basic idea is to look at all the time that is spent inside the database.
 So what is YAPP? • Checklist tuning is basically going down your list of ratios: – Buffer cache hit ratio – Latch miss ratio – Parse/execute ratio, etc. • Ratios should never be used as the starting point of your tuning process! • And what are good percentages for your ratios?
 Oracle Buffer Cache Hit Ratio • Use the expert guidelines: – > 94 – 97% in Oracle Applications (Source: Oracle) – > 80% (UNIX files) or > 90% (raw devices) (Source: Oracle) – > 95% online day and > 85% batch (Source: Gurry & Corrigan) – > 99. 99999% (Source: Richard Niemic) • So even the experts don’t agree!
 End User focus • End users complain about – Response time problems – Throughput problems • These should be used as the starting point of your tuning process, not a bad ratio
 Improving TCO • Another reason for starting the tuning process can be to reduce the Total Cost of Owner ship of a system – End users are happy, but can we provide the same performance/functionality with less? • Ratios can never help here. • Looking at where you spend your time, you can
 Why Utlbstat/utlestat? • Run utlbstat and some time later utlestat to produce a file called report. txt • Shipped with Oracle Release – utl. Bstat – Begin Statistics – utl. Estat – End Statistics • Many DBAs use this to monitor their database(s) • But …. – Don’t know how to interpret report. txt
 Problems with Utlbstat/Utlestat • • Create/drop tables Doesn’t support OPS/RAC Only Instance statistics Not all interesting statistics are collected and reported
 Interesting stats that are missing • For Example: – SQL statements • • • Buffer gets Disk reads Parse calls Executes Version count – Enqueue stats – Detailed latch statistics
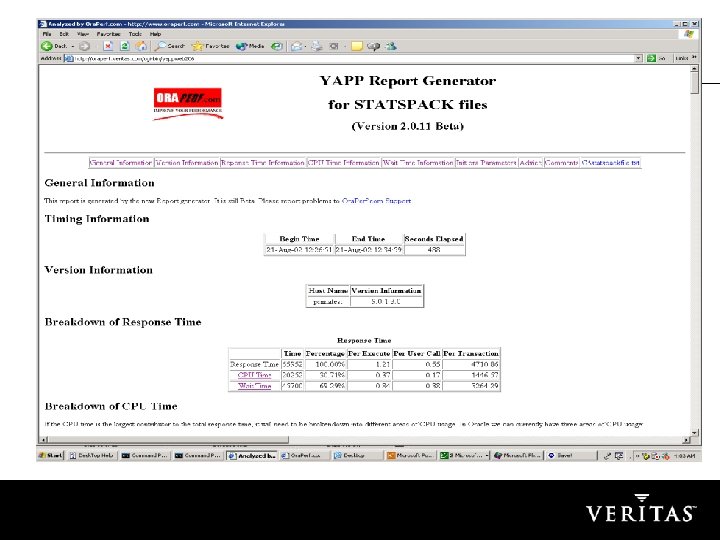
 STATSPACK since 8. 1. 6 • Much better than utlbstat/utlestat, but requires a bit more administration. • The report/file generated contains much more info, but like report. txt it is difficult to read (file can be large) • So lets sign up with Ora. Perf. com and have the file analyzed.
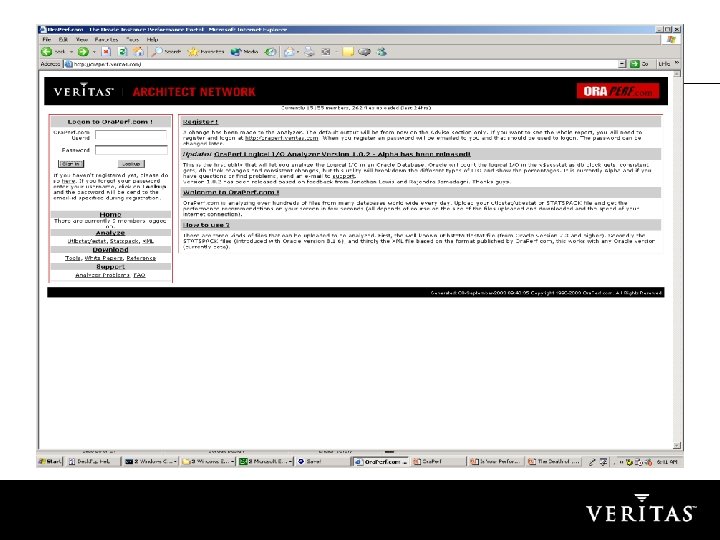
 Ora. Perf Logon or Register and then logon. After login on, you will enter your personal workspace.
 Ora. Perf Click on the BROWSE button to start browsing for the file that you want to upload. Then click on OPEN.
 button. One") Ora. Perf If the file has been located, hit the UPLOAD FILE(S) button. One can take the default settings of the form, but incase the file is not recognized set the file type (“check file type”) or the version of STATSPACK that is used (not the RDBMS version).
Ora. Perf If the file has been located, hit the UPLOAD FILE(S) button. One can take the default settings of the form, but incase the file is not recognized set the file type (“check file type”) or the version of STATSPACK that is used (not the RDBMS version).
 Oracle Versions Uploaded
 Is STATSPACK getting popular?
 Common Problems • Different databases and versions have the symptoms/problems: – Too many logical I/O – Slow physical I/O – Locking and Latching problems • Why? There must be a common cause – Problem/limitations in Oracle kernel? – Oracle documentation not good (enough)? – Oracle books and courses not good (enough)?
 Symptom: Too many Logical I/O • Logical I/O or buffer get • Relation between logical I/O and CPU usage • Buffer cache hit ratio – (1 – (physical reads/(db buffer gets + consistent gets)) • Too many logical I/O will give a good buffer cache hit ratio • Reduce number of executes or logical I/O’s per execute • High logical I/O count means normally inefficient SQL
 From DUAL • Many selects from DUAL – CURVAL, NEXTVAL from SEQUENCES – PL/SQL related functions – SYSDATE • Interesting constructs – … where rownum = 1
 Symptom 2: Too Slow Physical I/O • Disk capacity increases rapidly • Number of random I/O operations doesn’t increase as quickly • Full seek time is biggest component • Prices of disks keep dropping • Disk Array with large Cache
 Symptom 2: Too Slow Physical I/O • More cost effective to buy large disks • So database size roughly decides the number of disks needed • OLTP databases should be sized based on the number of reads/writes per transaction • Total number of reads + writes will decide the number of disks needed
 Symptom 2: Too Slow Physical I/O • Heavily accessed data files should be striped over enough disks • Caching data is important, but where – Oracle buffer cache – File System buffer cache – Disk array cache
 Average Read Time • Single block I/O – Average – Maximum 1 -10 msec 500 msec • Multi block I/O – Average – Maximum 1 -50 msec 500+ msec • Direct Path I/O – Average – Maximum 1 -50 msec 500+ msec
 Symptom 3: Latch • Synchronization means – Latch contention – Enqueue contention • Always a symptom • SLEEPS column in V$LATCH indication of contention • Generally Oracle will sleep 1 centi second • Faster CPU means that we spend a lot of time waiting • So either don’t spin at all or spin more
 Symptom 3: Latch contention • Every logical I/O will result in a latch operation • Cache buffer chain latch get – So many latch ‘gets’ and ‘sleeps’ on this • Latch could be a symptom of too many buffer gets (logical I/Os) – Symptom of inefficient SQL
 Symptom 3: Latch contention • For Example Symptom of – Hard parsing (not sharing SQL) – Soft parsing (re-parsing the same SQL statements over and over again) • Session_cached_cursors init. ora parameter – Too many Logical I/Os • Hard parsing – Cursor_sharing init. ora parameter (> 8. 1. 5) – Exact, force, similar
 Symptom 3: Enqueue contention • Sequence problems – SQ enqueue – Need to increase cache size or check for sequences with order option • High water mark problems – HW enqueue – Add free lists to the object
 Ora. Perf. com now part VAN! • Veritas Architect Network – The Online Community for IT Professionals • Faster and more reliable access • Current members can still use Ora. Perf. com – Only logon information will be used by Veritas. • New members sign up under the VERITAS online Privacy Policy and Terms of Use. • http: //oraperf. veritas. com • Checkout Veritas Indepth for Oracle, for better Application Tuning. Ora. Perf is basically high level instance tuning.
 & QUESTIONS ANSWERS