
Cooper-Eromanga Basin Exploration Potential Team


section_8_final_student_example_form_2006.ppt
- Размер: 18.6 Mегабайта
- Количество слайдов: 93
Описание презентации Cooper-Eromanga Basin Exploration Potential Team по слайдам
Cooper-Eromanga Basin Exploration Potential Team Members Fyne Ade-Amadi Samantha Large Mark Mahadeo Paul Whipp Barrel Award, March 2006 Imperial College London
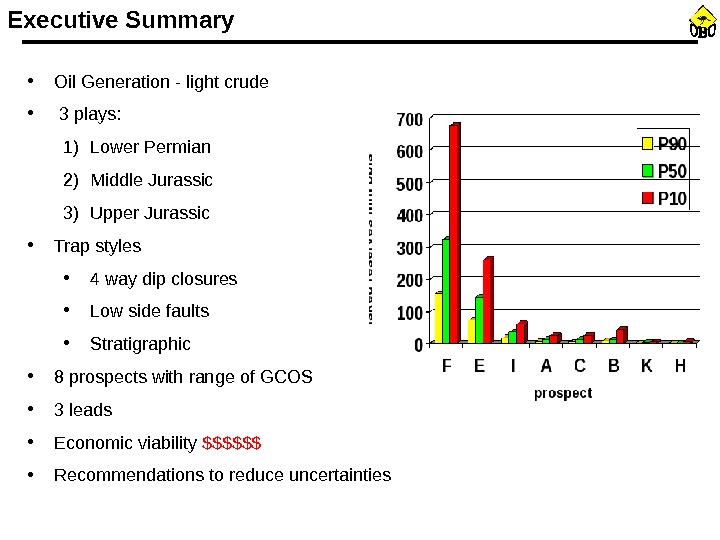
Executive Summary • Oil Generation — light crude • 3 plays: 1) Lower Permian 2) Middle Jurassic 3) Upper Jurassic • Trap styles • 4 way dip closures • Low side faults • Stratigraphic • 8 prospects with range of GCOS • 3 leads • Economic viability $$$$$$ • Recommendations to reduce uncertainties
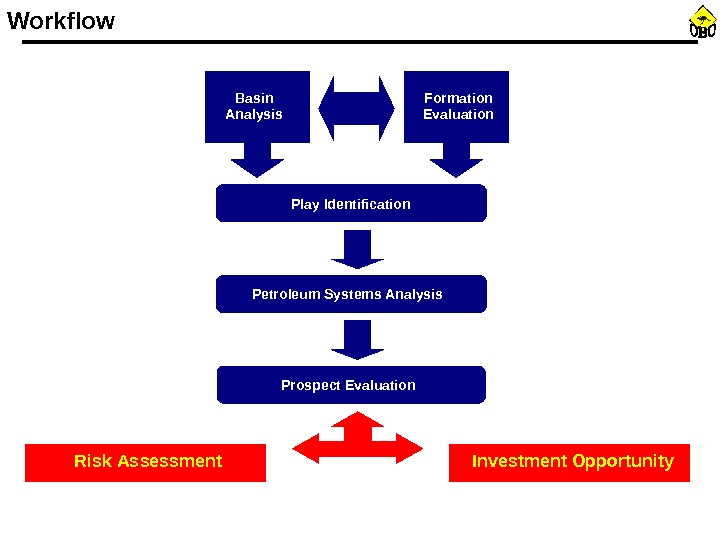
Workflow Risk Assessment Play Identification. Basin Analysis Formation Evaluation Petroleum Systems Analysis Prospect Evaluation Investment Opportunity
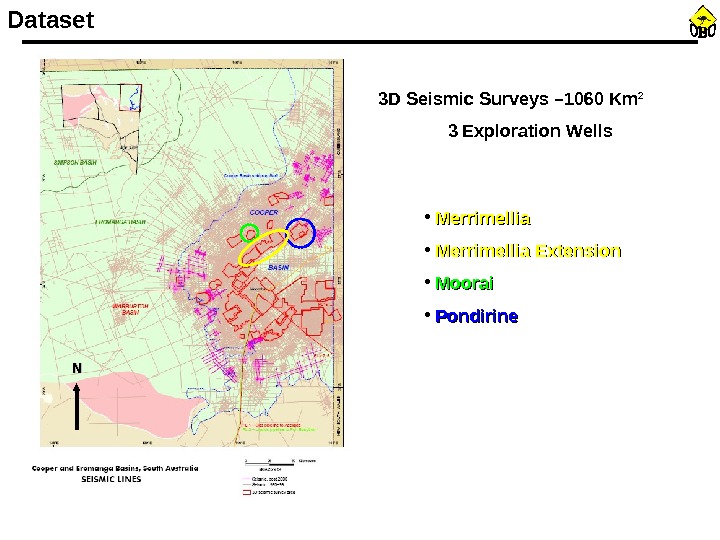
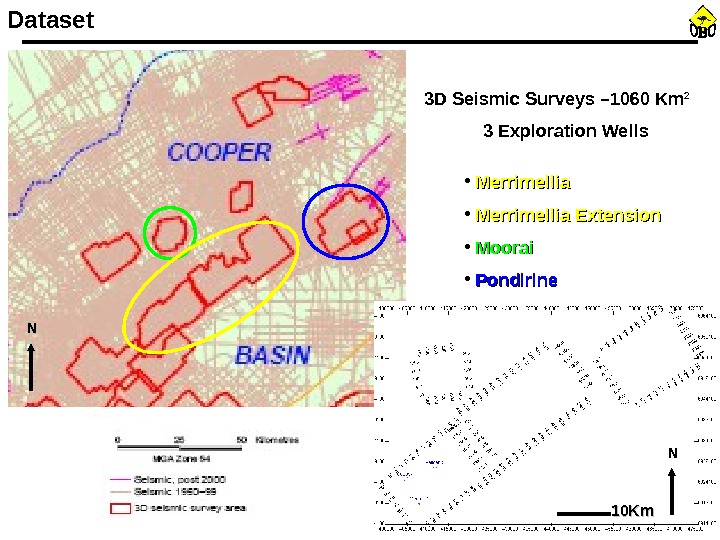
Dataset 3 D Seismic Surveys – 1060 Km 2 3 Exploration Wells • Merrimellia Extension • Moorai • Pondirine NN
Dataset 3 D Seismic Surveys – 1060 Km 2 3 Exploration Wells • Merrimellia Extension • Moorai • Pondirine NN NN 10 Km
• Introduction • Seismic Interpretation • Formation Evaluation • Petroleum Systems Analysis • Play Identification • Prospect Evaluation & Risk • Economic Assessment • Conclusion. Presentation Outline
• Introduction • Seismic Interpretation • Formation Evaluation • Petroleum Systems Analysis • Play Identification • Prospect Evaluation & Risk • Economic Assessment • Conclusion. Cooper-Eromanga Exploration Potential
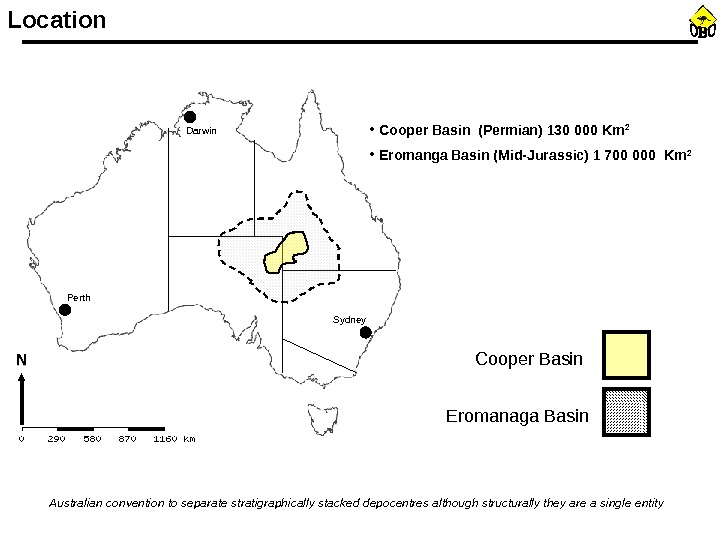
Location Eromanaga Basin NN Cooper Basin. Perth Darwin Sydney • Cooper Basin (Permian) 130 000 Km 2 • Eromanga Basin (Mid-Jurassic) 1 700 000 Km 2 Australian convention to separate stratigraphically stacked depocentres although structurally they are a single entity
Paleogeography Cooper Basin (Late Carboniferous – Permian) extensional- transtensional basin Eromanga (Mid-Jurassic) ‘sag’ basin Major tectonism along the eastern margin of Australia during the development of the Tasman Fold belt caused the transfer of compressional stresses into the intraplate setting, resulting in major folding and faulting along NW-NE linements
Geodynamics Summary • Intracontinental Basin – ‘mildly compressional’ since Tertiary • Complex polyphase history – punctuated periods of active tectonism & quiescence between the Paleozoic and Cenozoic • Inextricably linked to the tectonic evolution of Australasia — structural form of the successive basins is strongly influenced by the underlying structural grain (Gravestock et al. , 1998)
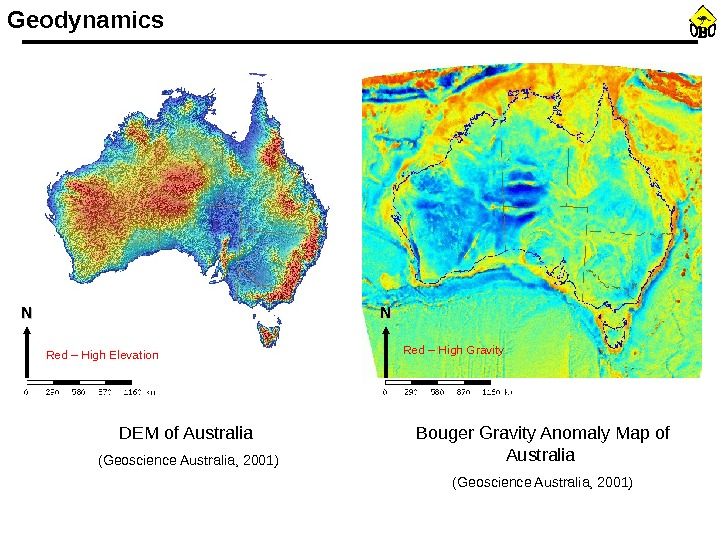
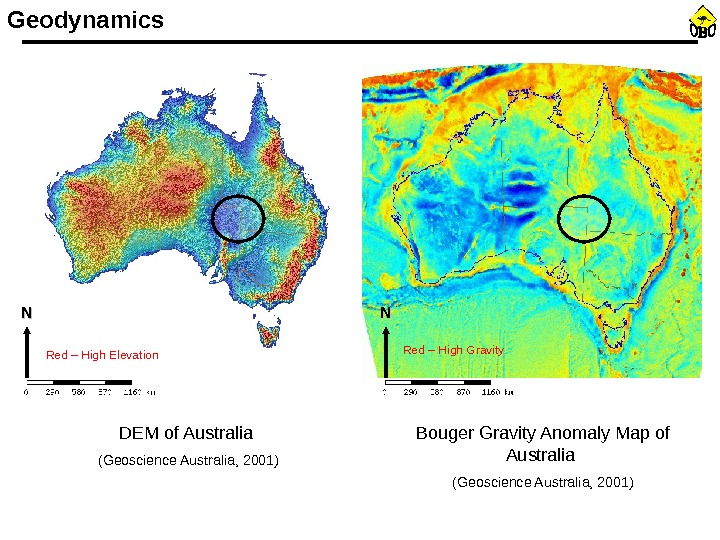
Geodynamics DEM of Australia (Geoscience Australia, 2001)NN NN Bouger Gravity Anomaly Map of Australia (Geoscience Australia, 2001)Red – High Elevation Red – High Gravity
Geodynamics DEM of Australia (Geoscience Australia, 2001)NN NN Bouger Gravity Anomaly Map of Australia (Geoscience Australia, 2001)Red – High Elevation Red – High Gravity
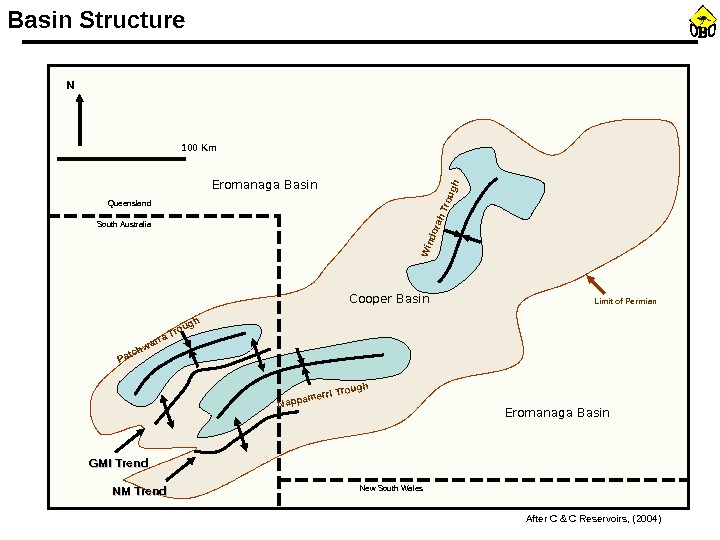
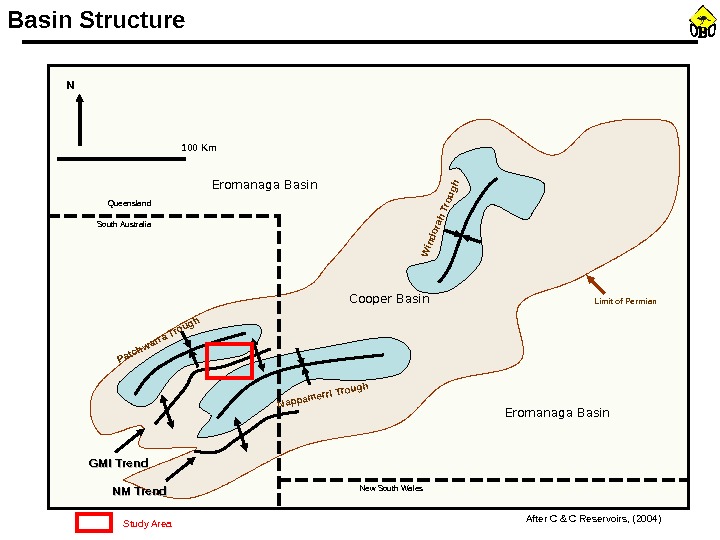
Cooper Basin. NN 100 Km Queensland South Australia New South Wales Eromanaga Basin. Windorah Trough. Basin Structure After C & C Reservoirs, (2004) Limit of Permian. Eromanaga Basin Patchwarra Trough Nappamerri Trough GMI Trend NM Trend
Basin Structure After C & C Reservoirs, (2004)Cooper Basin. NN 100 Km Queensland South Australia New South Wales Eromanaga Basin. Windorah Trough Limit of Permian. Eromanaga Basin Patchwarra Trough Nappamerri Trough GMI Trend Study Area. NM Trend
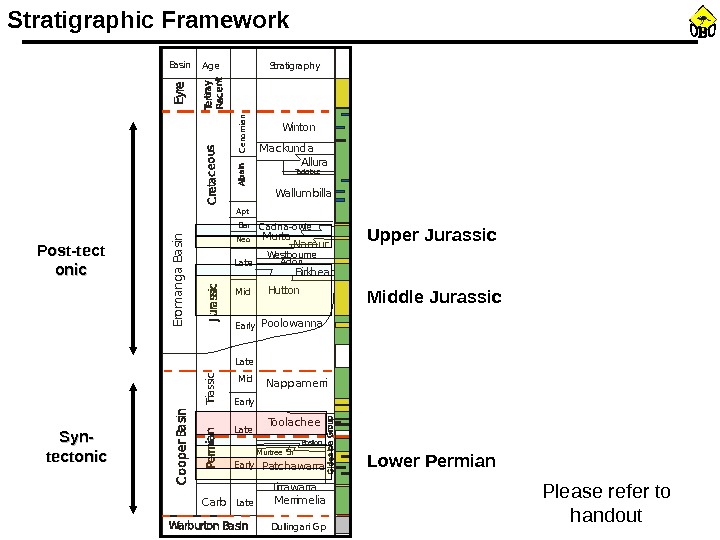
Stratigraphic Framework Please refer to handout. Basin Age Stratigraphy Depositional Enviironment Structural Episode. Erom anga Basin Triassic Carb Late Mid Early Winton Mackunda Allura Toolabuc Wallumbilla Cenomian Apt Bar Neo Namur. Murta. C adna-owie Birkhead Hutton. Westbourne Adori Poolowanna Nappamerri Toolachee Epsilon Murtree Sh Patc hawarra Tirrawarra Merrimelia Glac io-fluvia l. Fluvio- lac ustrine Fluvio- d eltaic Lac ustrine. Fluvio-d eltaic — la c ustrine Fluvio-d eltaic Fluvial. Fluvio-lac ustrine Fluvial Bra ided fluvial. Fluvio-lac ustrine Lac ustrine Deltaic. Shallow — ope n ma rine. Marginal marine. Fluvial — la c sutrine Pa ralic Epierogenic struc tural episode Loc a l Up lift Tec tonic episod e 2 Tec tonic episode 1 Daraling ie event Dullingari Gp Uplift and c ompression. C ompression Rifting. Lower Permian. Middle Jurassic. Upper Jurassic Post-tect onic Syn- tectonic
• Introduction • Seismic Interpretation • Formation Evaluation • Petroleum Systems Analysis • Play Identification • Prospect Evaluation & Risk • Economic Assessment • Conclusion. Cooper-Eromanga Exploration Potential
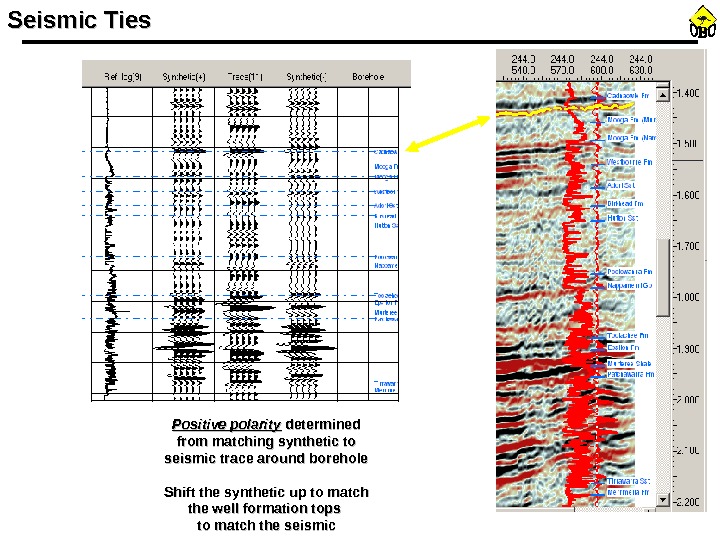
Seismic Ties Positive polarity determined from matching synthetic to seismic trace around borehole Shift the synthetic up to match the well formation tops to match the seismic
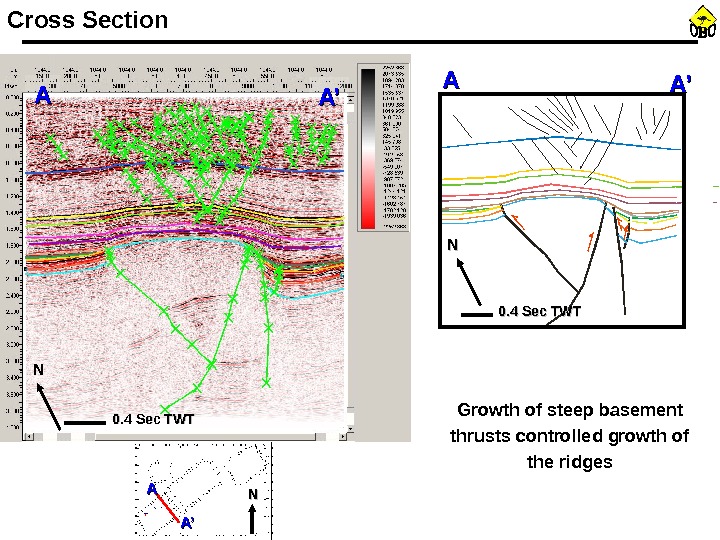
Cross Section Growth of steep basement thrusts controlled growth of the ridges A’A’AA NN 0. 4 Sec TWT NNAA A’A’NN 0. 4 Sec TWTAA A’A’
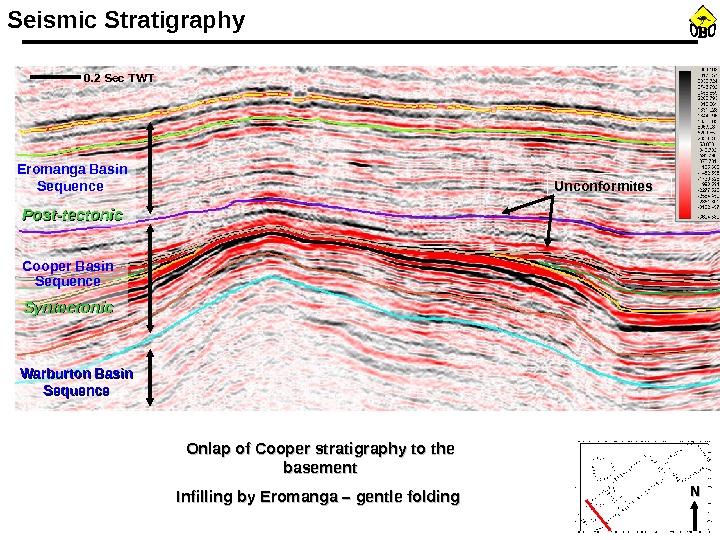
Seismic Stratigraphy Onlap of Cooper stratigraphy to the basement Infilling by Eromanga – gentle folding NNWarburton Basin Sequence. Cooper Basin Sequence Syntectonic. Eromanga Basin Sequence Post-tectonic 0. 2 Sec TWT Unconformites
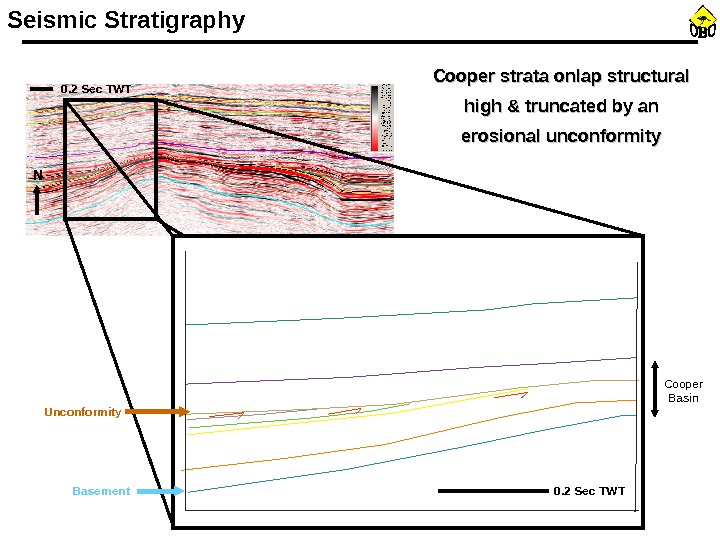
Seismic Stratigraphy 0. 2 Sec TWT NN Basement. Unconformity 0. 2 Sec TWTCooper strata onlap structural high & truncated by an erosional unconformity Cooper Basin
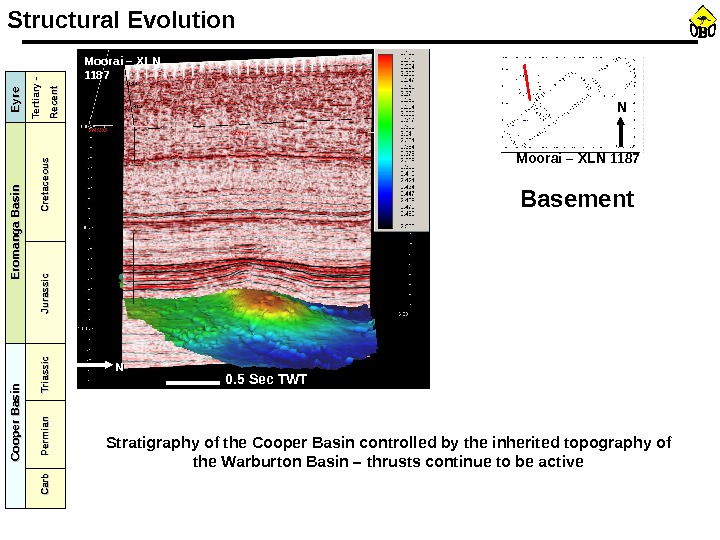
NN Basement. Structural Evolution 0. 5 Sec TWTMoorai – XLN 1187 Stratigraphy of the Cooper Basin controlled by the inherited topography of the Warburton Basin – thrusts continue to be active. Carb Permian Triassic Jurassic Cretaceous Tertiary — Recent Cooper Basin Erom anga Basin Eyre Moorai – XLN 1187 NN
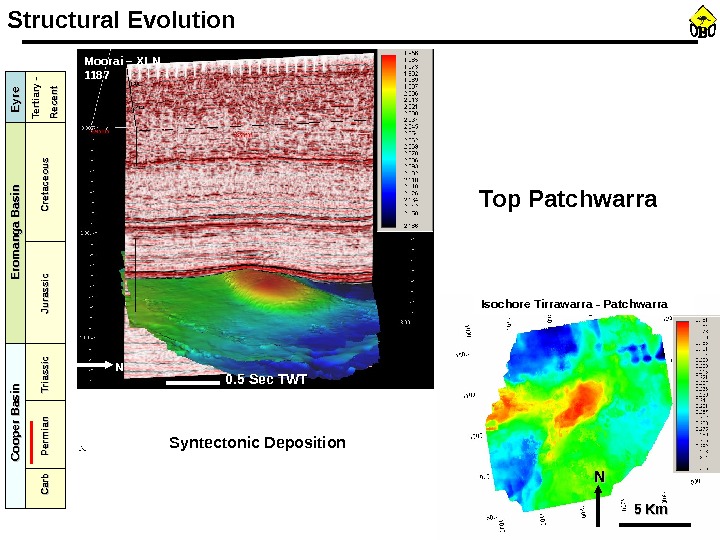
NN NNStructural Evolution 0. 5 Sec TWTMoorai – XLN 1187 Top Patchwarra Syntectonic Deposition. Carb Permian Triassic Jurassic Cretaceous Tertiary — Recent Cooper Basin Erom anga Basin Eyre NN 5 Km. Isochore Tirrawarra — Patchwarra
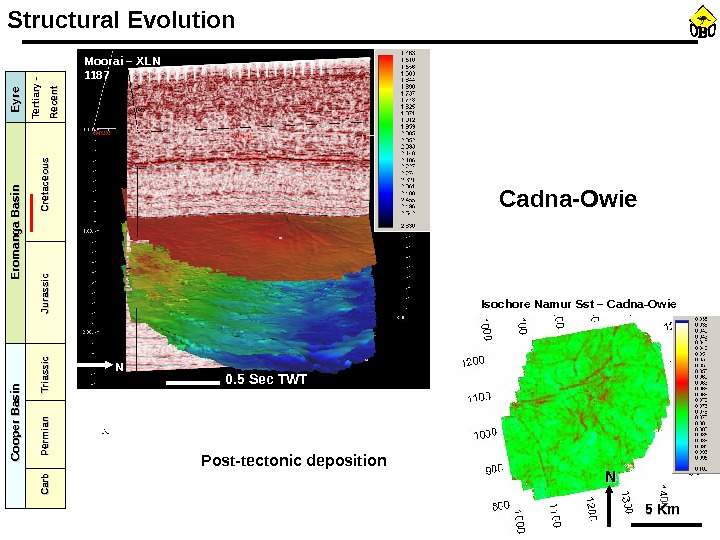
NN NNStructural Evolution 0. 5 Sec TWTMoorai – XLN 1187 Cadna-Owie. Carb Permian Triassic Jurassic Cretaceous Tertiary — Recent Cooper Basin Erom anga Basin Eyre Post-tectonic deposition NN 5 Km. Isochore Namur Sst – Cadna-Owie
NN NN NNStructural Evolution 0. 5 Sec TWTMoorai – XLN 1187 Overlying stratigraphy affected by extension Development of extensive polygonal fault array. Carb Permian Triassic Jurassic Cretaceous Tertiary — Recent Cooper Basin Erom anga Basin Eyre Winton Fm Dip Map – Winton Formation NN 5 Km
• Introduction • Seismic Interpretation • Formation Evaluation • Petroleum Systems Analysis • Play Identification • Prospect Evaluation & Risk • Economic Assessment • Conclusion. Cooper-Eromanga Exploration Potential
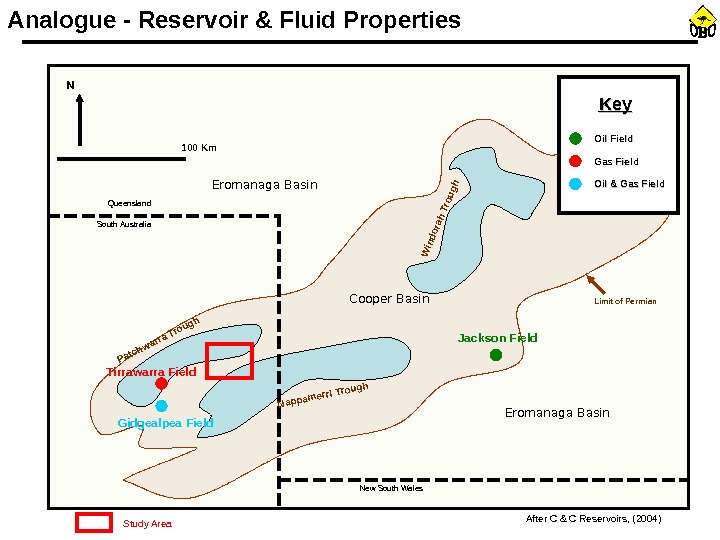
Cooper Basin. NN 100 Km Queensland South Australia New South Wales Eromanaga Basin. Windorah Trough After C & C Reservoirs, (2004) Limit of Permian. Eromanaga Basin Patchwarra Trough Nappamerri Trough Study Area Jackson Field Tirrawarra Field Gidgealpea Field Oil Field Gas Field Oil & Gas Field Key. Analogue — Reservoir & Fluid Properties
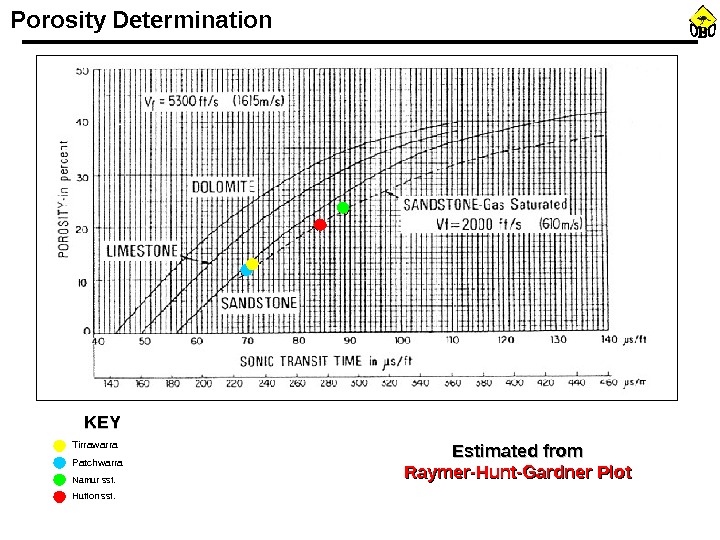
Reservoir Thickness (Ft) N/G (%) Average Porosity (%) Permeability ** S w (%) Fluid Composition ** Rf (%) ** Recovery Mechanism ** Tirrawarra 135 -230 85 -90 11 -15 1 -2 m. D 30 50 -52 API 65 Miscible Gas Injection Patchawarra 850 -1250 35 -40 11 -12 20 m. D 21 -28 N/A 39 -66 Miscible Gas Injection Hutton sst. 580 -690 >90 18 -21 1 D 35 -40 39 -52 API 65 Aquifer Drive Namur sst. 255 -270 ~90 20 >200 m. D 35 -40 N/A 42 -55 N/A ** Data derived from analogue Hydrocarbons — Light Grade Crude Oil & Wet Gas Typical Rf ranges 40 -60 % Normally Pressured Reservoirs. Reservoir & Fluid Properties
Porosity Determination Estimated from Raymer-Hunt-Gardner Plot. KEYKEY Tirrawarra Patchwarra Namur sst. Hutton sst.
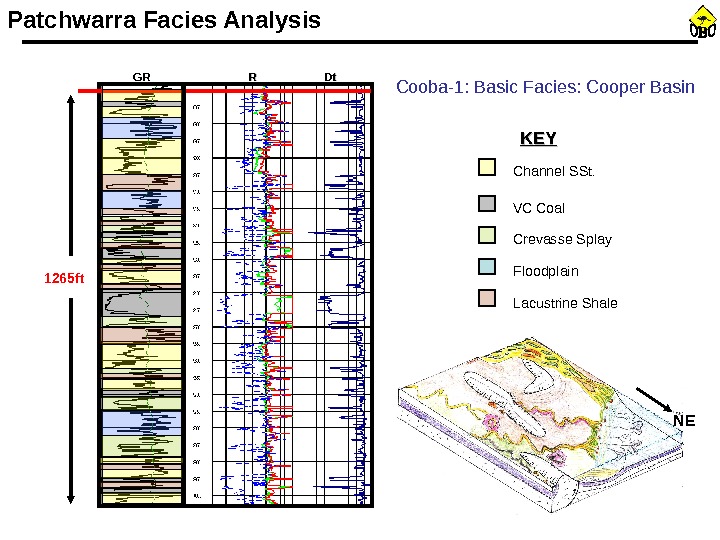
GRGR RR Dt. Dt 1265 ft Channel SSt. VC Coal Crevasse Splay Floodplain Lacustrine Shale KEYKEYCooba-1: Basic Facies: Cooper Basin Patchwarra Facies Analysis N
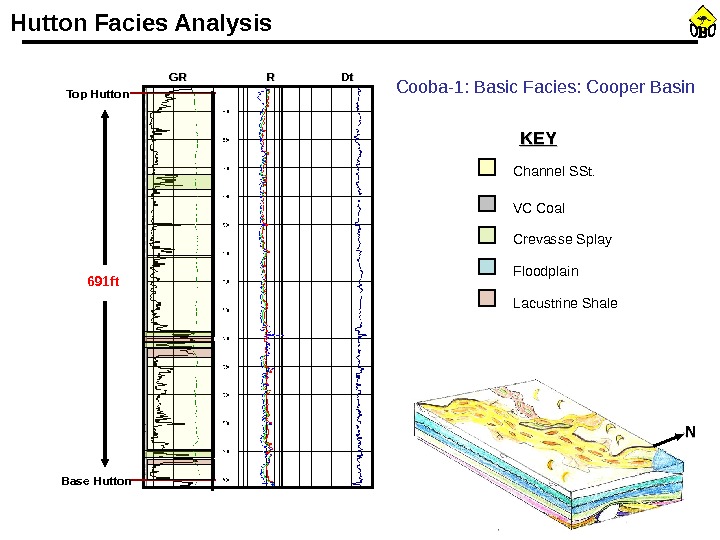
Hutton Facies Analysis Cooba-1: Basic Facies: Cooper Basin Channel SSt. VC Coal Crevasse Splay Floodplain Lacustrine Shale KEYKEYTop Hutton Base Hutton 691 ft GRGR RR Dt. Dt NN
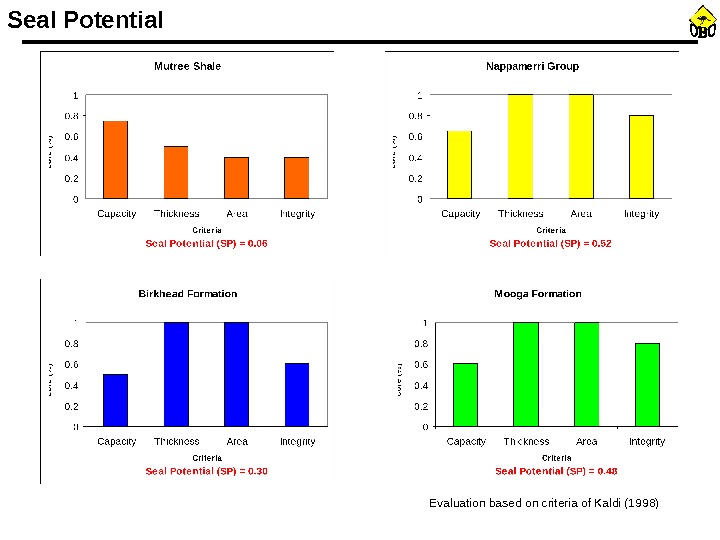
Seal Potential Evaluation based on criteria of Kaldi (1998)
• Introduction • Seismic Interpretation • Formation Evaluation • Petroleum Systems Analysis • Play Identification • Prospect Evaluation & Risk • Economic Assessment • Conclusion. Cooper-Eromanga Exploration Potential
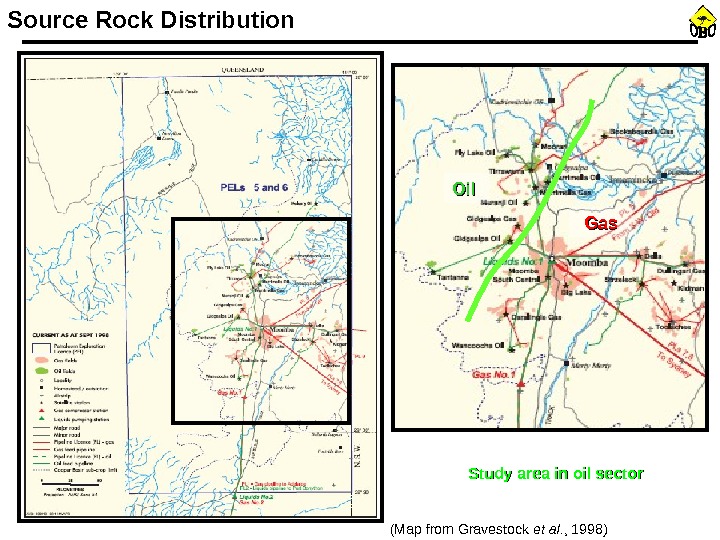
Source Rock Distribution (Map from Gravestock et al. , 1998) • Trend in distribution of Source Rock across the Cooper-Eromanga • Is the structural development linked to source rock distribution? NN
Gas. Oil (Map from Gravestock et al. , 1998)Source Rock Distribution Study area in oil sector
Source Rock Depositional Model (Map from Gravestock et al. , 1998) Type III sources generated from Raised peat mires overlying the Type II sources. Type II source rocks form in lacustrine and marginal swamp settings
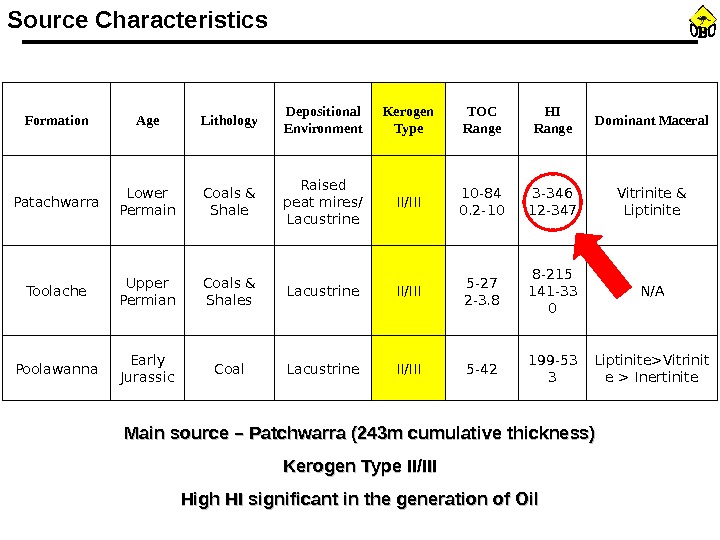
Liptinite>Vitrinit e > Inertinite 199 -53 35 -42 II/IIILacustrine. Coal. Early Jurassic. Poolawanna N/A 8 -215 141 -33 05 -27 2 -3. 8 II/IIILacustrine. Coals & Shales. Upper Permian. Toolache Vitrinite & Liptinite 3 -346 12 -34710 -84 0. 2 -10 II/IIIRaised peat mires/ Lacustrine. Coals & Shale. Lower Permain. Patachwarra Dominant Maceral. HI Range. TOC Range. Kerogen Type. Depositional Environment. Lithology. Age. Formation Main source – Patchwarra (243 m cumulative thickness) Kerogen Type II/III High HI significant in the generation of Oil. Source Characteristics
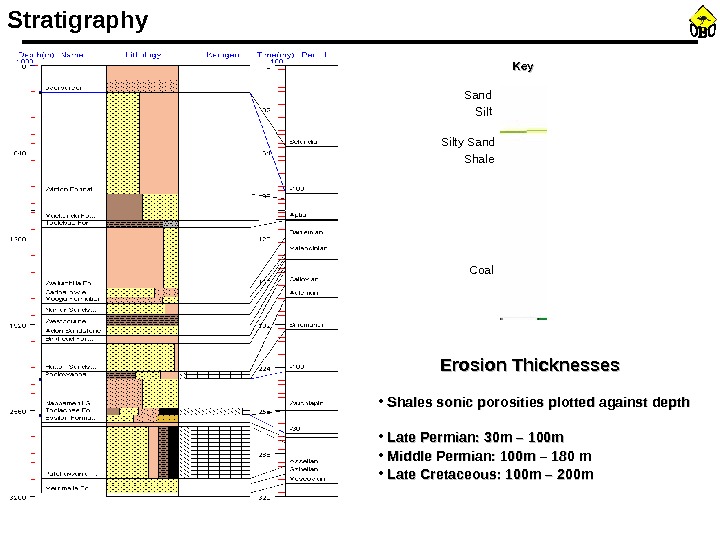
Stratigraphy Key Sand. Silty Sand Shale Coal • Shales sonic porosities plotted against depth • Late Permian: 30 m – 100 m • Middle Permian: 100 m – 180 m • Late Cretaceous: 100 m – 200 m Erosion Thicknesses
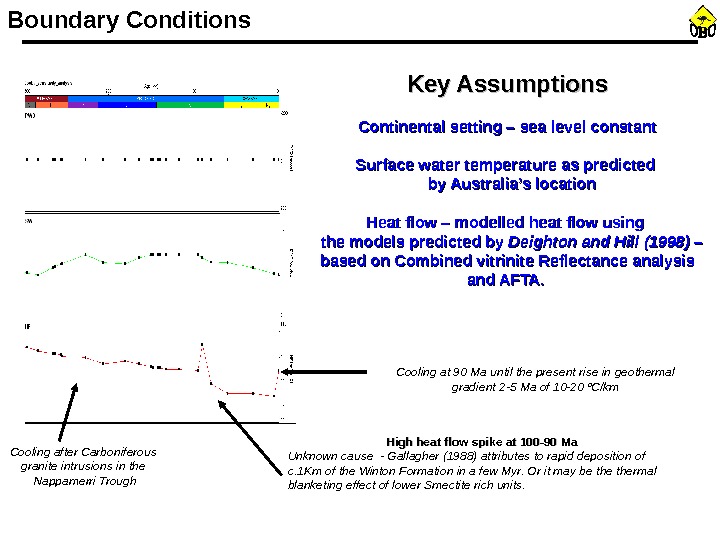
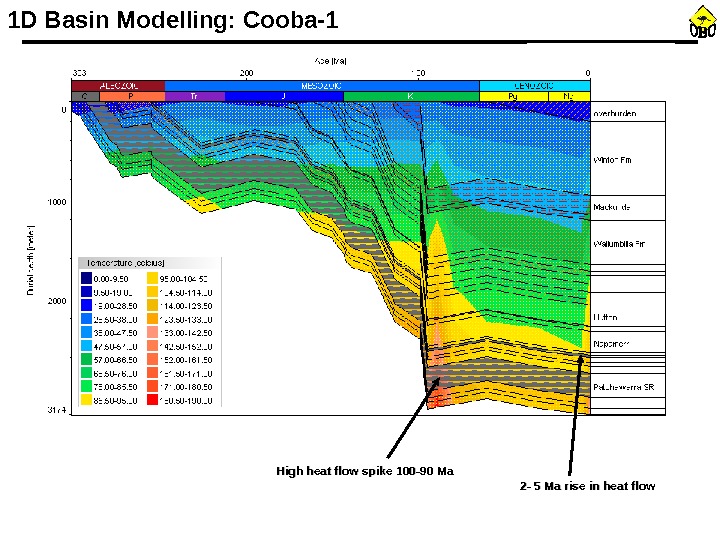
Boundary Conditions Continental setting – sea level constant Surface water temperature as predicted by Australia’s location Heat flow – modelled heat flow using the models predicted by Deighton and Hill (1998) – – based on Combined vitrinite Reflectance analysis and AFTA. High heat flow spike at 100 -90 Ma Unknown cause — Gallagher (1988) attributes to rapid deposition of c. 1 Km of the Winton Formation in a few Myr. Or it may be thermal blanketing effect of lower Smectite rich units. Cooling after Carboniferous granite intrusions in the Nappamerri Trough Cooling at 90 Ma until the present rise in geothermal gradient 2 -5 Ma of 10 -20 o C/km. Key Assumptions
1 D Basin Modelling: Cooba-1 High heat flow spike 100 -90 Ma 2 — 5 Ma rise in heat flow
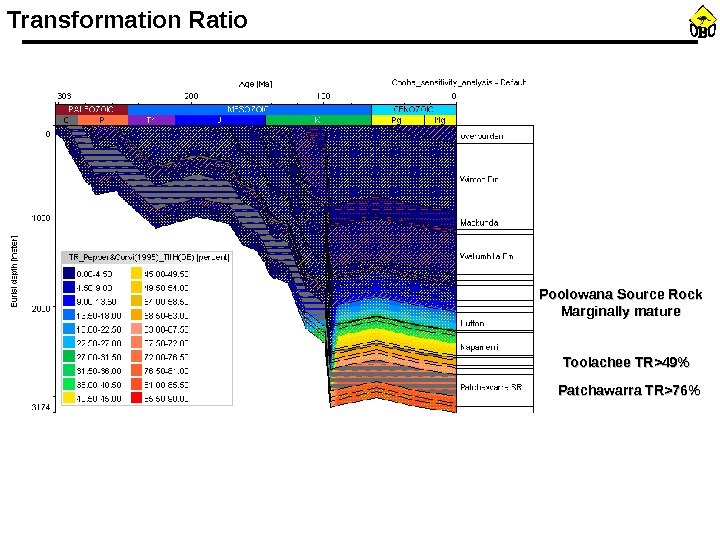
Transformation Ratio Poolowana Source Rock Marginally mature Toolachee TR>49% Patchawarra TR>76%
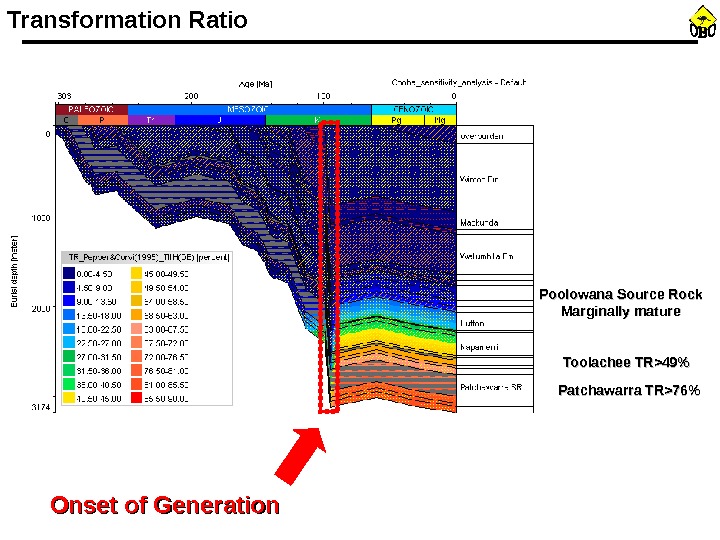
Transformation Ratio Poolowana Source Rock Marginally mature Toolachee TR>49% Patchawarra TR>76% Onset of Generation
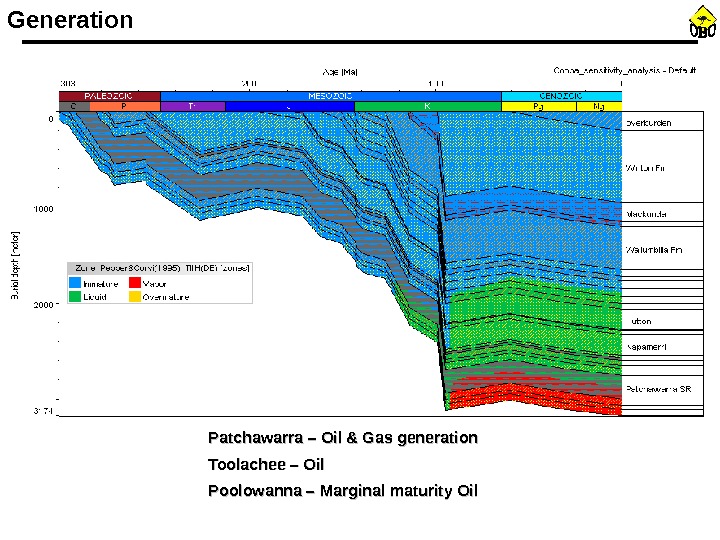
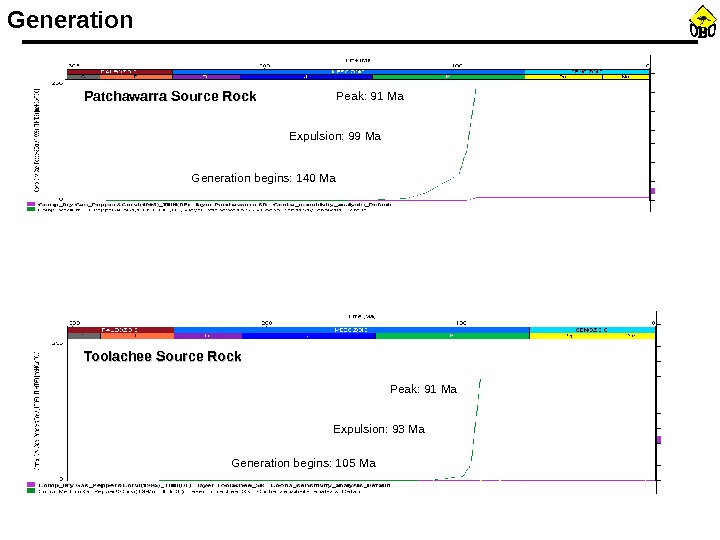
Generation Patchawarra – Oil & Gas generation Toolachee – Oil Poolowanna – Marginal maturity Oil
Generation begins: 140 Ma Expulsion: 99 Ma Peak: 91 Ma Patchawarra Source Rock Generation begins: 105 Ma Expulsion: 93 Ma Peak: 91 Ma. Toolachee Source Rock
HC generation insensitive to TOC, HI variation, Permian erosion – prior to any generation HC type sensitive to kinetics and Late Cretaceous erosion thickness HC generation strongly dependent on heat flow – and in particular heat flow spike at 90 Ma. Sensitivity Analysis
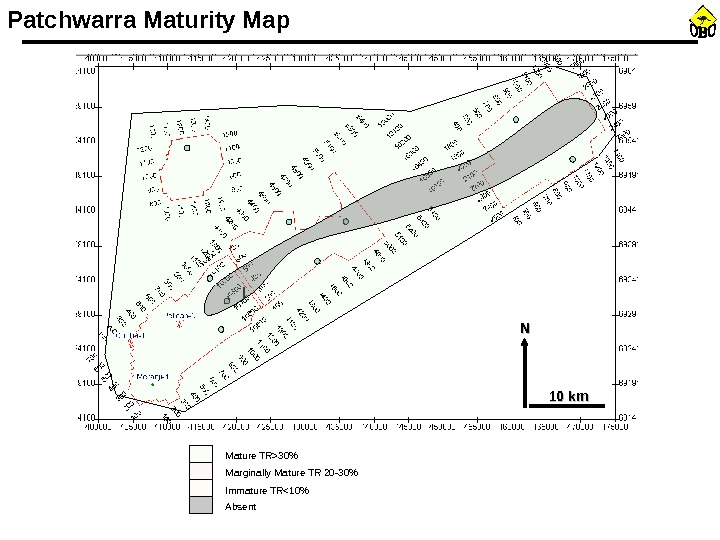
Mature TR>30% Marginally Mature TR 20 -30% Immature TR<10% Absent 10 km. NNPatchwarra Maturity Map A C D E I 10 km. NN
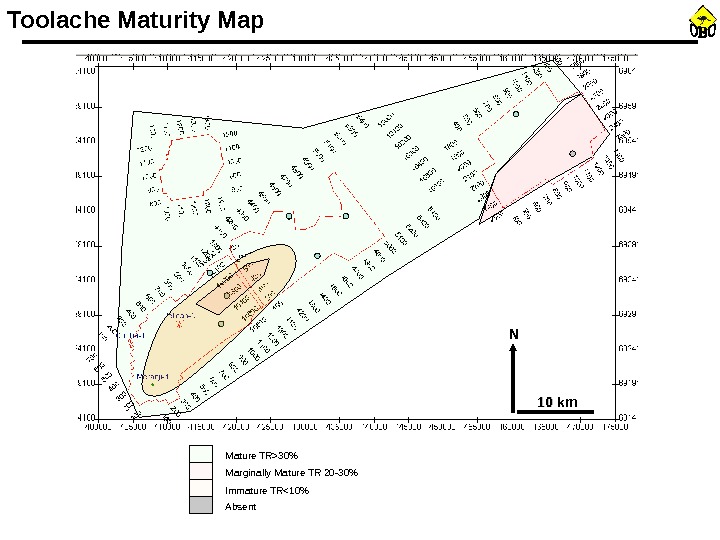
Toolache Maturity Map Mature TR>30% Marginally Mature TR 20 -30% Immature TR<10% Absent 10 km. NN
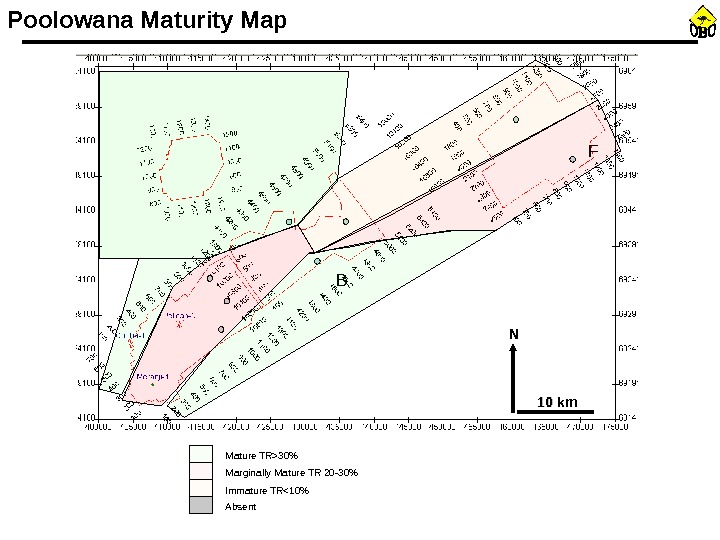
Poolowana Maturity Map B F 10 km. NN Mature TR>30% Marginally Mature TR 20 -30% Immature TR<10% Absent
Events Chart Critical Moment All the elements of the Petroleum System were in place by the Critical Moment
• Introduction • Seismic Interpretation • Formation Evaluation • Petroleum Systems Analysis • Play Identification • Prospect Evaluation & Risk • Economic Assessment • Conclusion. Cooper-Eromanga Exploration Potential
• Lower Permian Play • Middle Jurassic Play • Upper Jurassic Play Summary 3 major plays identified
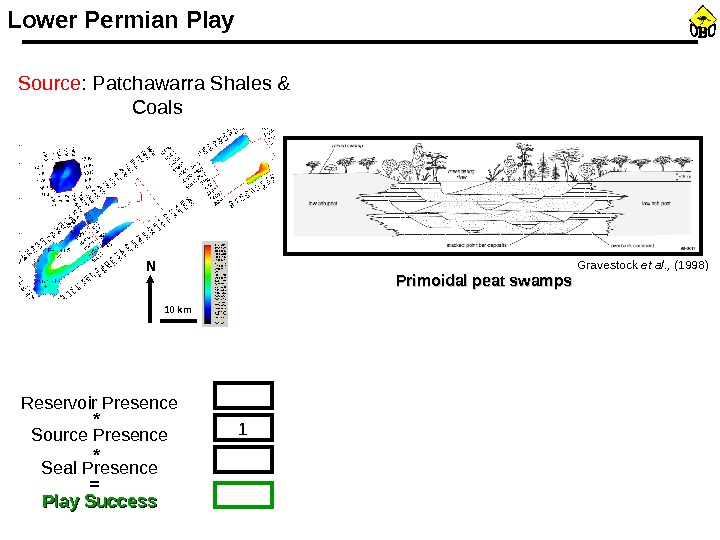
Source : Patchawarra Shales & Coals Primoidal peat swamps. Lower Permian Play Reservoir Presence Source Presence Seal Presence Play Success 1 = * * 10 km. N Gravestock et al. , (1998)
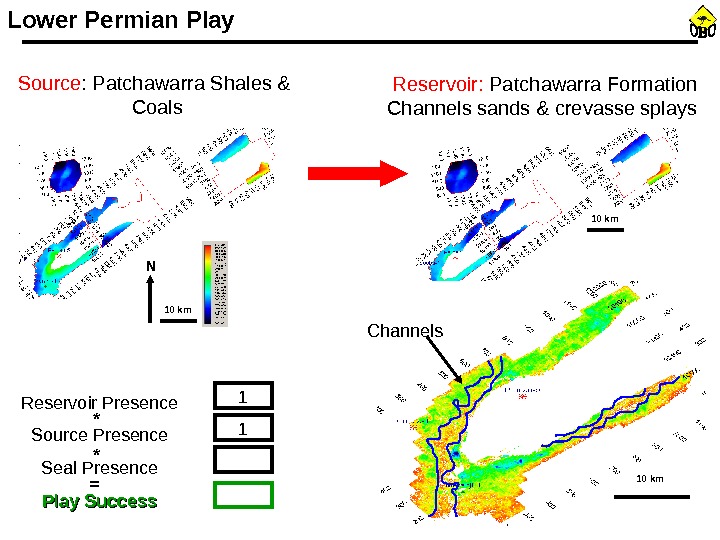
Reservoir: Patchawarra Formation Channels sands & crevasse splays Channels. Lower Permian Play Reservoir Presence Source Presence Seal Presence Play Success 1 1 = * * 10 km. Source : Patchawarra Shales & Coals 10 km. N 10 km
Seal: Murtree Shale Lower Permian Play Reservoir Presence Source Presence Seal Presence Play Success 1 1 0. 6= * * 10 km. Reservoir: Patchawarra Formation Channels sands & crevasse splays 10 km. Source : Patchawarra Shales & Coals 10 km. N
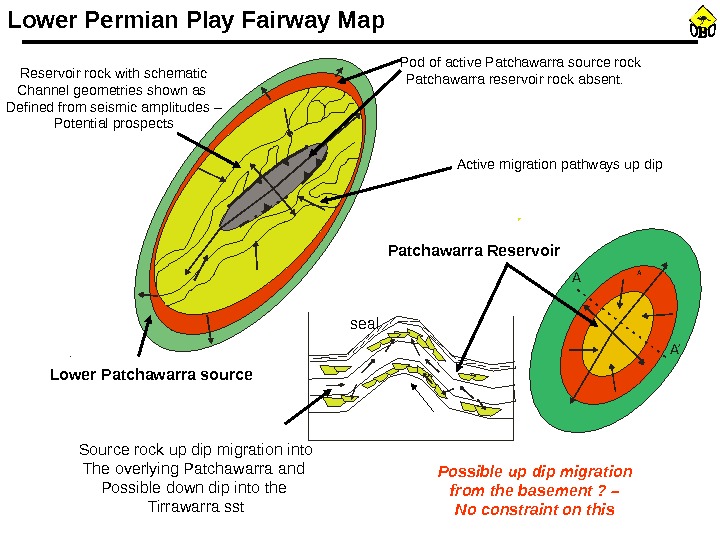
A A A’ Pod of active Patchawarra source rock Patchawarra reservoir rock absent. Reservoir rock with schematic Channel geometries shown as Defined from seismic amplitudes – Potential prospects Lower Patchawarra source A A A’Active migration pathways up dip seal Source rock up dip migration into The overlying Patchawarra and Possible down dip into the Tirrawarra sst Patchawarra Reservoir Possible up dip migration from the basement ? – No constraint on this. Lower Permian Play Fairway Map
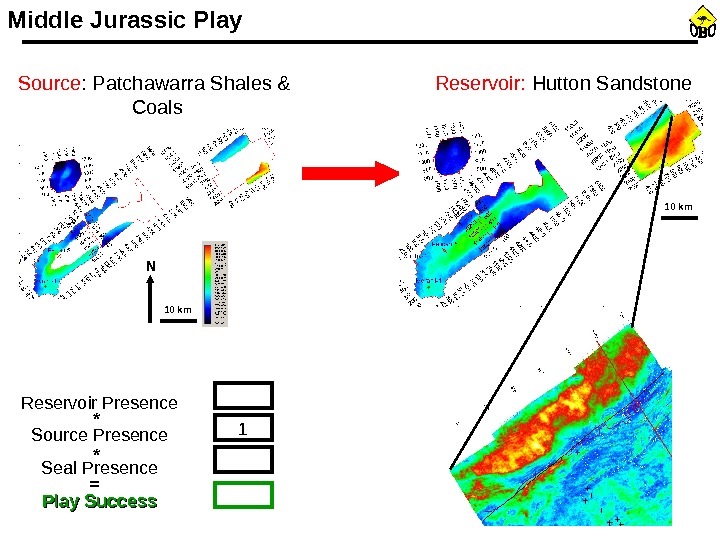
Middle Jurassic Play Reservoir Presence Source Presence Seal Presence Play Success 1 = * *Source : Patchawarra Shales & Coals 10 km. N Reservoir: Hutton Sandstone 10 km
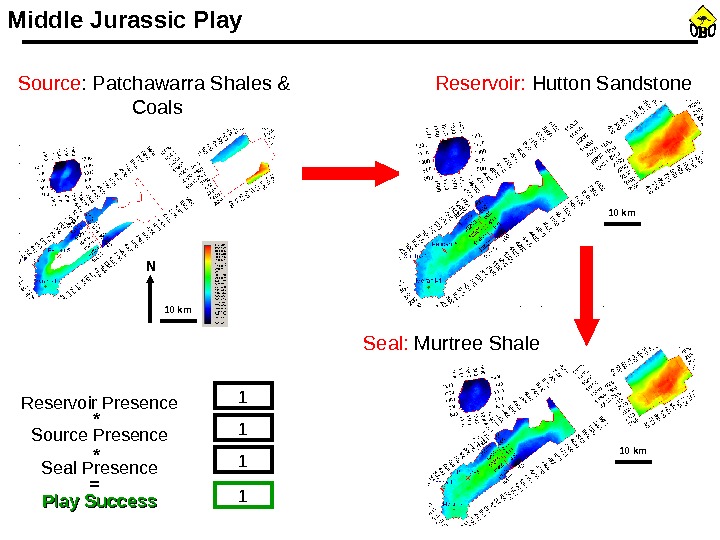
Seal: Birkhead Formation Reservoir Presence Source Presence Seal Presence Play Success 1 1= * *Source : Patchawarra Shales & Coals 10 km. N Reservoir: Hutton Sandstone 10 km. Seal: Murtree Shale Middle Jurassic Play
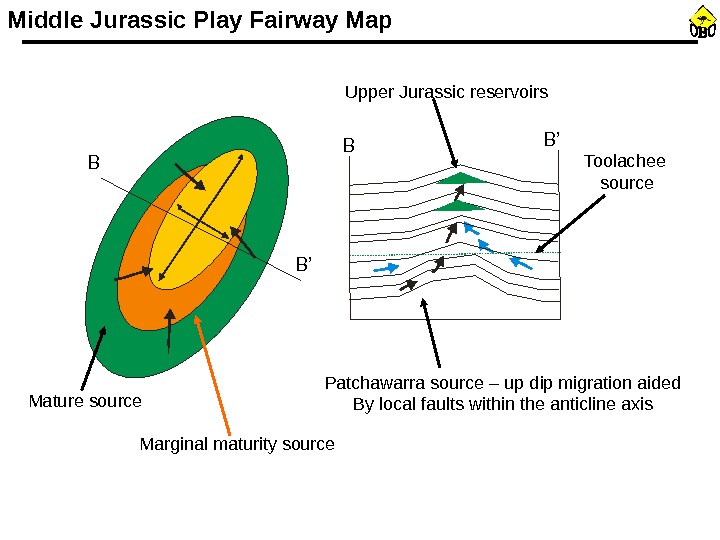
A A A’ B B’ Toolachee source Patchawarra source – up dip migration aided By local faults within the anticline axis Marginal maturity source. Mature source Upper Jurassic reservoirs. Middle Jurassic Play Fairway Map
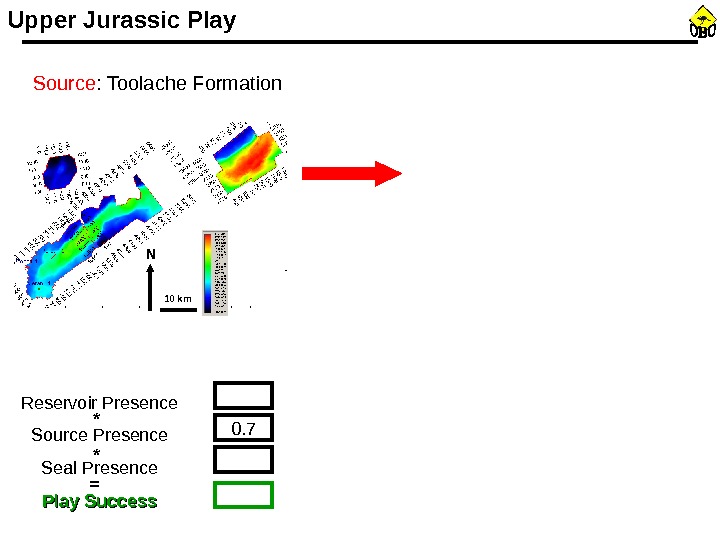
Upper Jurassic Play Reservoir Presence Source Presence Seal Presence Play Success 0. 7 = * *Source : Toolache Formation 10 km. N
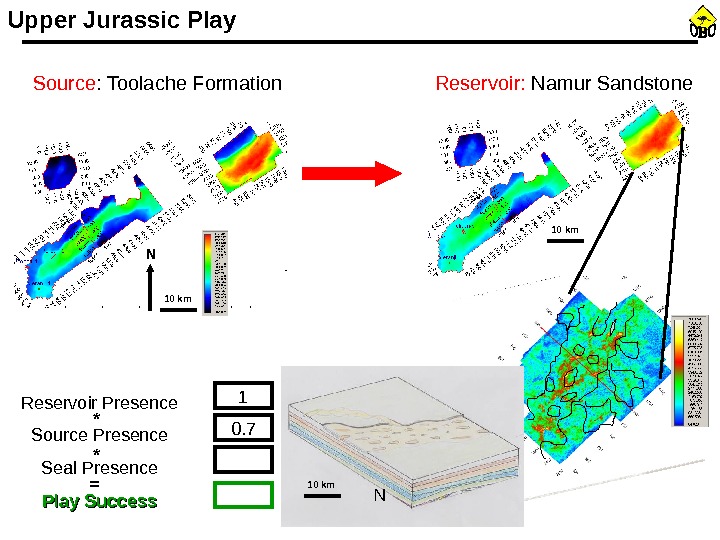
NUpper Jurassic Play Reservoir Presence Source Presence Seal Presence Play Success 1 0. 7 = * *Source : Toolache Formation 10 km. N Reservoir: Namur Sandstone 10 km
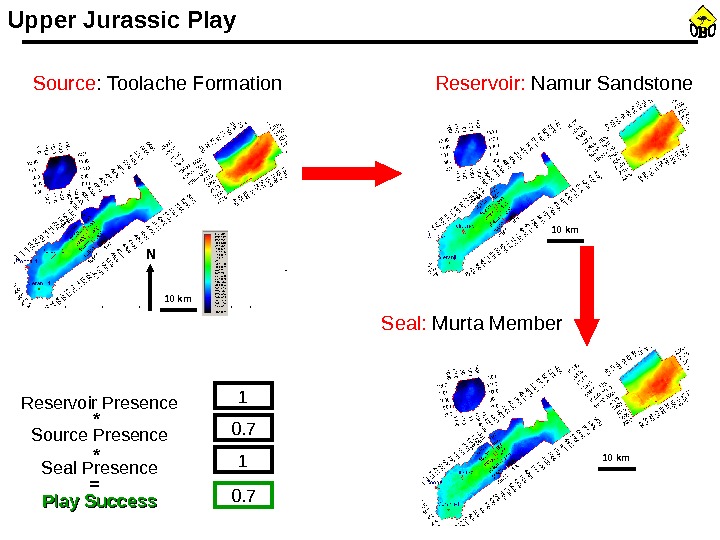
Seal: Murta Member. Upper Jurassic Play Reservoir Presence Source Presence Seal Presence Play Success 1 0. 7= * *Source : Toolache Formation 10 km. N Reservoir: Namur Sandstone 10 km
• Introduction • Seismic Interpretation • Formation Evaluation • Petroleum Systems Analysis • Play Identification • Prospect Evaluation & Risk • Economic Assessment • Conclusion. Cooper-Eromanga Exploration Potential
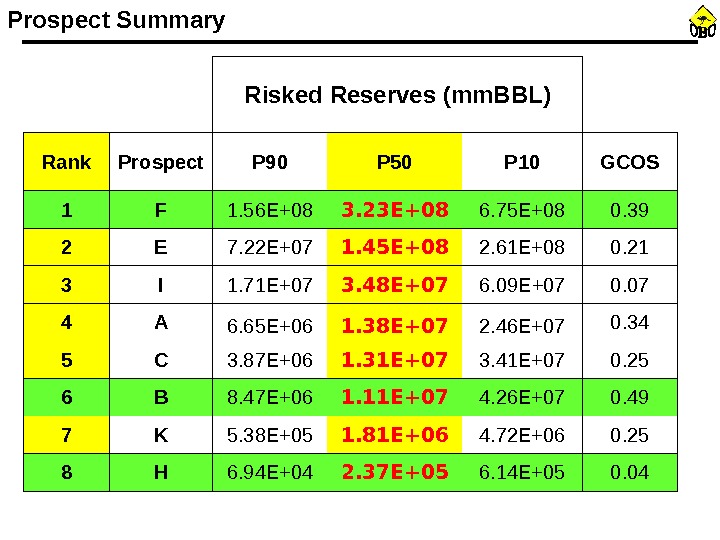
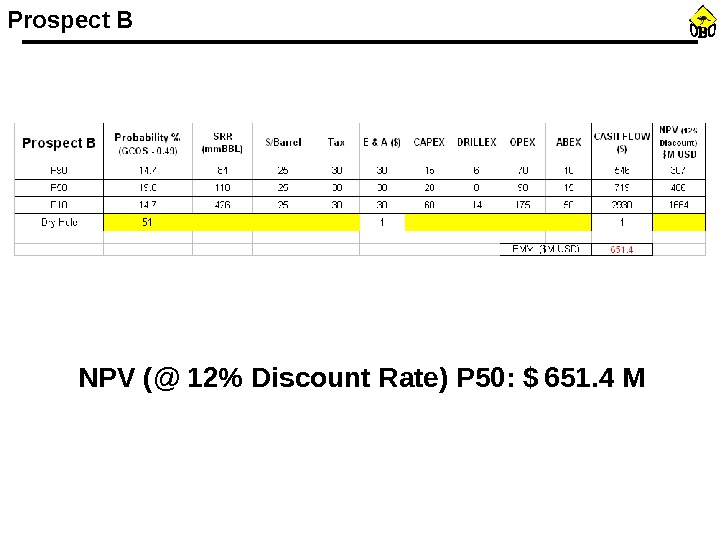
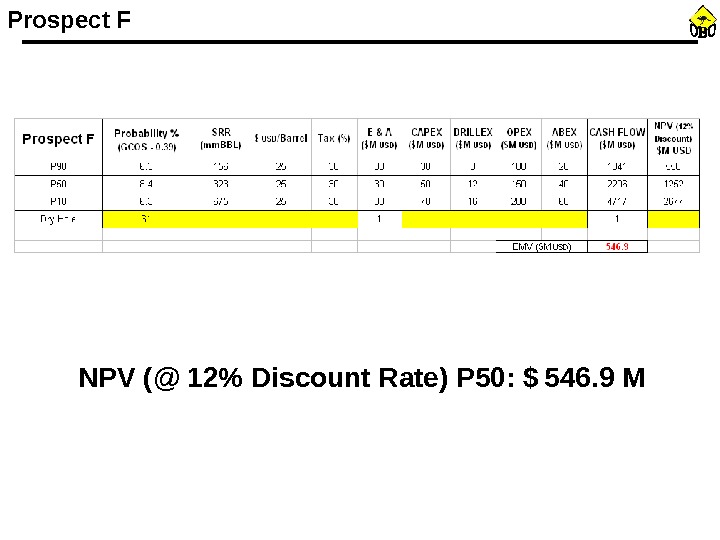
Prospect Summary Risked Reserves (mm. BBL) Rank Prospect P 90 P 50 P 10 GCOS 1 F 1. 56 E+08 3. 23 E+08 6. 75 E+08 0. 39 2 E 7. 22 E+07 1. 45 E+08 2. 61 E+08 0. 21 3 I 1. 71 E+07 3. 48 E+07 6. 09 E+07 0. 07 4 A 6. 65 E+06 1. 38 E+07 2. 46 E+07 0. 34 5 C 3. 87 E+06 1. 31 E+07 3. 41 E+07 0. 25 6 B 8. 47 E+06 1. 11 E+07 4. 26 E+07 0. 49 7 K 5. 38 E+05 1. 81 E+06 4. 72 E+06 0. 25 8 H 6. 94 E+04 2. 37 E+05 6. 14 E+05 0.
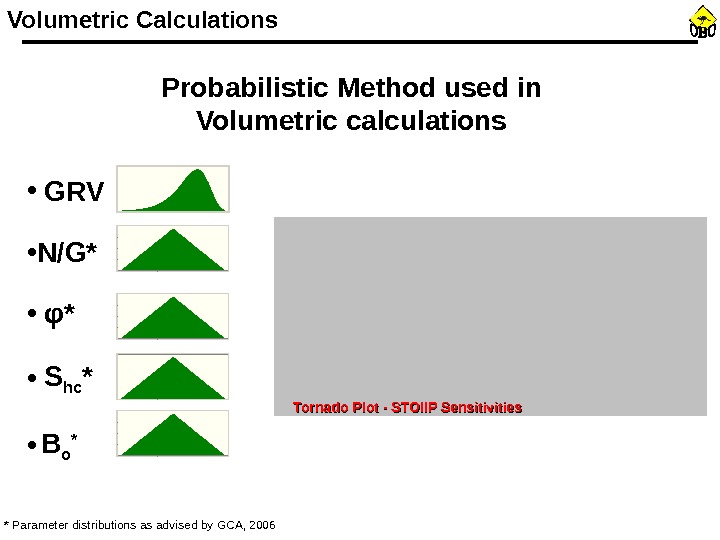
Tornado Plot — STOIIP Sensitivities. Volumetric Calculations Probabilistic Method used in Volumetric calculations * Parameter distributions as advised by GCA, 2006 • GRV • N/G* • φ * • S hc * • B o *
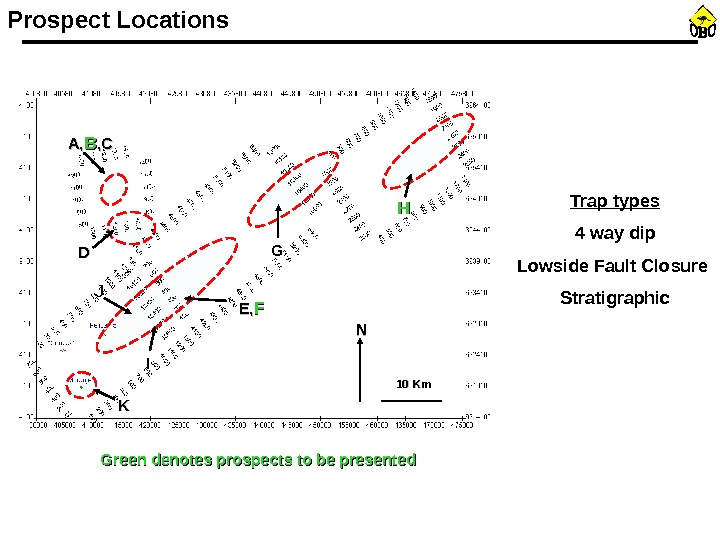
10 Km. A, A, BB , C, C E, E, FF G DD HH IJ KKProspect Locations Trap types 4 way dip Lowside Fault Closure Stratigraphic NN Green denotes prospects to be presented
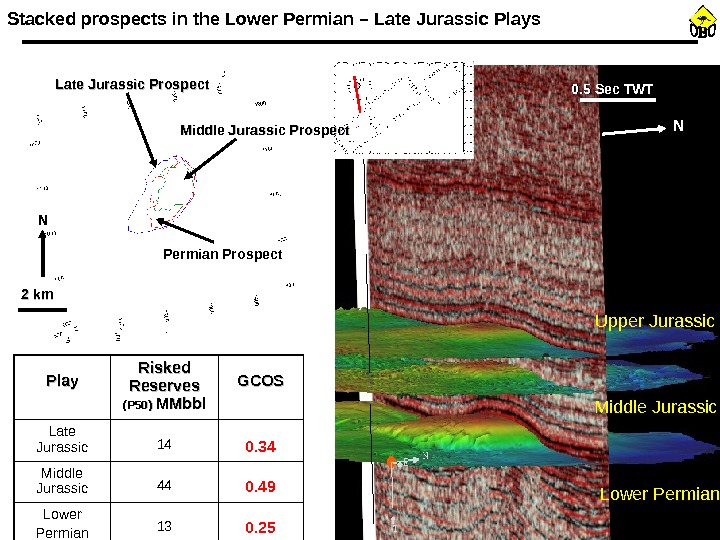
Upper Jurassic Middle Jurassic Lower Permian. Play Risked Reserves (P 50) MMbbl GCOS Late Jurassic 14 0. 34 Middle Jurassic 44 0. 49 Lower Permian 13 0. 25 Late Jurassic Prospect Middle Jurassic Prospect Permian Prospect NN 0. 5 Sec TWT N 2 km. Stacked prospects in the Lower Permian – Late Jurassic Plays
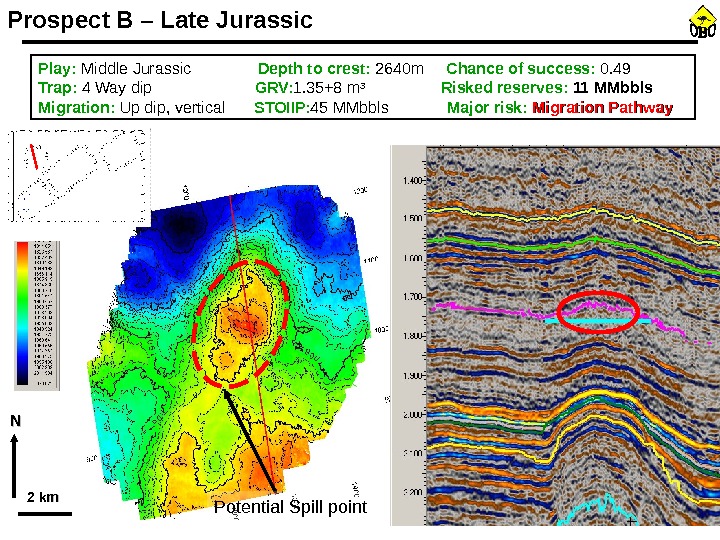
2 km. Prospect B – Late Jurassic Play: Middle Jurassic Depth to crest: 2640 m Chance of success: 0. 49 Trap: 4 Way dip GRV: 1. 35+8 m 3 Risked reserves: 11 MMbbls Migration: Up dip, vertical STOIIP : 45 MMbbls Major risk: Migration Pathway Potential Spill point NN
Reservoir Presence Source Presence Seal Presence Play Success 1 0. 7= * * 1 1 0. 7 Reservoir Quality Source Rock Maturity Migration Route Timing of Charge Trap Integrity Prospect Success = * * * 0. 7 1 11 Play Success Prospect Chance 0. 7 0. 49 ** =Prospect B — GCOS
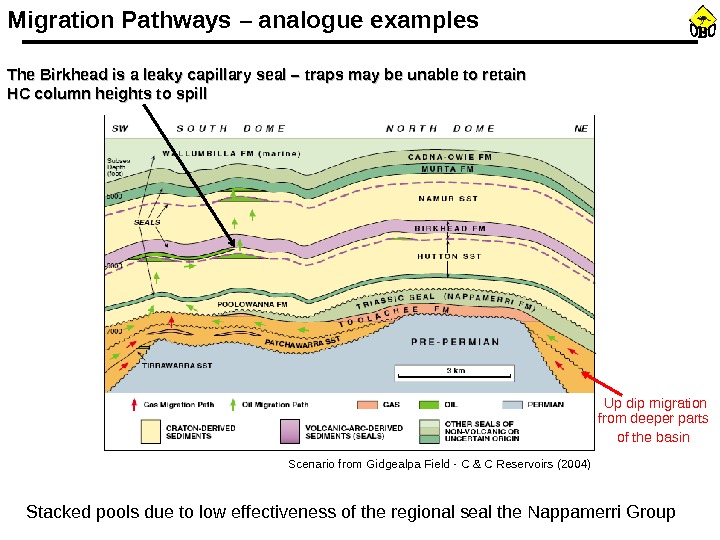
Up dip migration from deeper parts of the basin The Birkhead is a leaky capillary seal – traps may be unable to retain HC column heights to spill Stacked pools due to low effectiveness of the regional seal the Nappamerri Group. Migration Pathways – analogue examples Scenario from Gidgealpa Field — C & C Reservoirs (2004)
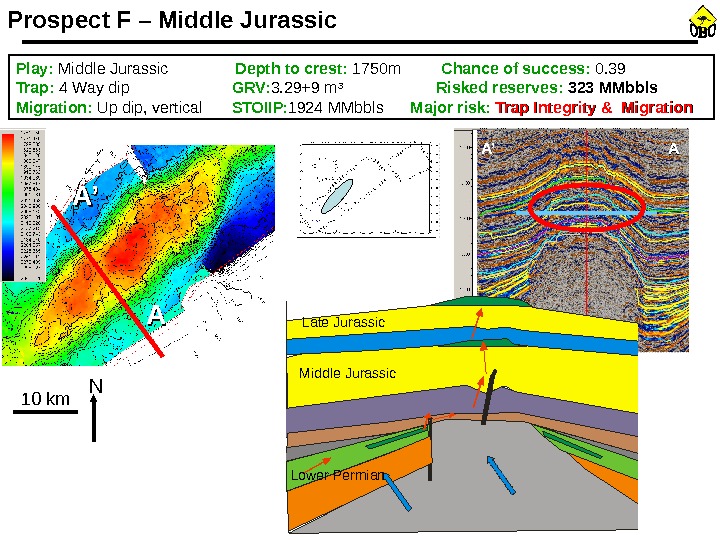
A’ AA Middle Jurassic Late Jurassic Lower Permian. Prospect F – Middle Jurassic Play: Middle Jurassic Depth to crest: 1750 m Chance of success: 0. 39 Trap: 4 Way dip GRV: 3. 29+9 m 3 Risked reserves: 323 MMbbls Migration: Up dip, vertical STOIIP : 1924 MMbbls Major risk: Trap Integrity & Migration 10 km AAA’A’ N
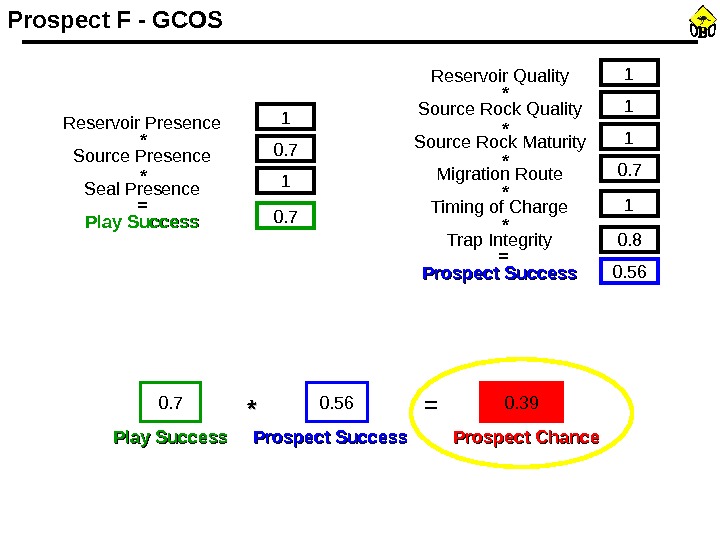
Reservoir Presence Source Presence Seal Presence Play Success 1 0. 7= * * 1 1 0. 56 Reservoir Quality Source Rock Maturity Migration Route Timing of Charge Trap Integrity Prospect Success = * * * 0. 7 1 0. 8 1 Play Success Prospect Chance 0. 7 0. 56 0. 39 ** =Prospect F — GCOS
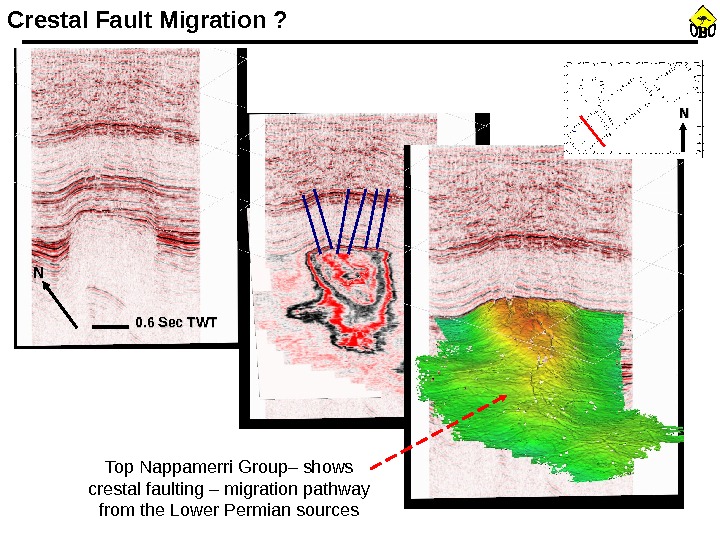
Top Nappamerri Group– shows crestal faulting – migration pathway from the Lower Permian sources. NN 0. 6 Sec TWT NNCrestal Fault Migration ?
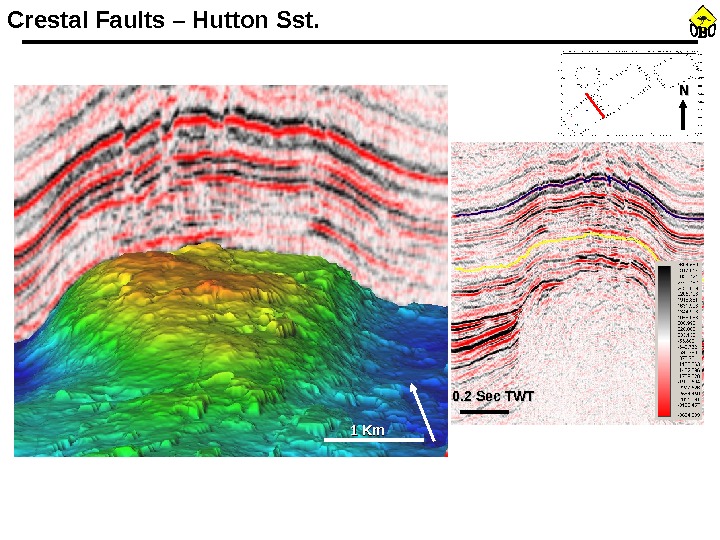
Crestal Faults – Hutton Sst. NN 1 Km 0. 2 Sec TWT
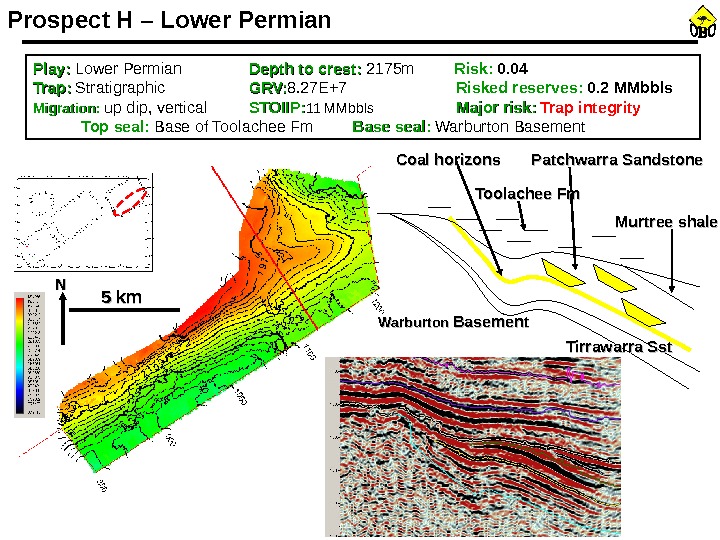
Warburton Basement Patchwarra Sandstone Coal horizons Murtree shale. Toolachee Fm Tirrawarra Sst. NNPlay: Lower Permian Depth to crest: 2175 m Risk: 0. 04 Trap: Stratigraphic GRV: 8. 27 E+7 Risked reserves: 0. 2 MMbbls Migration: up dip, vertical STOIIP: 11 MMbbls Major risk: Trap integrity Top seal: Base of Toolachee Fm Base seal: Warburton Basement. Prospect H – Lower Permian 5 km
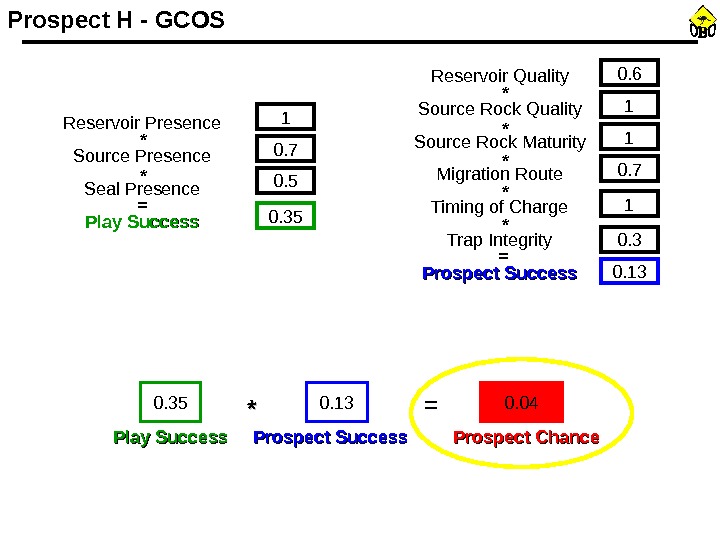
Reservoir Presence Source Presence Seal Presence Play Success 1 0. 7 0. 5 0. 35= * * 0. 6 1 0. 13 Reservoir Quality Source Rock Maturity Migration Route Timing of Charge Trap Integrity Prospect Success = * * * 0. 7 1 0. 3 1 Play Success Prospect Chance 0. 35 0. 13 0. 04 ** =Prospect H — GCOS
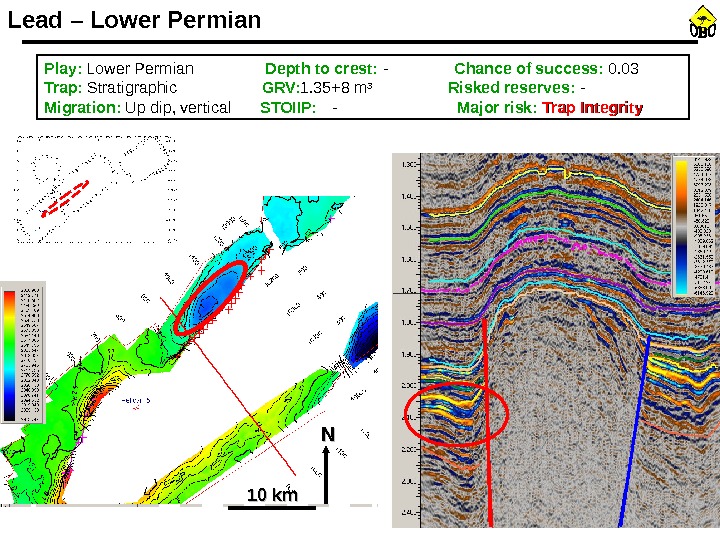
NN 10 km. Lead – Lower Permian Play: Lower Permian Depth to crest: — Chance of success: 0. 03 Trap: Stratigraphic GRV: 1. 35+8 m 3 Risked reserves: — Migration: Up dip, vertical STOIIP : — Major risk: Trap Integrity
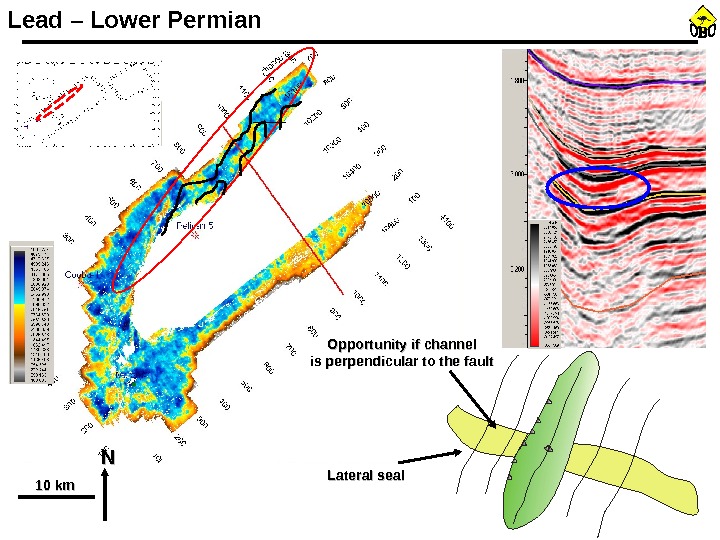
Opportunity if channel is perpendicular to the fault NN Lateral seal 10 km. Lead – Lower Permian
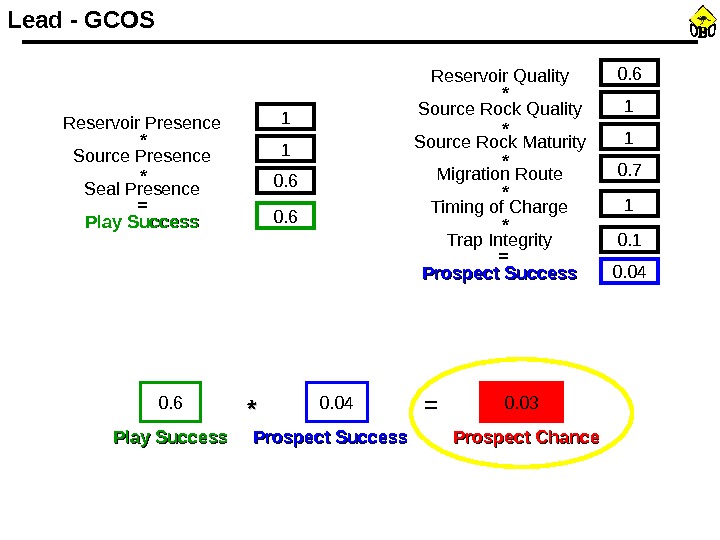
Reservoir Presence Source Presence Seal Presence Play Success 1 1 0. 6= * * 0. 6 1 0. 04 Reservoir Quality Source Rock Maturity Migration Route Timing of Charge Trap Integrity Prospect Success = * * * 0. 7 1 0. 1 1 Play Success Prospect Chance 0. 6 0. 04 0. 03 ** =Lead — GCOS
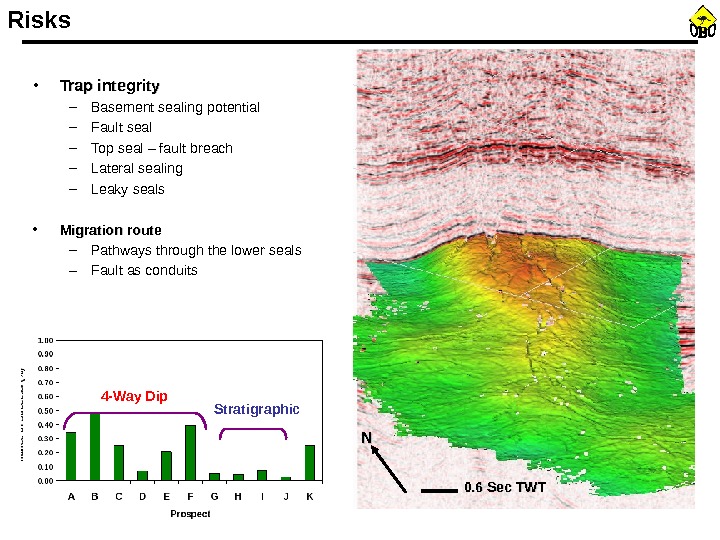
• Trap integrity – Basement sealing potential – Fault seal – Top seal – fault breach – Lateral sealing – Leaky seals • Migration route – Pathways through the lower seals – Fault as conduits 4 -Way Dip Stratigraphic NN 0. 6 Sec TWTRisks
• Introduction • Seismic Interpretation • Formation Evaluation • Petroleum Systems Analysis • Play Identification • Prospect Evaluation & Risk • Economic Assessment • Conclusion. Cooper-Eromanga Exploration Potential
Why should we invest? Market Opportunity Free Market Economy. Fiscal Terms Deliverability Demand
Why should we invest? Strategic Opportunity Political Stability. Exploration Potential Security of Supply OILOIL
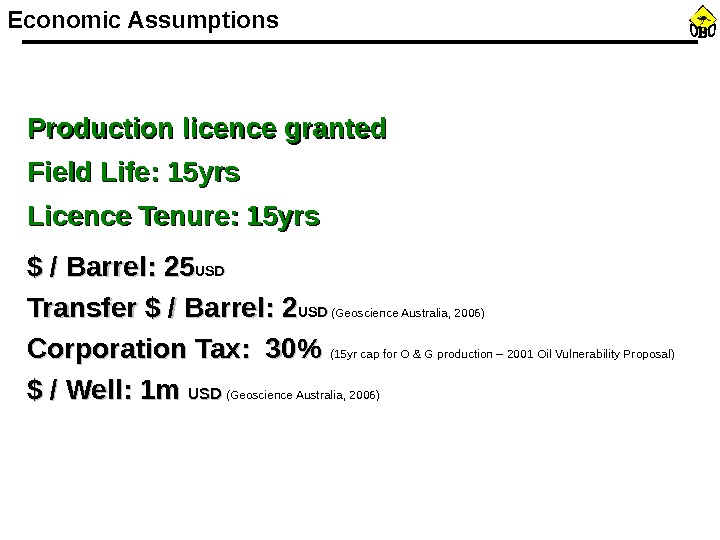
Economic Assumptions Production licence granted Field Life: 15 yrs Licence Tenure: 15 yrs $ / Barrel: 25 USDUSD Transfer $ / Barrel: 2 USD (Geoscience Australia, 2006) Corporation Tax: 30% (15 yr cap for O & G production – 2001 Oil Vulnerability Proposal) $ / Well: 1 m USD (Geoscience Australia, 2006)
Prospect B NPV (@ 12% Discount Rate) P 50: $ 651. 4 M
Prospect BDiscovery (49%) Dry Hole (51%) P 90 (30%)P 10 (30%) P 50 (40%) Risked Outcome USD$ Millions 80. 3 140. 9 — 0. 51 430. 7 EMVEMV $ 651. 4 MProbabilities based on Swanson’s Rule (GCA, 2006) 2930 $M * 0. 147719 $M * 0. 196546 $M * 0. 147 1 $M * 0.
Prospect F NPV (@ 12% Discount Rate) P 50: $ 546. 9 M
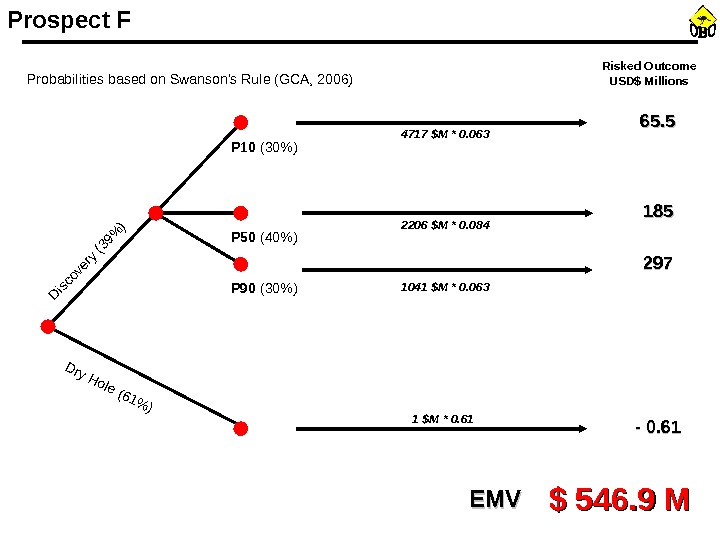
Prospect FDiscovery (39%) Dry Hole (61%) P 90 (30%)P 10 (30%) P 50 (40%) Risked Outcome USD$ Millions 65. 5 185185 — 0. 61 297297 EMVEMV $ 546. 9 MProbabilities based on Swanson’s Rule (GCA, 2006) 1041 $M * 0. 0632206 $M * 0. 0844717 $M * 0. 063 1 $M * 0.
Favourable fiscal terms, allied with the potential for major future discoveries, Australia is likely to be a successful location for future E & P projects
• Introduction • Seismic Interpretation • Formation Evaluation • Petroleum Systems Analysis • Play Identification • Prospect Evaluation & Risk • Economic Assessment • Conclusion. Cooper-Eromanga Exploration Potential
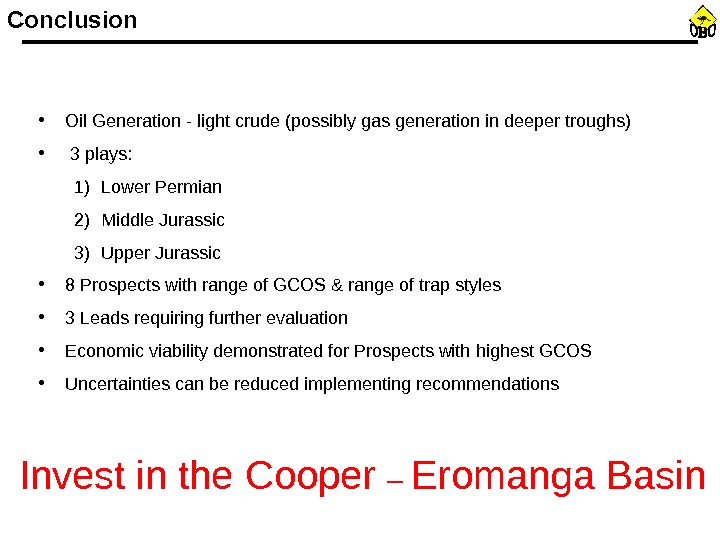
Conclusion • Oil Generation — light crude (possibly gas generation in deeper troughs) • 3 plays: 1) Lower Permian 2) Middle Jurassic 3) Upper Jurassic • 8 Prospects with range of GCOS & range of trap styles • 3 Leads requiring further evaluation • Economic viability demonstrated for Prospects with highest GCOS • Uncertainties can be reduced implementing recommendations Invest in the Cooper – Eromanga Basin
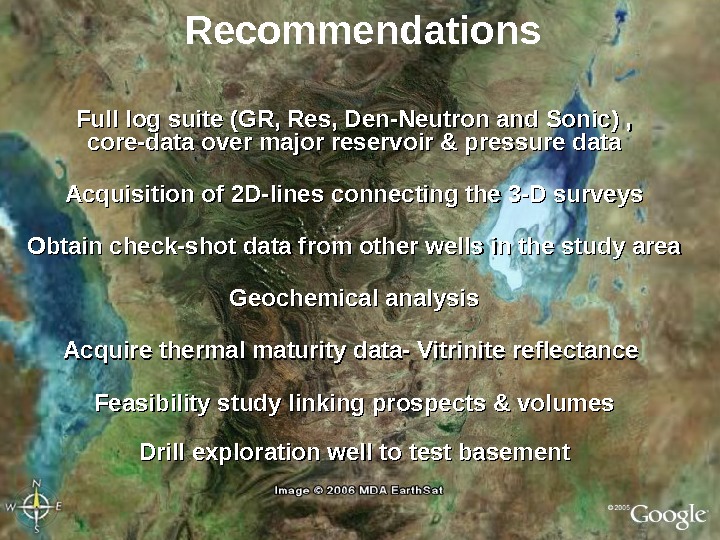
Full log suite (GR, Res, Den-Neutron and Sonic) , core-data over major reservoir & pressure data Acquisition of 2 D-lines connecting the 3 -D surveys Obtain check-shot data from other wells in the study area Geochemical analysis Acquire thermal maturity data- Vitrinite reflectance Feasibility study linking prospects & volumes Drill exploration well to test basement Recommendations
Acknowledgements Many thanks to a few colleagues in Australia who were kind enough to provide additional support & information; • Prof. Richard Hillis – Australian School of Petroleum • Tracey Simmons — Petroleum Licensing & Royalties Officer, South Australia State Government • Paul Jamieson – Geoscience Australia
Questions?