
Consumers, Producers, and the Efficiency of Markets Chapter


chapter_7_problem_and_application.ppt
- Размер: 2.9 Mегабайта
- Количество слайдов: 24
Описание презентации Consumers, Producers, and the Efficiency of Markets Chapter по слайдам
Consumers, Producers, and the Efficiency of Markets Chapter 7 By Kuanysh SHONBAYKazakh Turkish College of Economics
Name. Quiztotal without words Group points Indiv pointstotal 1 Anuar 94941494/5 2 Aygerim 93939 -593/5 3 Gulzat 907651090/5 4 Manasbek 877138 -2087/5 5 Islam 8178881/5 6 Arailym 7862580/5 7 Dias 72601480/5 8 Sagadat 7258577/4 9 Meruert 71661180/5 10 Aiganim 7054111080/5 11 Botagoz 7055777/4 12 Aidana 6969978/4 13 Zhusip 68, 56038 -580/5 14 Zamira 62471172/4 15 Temirbek 605982080/5 16 Balzhan 594891078/4 17 Aigul 56411167/4 18 Daulet 54511468/4 19 Arailym. Azi 5442963/4 20 Abay 5242860/4 21 Akmarzhan 5337558/3 22 Akerke 523691071/4 23 Vlad 4934141059/3 24 Narul 4537853/3 25 Zhansaya 4631753/3 66, 9856, 7275,
An internship is a system of on-the-job training for white-collar and professional careers Poverty is the state of one who lacks a certain amount of material possessions or money. Meager Deficient in quantity, fullness, or extent; scanty.
Quizzes are your feedback on my teaching
Your cheating makes me misevaluate your knowledge
Questions for Review And Problem and Applications For Chapter
1 -)Explain how buyers ’ willingness to pay, consumer surplus, and the demand curve are related?
Buyers ’ willingness to pay, consumer surplus, and the demand curve are all closely related. The height of the demand curve represents the willingness to pay of the buyers. Consumer surplus is the area below the demand curve and above the price, which equals each buyer ’ s willingness to pay less the price of the good.
2 -)What is efficiency? Is it the only goal of economic policymakers?
they may also be concerned about equity — the fairness of the distribution of well-being. An allocation of resources is efficient if it maximizes total surplus, the sum of consumer surplus and producer surplus. But efficiency may not be the only goal of economic policymakers;
3 -) An early freeze in California sours the lemon crop. What happens to consumer surplus in the market for lemons ? What happens to consumer surplus in the market for lemonade ? Illustrate your answers with diagrams.
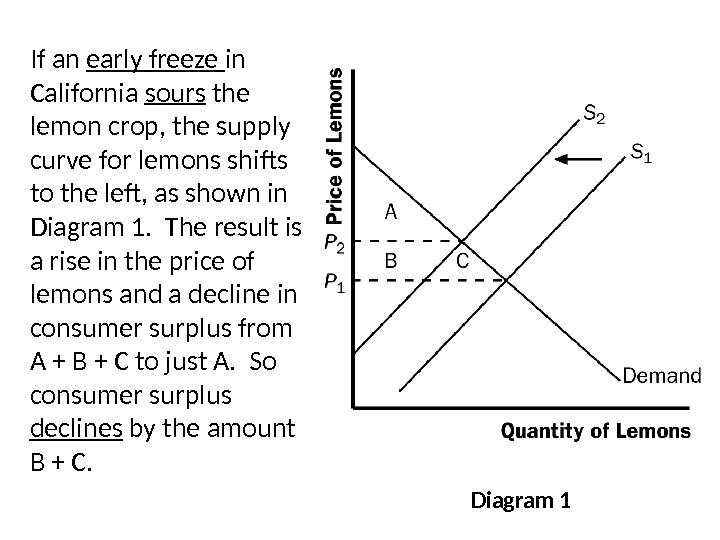
If an early freeze in California sours the lemon crop, the supply curve for lemons shifts to the left, as shown in Diagram 1. The result is a rise in the price of lemons and a decline in consumer surplus from A + B + C to just A. So consumer surplus declines by the amount B + C. Diagram
Diagram 2 In the market for lemonade, the higher cost of lemons reduces the supply of lemonade, as shown in Diagram 2. The result is a rise in the price of lemonade and a decline in consumer surplus from D + E + F to just D, a loss of E + F. Note that an event that affects consumer surplus in one market often has effects on consumer surplus in other markets.
4 -) Suppose the demand for French bread rises. What happens to producer surplus in the market for French bread ? What happens to producer surplus in the market for flour ? Illustrate your answer with diagrams.
D ia g ra m 3 A rise in the demand for French bread leads to an increase in producer surplus in the market for French bread, as shown in Diagram 3. The shift of the demand curve leads to an increased price, which increases producer surplus from area A to area A + B + C.
Diagram 4 The increased quantity of French bread being sold increases the demand for flour, as shown in Diagram 4. As a result, the price of flour rises, increasing producer surplus from area D to D + E + F. Note that an event that affects producer surplus in one market leads to effects on producer surplus in related markets.
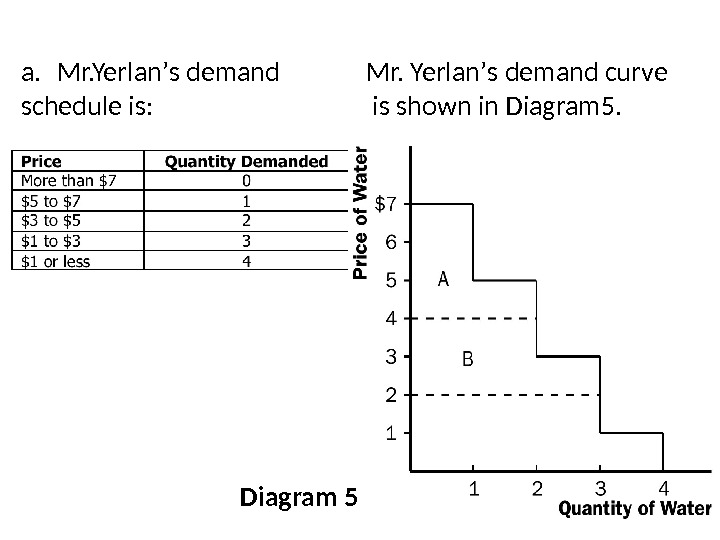
5 -) It is a hot day, and mr. Yerlan is very thirsty. Here is the value he places on a bottle of water. Value of first bottle $7 Value of second bottle $5 Value of third bottle $3 Value of fourth bottle $1 a) From this information, derive Mr. Yerlan ’ s demand schedule(sk é j ’ әl). Graph his demand curve for bottled water. b) If the price of bottle of water is $4, how many bottles does mr. Yerlan get from his purchases? Show Mr. Yerlan ’ s consumer surplus in your graph. c) If the price falls to $2, how does quantity demanded change? How does mr. Yerlan ’ s consumer surplus change? Show these changes in your graph.
a. Mr. Yerlan ’ s demand schedule is: Mr. Yerlan ’ s demand curve is shown in Diagram
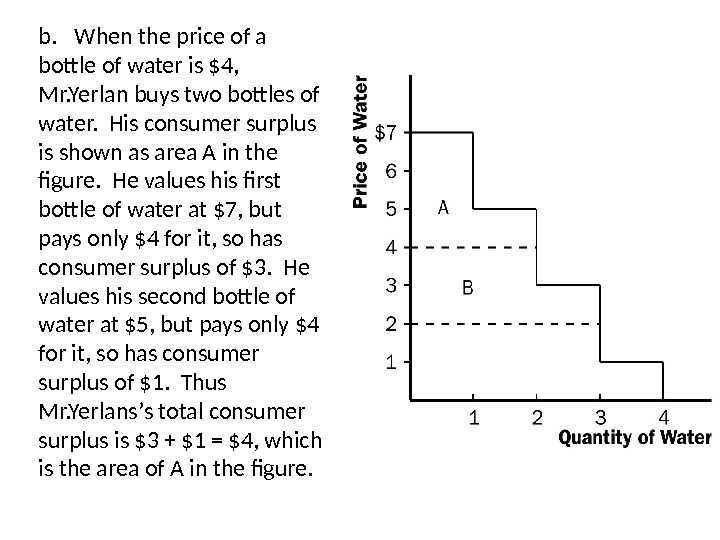
b. When the price of a bottle of water is $4, Mr. Yerlan buys two bottles of water. His consumer surplus is shown as area A in the figure. He values his first bottle of water at $7, but pays only $4 for it, so has consumer surplus of $3. He values his second bottle of water at $5, but pays only $4 for it, so has consumer surplus of $1. Thus Mr. Yerlans ’ s total consumer surplus is $3 + $1 = $4, which is the area of A in the figure.
When the price of a bottle of water falls from $4 to $2, mr. Yerlan buys three bottles of water, an increase of one. His consumer surplus consists of both areas A and B in the figure, an increase in the amount of area B. He gets consumer surplus of $5 from the first bottle ($7 value minus $2 price), $3 from the second bottle ($5 value minus $2 price), and $1 from the third bottle ($3 value minus $2 price), for a total consumer surplus of $9. Thus consumer surplus rises by $5 (which is the size of area B) when the price of a bottle of water falls from $4 to $2.
6 -) There are four consumers willing to pay the following amount for haircuts: • Jerry: $7 * Oprah: $2 * Sally Jessy: $8 *Montel $5 There are four haircutting businesses with the following costs ^ Firm A : $3 ^ Firm B : $6 ^ Firm C : $4 ^ Firm D : $
Economic Well-Being and Total Surplus or Total Surplus = Value to buyers _ Cost to sellers. Total Surplus = Consumer Surplus Producer Surplus+
Diagram 6 shows supply and demand curves for haircuts. Supply equals demand at a quantity of three haircuts and a price between $4 and $5. Firms A, C, and D should cut the hair of Sally Jessy, Jerry, and Montel. Oprah ’ s willingness to pay is too low and firm B ’ s costs are too high, so they do not participate. The maximum total surplus is the area between the demand supply curves, which totals $11 ($8 value minus $2 cost for the first haircut, plus $7 value minus $3 cost for the second, plus $5 value minus $4 cost for the third). Diagram
Thank you for your corporation!