

0fe0a696c6013104f1bac7c7da284b16.ppt
- Количество слайдов: 66
 Conducting Indoor Air Quality Studies Mark Travers, M. S. Roswell Park Cancer Institute
 Evaluation of Clean Indoor Air Law Implementation Support or Opposition Public Health Impact Direct Effects Indirect Effects Compliance Exceptions to Law (Waivers) Adverse Side Effects Economic Impact
 Evaluation of Clean Indoor Air Law Public Health Impact Direct Effects • Decrease indoor air pollution • Reduce exposure to carcinogens and toxins • Improve health and reduce incidence of tobacco smoke related diseases
 Tobacco Control Model of Nicotine Addiction Tobacco Products Environment Agent Familial, Social, Cultural, Political, Economic, Historical, Media Vector Tobacco Product Manufacturers; Other Users Source: Orleans & Slade, 1993 Host Smoker/Chewer Incidental Host Involuntary Smoker
 Paradigm for Tobacco Control t Access t Marketing Individual s Price/economic s Smoke-free air s Media s Cessation activities s Prevention activities s Regulation/Liability
 Adult Per Capita Cigarette Consumption and Major Smoking and Health Events – United States, 1900 -2003 1 st World Conference on Smoking and Health 1 st Surgeon General’s Report Broadcast Ad Ban 1 st Great American Smoke-out End of WW II OTC Nicotine Medications Master Settlement Agreement Fairness Doctrine Messages on TV and Radio 1 st Smoking-Cancer Concern Non-Smokers Rights Movement Begins Surgeon General’s Report on ETS Federal Cigarette Tax Doubles Great Depression Source: United States Department of Agriculture; 2002 and 2003 estimates are preliminary
 Components of Smoking Vaccine Smokefree Air Counter Marketing Price Treatment
 Measuring Air Quality • Cigarettes, cigars and pipes are major emitters of respirable suspended particles less than 2. 5 microns (PM 2. 5) in diameter that are easily inhaled deep into the lungs • TSI Side. Pak AM 510 Personal Aerosol Monitor (weight: 1 lb) • This device is a real-time laser photometer with a built-in sampling pump that measures airborne particle massconcentration
 Why PM 2. 5? • • Very sensitive marker of ETS Can monitor and record data in real time Relatively inexpensive equipment Marker of the more than 4, 000 chemical in ETS – E. g. 2, 000: 1, PM 2. 5: PAH • Meaningful measure: there are PM 2. 5 standards in place to protect public health – The EPA has set standards of 15 μg/m 3 as the average annual level of PM 2. 5 exposure and 65 μg/m 3 24 -hour exposure in order to protect the public health
 Good 0 -50") US EPA Air Quality Index PM 2. 5 ( g/m 3) Good 0 -50 ≤ 15 Moderate 51 -100 16 -40 Unusually sensitive people should consider reducing prolonged or heavy exertion. 41 -65 People with heart or lung disease, older adults, and children should reduce prolonged or heavy exertion. Unhealthy for Sensitive Groups Unhealthy Very Unhealthy Hazardous 101 -150 151 -200 201 -300 ≥ 301 66 -150 Health Advisory None. People with heart or lung disease, older adults, and children should avoid prolonged or heavy exertion. Everyone else should reduce prolonged or heavy exertion. 151 -250 People with heart or lung disease, older adults, and children should avoid all physical activity outdoors. Everyone else should avoid prolonged or heavy exertion. ≥ 251 People with heart or lung disease, older adults, and children should remain indoors and keep activity levels low. Everyone else should avoid all physical activity outdoors.
US EPA Air Quality Index PM 2. 5 ( g/m 3) Good 0 -50 ≤ 15 Moderate 51 -100 16 -40 Unusually sensitive people should consider reducing prolonged or heavy exertion. 41 -65 People with heart or lung disease, older adults, and children should reduce prolonged or heavy exertion. Unhealthy for Sensitive Groups Unhealthy Very Unhealthy Hazardous 101 -150 151 -200 201 -300 ≥ 301 66 -150 Health Advisory None. People with heart or lung disease, older adults, and children should avoid prolonged or heavy exertion. Everyone else should reduce prolonged or heavy exertion. 151 -250 People with heart or lung disease, older adults, and children should avoid all physical activity outdoors. Everyone else should avoid prolonged or heavy exertion. ≥ 251 People with heart or lung disease, older adults, and children should remain indoors and keep activity levels low. Everyone else should avoid all physical activity outdoors.
 Why use the TSI Side. Pak Personal Aerosol Monitor? • All the reason on the previous slide and, • Convenient small size – Can easily be placed discretely in a small bag
 This picture shows an example of the bag used to carry the Side. Pak and QTrak instruments during air monitoring
 Limitation of PM 2. 5 as a Marker of ETS • Not specific to tobacco smoke; other sources include cooking, vehicles, ambient/background levels • Can minimize this weakness with a pre-post study design
 Calibration • The TSI Side. Pak Personal Aerosol Monitor uses a built-in pump to bring air past a laser. • The particles in the air scatter the light from the laser and the device determines the mass concentration of particles based on the amount of scattering. • These types of devices must be calibrated with the specific type of aerosol (tobacco smoke) that you are measuring.
 Side. Pak Factory Calibration Certificate
 Calibration: Unadjusted Data Repace, J. , Respirable particles and carcinogens in the air of Delaware hospitality venues before and after a smoking ban. Journal of Occupational and Environmental Medicine, 46: 9, 887 -905. Oct. 10 th 2003 Bowie, MD
 Calibration: Adjusted Data Oct. 10 th 2003 Bowie, MD
 Elapsed Minutes") Piezobalances and Side. Pak (Factory-Calibrated) Elapsed Minutes
Piezobalances and Side. Pak (Factory-Calibrated) Elapsed Minutes
") Piezobalance and Side. Pak (Custom-Calibrated)
Piezobalance and Side. Pak (Custom-Calibrated)
 Measuring Air Quality • TSI Q-Trak Plus Indoor Air Quality Monitor • Measures 4 indoor air quality parameters – – Temperature Humidity Carbon Monoxide Carbon Dioxide • Not essential to do these studies but does provide many advantages
 Study Design • Longitudinal or Pre-Post – Compare the same venues before and after they go smoke-free • Cross-sectional – Compare smoke-free cities with cities that allow smoking – Compare smoke-free venues to smoking venues in the same city
 Venue Selection • Depends on your study goals • Random Sample – Difficult logistically – With small sample size results might not be generalizable • Convenience Sample – More feasible – Can target types of venues that would be affected by a new policy
 Measurements and Observations • • PM 2. 5 from Side. Pak Average number of people Average number of burning cigarettes Volume of room using sonic measure • Temp, humidity, CO 2 from Q-Trak
 Time Activity Pattern
 Can calculate… Average smoker density – Average number of burning cigarettes per 100 m 3
 With a QTrak You Can Calculate… • Ventilation estimate – From CO 2, average number of people, room volume
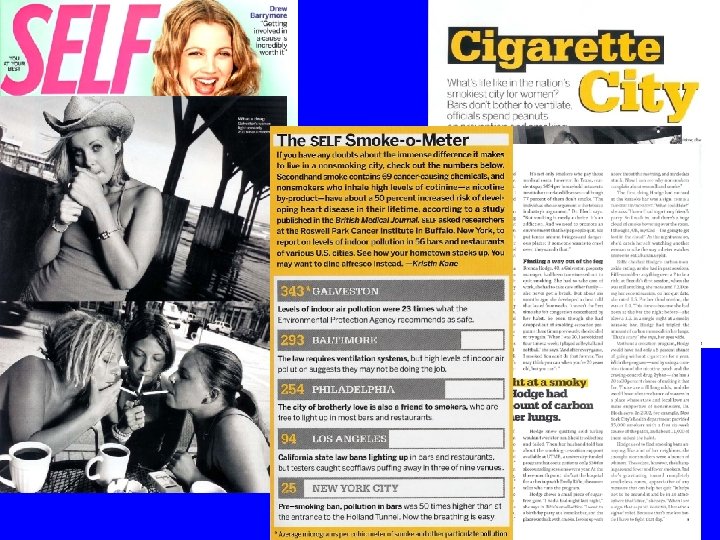
 Results • Cross sectional study design – Multi-City Air Monitoring Study
 Multi-City Air Monitoring Study: Philadelphia, PA April 10 th, 2004 All venues are smoking venues with observed smoking in all venues VENUE 47 VENUE 48 VENUE 45 VENUE 42 4/10 7: 01 pm VENUE 43 VENUE 44 VENUE 46 4/11 1: 41 am
 Multi-City Air Monitoring Study: New York City, NY April 17 th, 2004 All venues are smoke-free by law and no smoking was observed in an venue VENUE 56 4/17 6: 43 pm VENUE 57 VENUE 58 VENUE 59 VENUE 60 VENUE 61 62 4/18 2: 38 am
 Multi-City Air Monitoring Study: New York City, NY April 17 th, 2004 and Philadelphia, PA April 10 th, 2004
 Average Level of PM 2. 5 by City
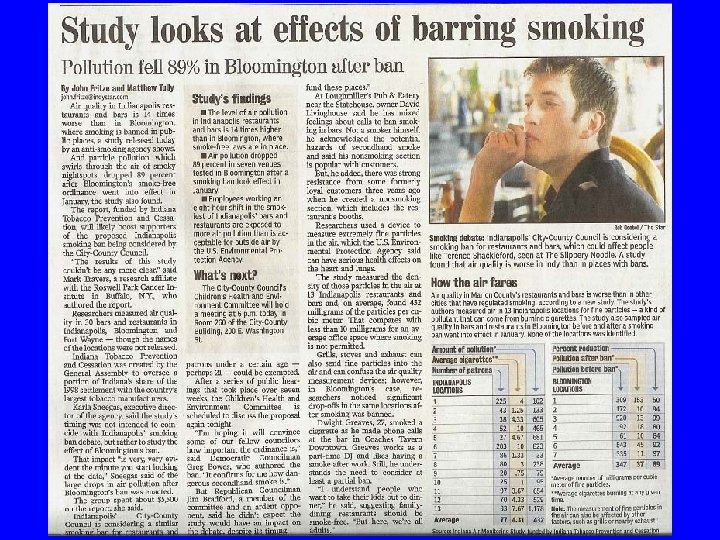
 Results • Pre-post study design – Indiana Air Monitoring Study – Western New York Air Monitoring Study Travers, M. J. , et al. , Indoor Air Quality in Hospitality Venues Before and After the Implementation of a Clean Indoor Air Law-Western New York, 2003. Morbidity and Mortality Weekly Report (MMWR), 2004.
 Indiana Air Monitoring Study December 2004 to January 2005 Indiana Tobacco Prevention and Cessation Roswell Park Cancer Institute
 Indiana Air Monitoring Study: Bloomington, IN, December 10 th, 2004 VENUE 4 a VENUE 7 a VENUE 2 a VENUE 3 a VENUE 6 a 5 a VENUE 8 a VENUE 1 a 12/10/04 6: 00 pm 12/11/04 1: 20 am
 Indiana Air Monitoring Study: Bloomington, IN, January 21 st, 2005 VENUE 2 b VENUE 1 b 1/21/05 6: 14 pm VENUE 3 b VENUE 4 b VENUE 5 b 6 b 7 b VENUE 8 b 1/22/05 1: 34 am
 Bloomington, IN Before and After Clean Indoor Air Law
 annual PM 2. 5") 89% 95% 24 -hour PM 2. 5 standard (65μg/m 3) annual PM 2. 5 standard (15μg/m 3)
89% 95% 24 -hour PM 2. 5 standard (65μg/m 3) annual PM 2. 5 standard (15μg/m 3)
 Indoor Air Quality Before and After the New York State Clean Indoor Air Law in Western New York Hospitality Venues, July to September 2003 Mark Travers, 1 Michael Cummings, 1 James Repace, 2 Andrew Hyland 1 1 Division of Cancer Prevention and Population Sciences, Roswell Park Cancer Institute; Buffalo, New York 2 Repace Associates, Inc. ; Bowie, Maryland
 Change in Air Quality in Western New York Bars and Restaurants After Implementation of the New York State Clean Indoor Air Law Before Law: Average = 412 μg/m 3 After Law: Average = 27 μg/m 3 Only venue with active smoking during post-law sampling Mean size of venue = 365 m 3 Mean pre-law active smoker density = 1. 38 cigs/100 m 3
 Change in Air Quality in Western New York Large Recreation Venues After Implementation of the New York State Clean Indoor Air Law Before Law: Average = 101 μg/m 3 After Law: Average = 18 μg/m 3 Mean size of venue = 3, 530 m 3 Mean pre-law active smoker density = 0. 22 cigs/100 m 3
 Average Particle Concentration versus Average Smoking Density r=0. 421
 Average Particle Concentration versus Average Smoking Density by Ventilation ACH 1. 0
 Results • Case studies – One bar/restaurant after smoking ban goes into effect – One bar with a designated smoking room
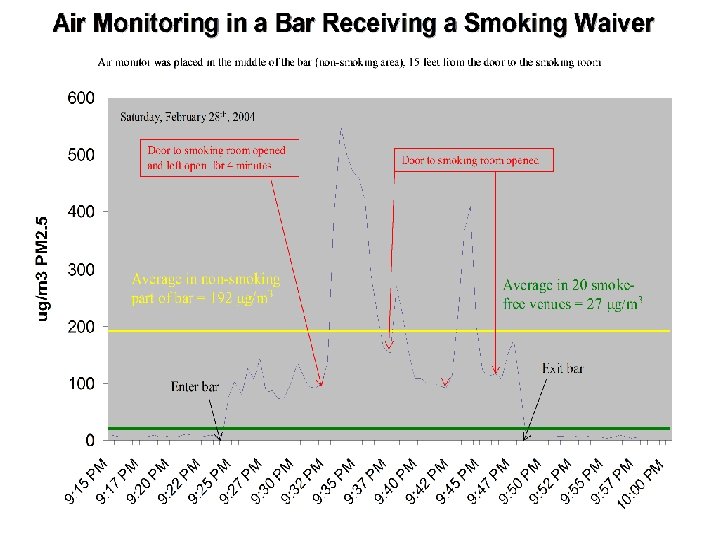
 Air Quality Over Time in a Western New York Bar Normal smoking night of July 18 th Limited smoking night of July 23 rd Midnight July 24 th, smoking stops, new law in effect
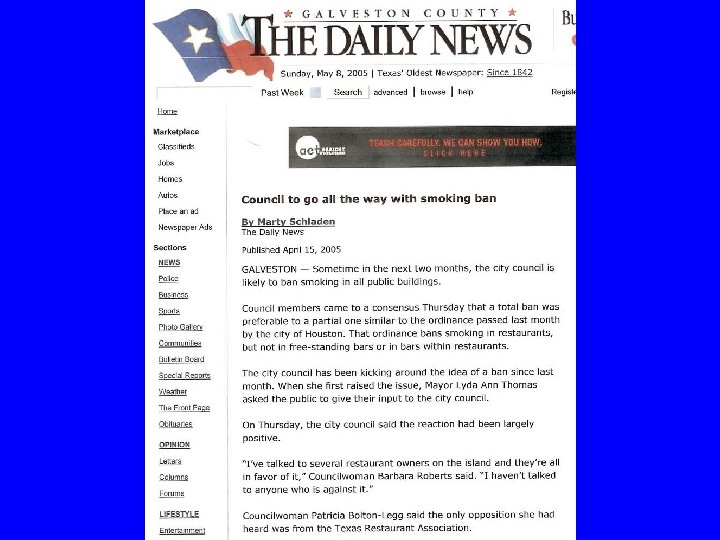
 Influencing Policy Decisions • Media • Politicians • The Public
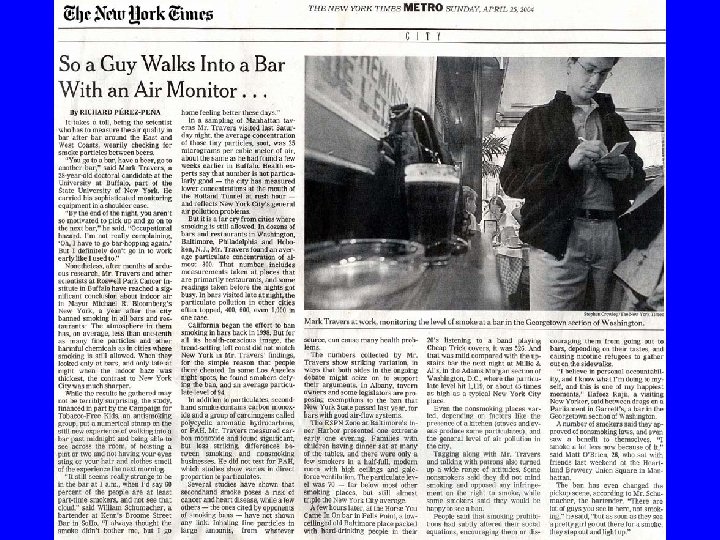
 Summary • The TSI Side. Pak is a is scientifically valid and effective tool for real-time PM 2. 5 monitoring in SHS studies • Can show immediate, direct causal link between smoking and fine particle air pollution • With some expert training and guidance lay persons can collect data in their own communities • Simple environmental monitoring studies can be powerful in policy debates
 Equipment Availability • Rent – Ashtead Technologies – http: //www. ashtead-technology. com/ • Buy – TSI Inc. – http: //www. tsi. com • Borrow – Roswell Park Cancer Institute
 Contact • Mark Travers – Roswell Park Cancer Institute – Mark. travers@roswellpark. org – (716) 845 -5881 work – (716) 868 -4784 cel – (716) 845 -8487 fax
 – Charge") Summary- What you have to do • Prepare Side. Pak (3 steps) – Charge battery – Clean and grease the impactor – Zero calibrate • Start logging data (record the time!) • Lock the Side. Pak keypad • Visit venues and record observations – – – Times of entry, counts and exit Count # people every 15 minutes Count # burning cigarettes every 15 minutes Take notes on who, what, where, and when Measure room volumes (use sonic measure) A few descriptive sentences on each place • Buy something in each place you visit (be a patron) • Try and spend at least 5 minutes outside between venues
Summary- What you have to do • Prepare Side. Pak (3 steps) – Charge battery – Clean and grease the impactor – Zero calibrate • Start logging data (record the time!) • Lock the Side. Pak keypad • Visit venues and record observations – – – Times of entry, counts and exit Count # people every 15 minutes Count # burning cigarettes every 15 minutes Take notes on who, what, where, and when Measure room volumes (use sonic measure) A few descriptive sentences on each place • Buy something in each place you visit (be a patron) • Try and spend at least 5 minutes outside between venues
 Summary- What you have to do • When you’re done monitoring, unlock the Side. Pak keypad • Stop logging (record the time!) • Turn off the device, don’t forget to recharge it for next time • Connect Side. Pak to PC and download the data from the device • Enter your notes/observations into an Excel spreadsheet

 Chicago Air Monitoring Study 2005 National Conference on Tobacco of Health
 METHODS • Conducting Indoor Air Quality Studies Training – Over 50 registrants – 30 Volunteer researchers – Groups of 2 -5 volunteers • What did we ask of participants? – Visit Chicago bars and restaurants for at least 30 minutes – Place a TSI Side. Pak AM 510 Personal Aerosol Monitor to measure air quality in a bag with a small tube protruding to sample the air – Record additional observations
 less than 2. 5 microns") METHODS • Outcome Measures – Respirable Suspended Particles (RSPs) less than 2. 5 microns in diameter (PM 2. 5) – Observations every 15 minutes in each establishment • Number of people present • Number of burning cigarettes • Volume (Zircon DM S 50 Sonic Measure) • Data Collection – Convenience sample of 37 bars and restaurants – Wednesday and Thursday night (6 pm to 12 midnight) – Average duration of 44 minutes
METHODS • Outcome Measures – Respirable Suspended Particles (RSPs) less than 2. 5 microns in diameter (PM 2. 5) – Observations every 15 minutes in each establishment • Number of people present • Number of burning cigarettes • Volume (Zircon DM S 50 Sonic Measure) • Data Collection – Convenience sample of 37 bars and restaurants – Wednesday and Thursday night (6 pm to 12 midnight) – Average duration of 44 minutes
 Average Levels of Indoor Air Pollution
 NCTH Air Monitoring Investigators
 Global Assessment of Secondhand Smoke Air Pollution • Provide collaborators in 20 countries with equipment, training and expert support • Develop global scorecard • Present results at 2006 WCTH in Washington, DC
 Prospective Countries • • • • United States Canada Venezuela Brazil Uruguay United Kingdom Ireland Scotland France Spain Germany Switzerland Italy • • • • Austria Belgium Poland Hungary Russia Greece Turkey Syria Saudia Arabia Egypt Tunisia Côte d’Ivoire Nigeria • • • India Malaysia Thailand China Hong Kong South Korea Australia New Zealand Japan