

7fd1ec06024dd69895a2360074af2878.ppt
- Количество слайдов: 108
 Competition, Competitiveness and Dependence Paper presented in the 3 rd Conference on Global Competition and Competitiveness of Indian Corporates IIM Lucknow (May 29 -31, 2008) Dr. Krishna Kumar Professor of Strategic Management and Director, Indian Institute of Management, Kozhikode
 Why the Issue of Dependence Genesis Autonomy and Sovereignty Issues are Related to External Dependence During 1965 Indo- Pakistan war USA cut off food supply to India under PL 480 Indians had to decide between meals and sovereignty Indians decided to miss the meals to ensure sovereignty
 The Genesis Imperatives, Challenges and Task Requirements for Becoming a Global Player: The Case of India Paper presented in the Conference on Strategic Foundations of Economic Development, Indira Gandhi Institute of Development Research, Mumbai August 1997
 In 1991, the newly elected Prime Minister of India Mr. P. V. Narasimha Rao, announced major changes in government's regulatory policies, to overcome deficiencies in the Indian economic system. The measures aimed at Reducing the restrictions imposed on the Indian industry through reservation licensing etc. , and Opening up the Indian economy to the foreign companies. The foreign investors were also encouraged to invest their capital.
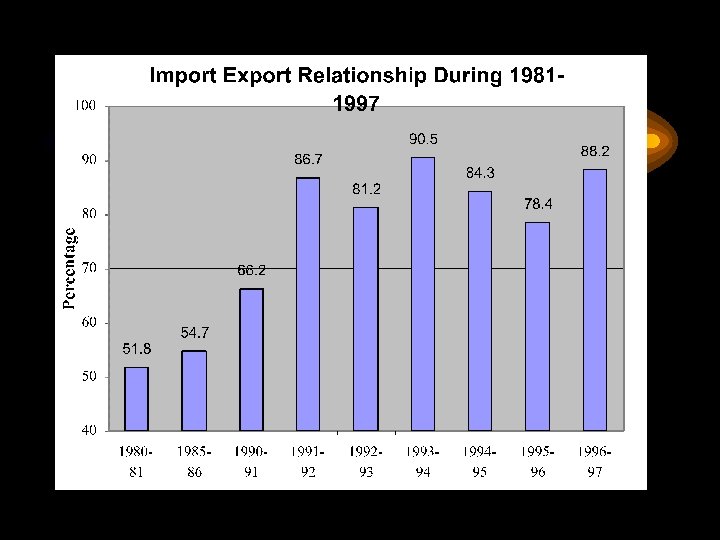
 These measures were expected to make Indian industry more competitive, not only nationally but internationally It was expected that with the economic reform, the country's export/import imbalance would be corrected, the country's balance of payment position would improve and the country will have sufficient balance of foreign exchange to meet the growing requirements of Indian economy. The latter was especially a very attractive proposition. Liberalisation and globalisation became the buzz words, expected to take India to commanding heights in world economy.

 Are the Policies working OK?
 The IIML Business Forum Discussions Year 2000 Bombay Club did not feel every thing was going well Consulting Assignment on Textile and Sugar Corporations The Era of Downsizing & Restructuring Quest for understanding what is going on
 Study on Performance of Indian Corporate Sector
 No. of Companies making Profit or Loss in various years Year Cos. Making Profit loss Cos. Neither making Profit nor Loss 1991 1750 376 71 1996 4281 1151 270 1992 2025 420 105 1997 3906 1751 256 1993 2418 577 173 1998 3632 2105 249 1994 3288 499 247 1999 3571 2266 207 1995 4169 727 324 2000 3176 1725 194
 Gains/ Erosion in Sales Rank & Profitability of the Pre-reform Corporate Leaders of Preliberalisation Era Profitability Sales Rank Gain Loss Total No Change Gains in Profitability 167 385 2 556 Erosion in Profitability 216 750 2 968 No Change 24 70 0 94 407 1205 4 1616 Total
 Study on Foreign Collaborations in India International Conference on Management of R & D, IIT Delhi, January 10 -11, 2003
 Year-wise no. of Foreign Collaboration in India Year # of Year Coll ab # of Year Colla borati borat ons ions # of year Coll abor # of Collabo rations 1951 44 1961 592 1971 232 1981 388 1991 891 1952 40 1962 452 1972 263 1982 579 1992 1407 1953 53 1963 443 1973 264 1983 653 1993 1476 1954 61 1964 521 1974 374 1984 955 1994 1864 1955 81 1965 343 1975 274 1985 798 1995 2337 1956 92 1966 203 1976 273 1986 906 1996 2303 1957 119 1967 179 1977 268 1987 590 1997 2325 1958 169 1968 131 1978 307 1988 648 1998 1786 1959 368 1969 138 1979 268 1989 979 1999 2224 1960 478 1970 185 1980 527 1990 1481 2000 2098 7976 16614 18709 Total 1505 3187 3055
 Number of Collaborating Countries in the Pre and Post -liberalisation Era # collaborations Pre-liberalisation (1951 -91) No. of Cumulat Countries ive Post- liberalisation (1992 -2000) No. of Cumulati Countries ve > 3000 2 2 1 1 > 1000 but <3000 2 4 4* 5* > 500 but <1000 3 7 6 11 > 100 but <500 6 13 13 24 > 50 but <100 6 19 8 31 > 10 but <50 4 23 27 59 > 1 but <10 2 25 55 113 # including NR’s which was nil in pre-liberalization era.
 Unlisted Listed") Corporate Leaders and Foreign Collaborations Sales in year 2000 (Rs. in Cr) Unlisted Listed Companies Comapnies > No. of No. of Collab No. of Firms orat. No. of Collab No. of Collab Firms orat. Top 100 1731. 1 51 475 9 32 60 507 Top 500 315. 4 301 1486 54 214 354 1700 Top 1000 137. 4 545 2260 113 361 658 2621 Top 2000 44. 6 859 2981 317 767 1176 3768 Top 5000 1 1331 3763 1168 2225 2499 5998 Rank Total
Corporate Leaders and Foreign Collaborations Sales in year 2000 (Rs. in Cr) Unlisted Listed Companies Comapnies > No. of No. of Collab No. of Firms orat. No. of Collab No. of Collab Firms orat. Top 100 1731. 1 51 475 9 32 60 507 Top 500 315. 4 301 1486 54 214 354 1700 Top 1000 137. 4 545 2260 113 361 658 2621 Top 2000 44. 6 859 2981 317 767 1176 3768 Top 5000 1 1331 3763 1168 2225 2499 5998 Rank Total
 Is India’s Technological Dependence on the Increase? * Is India Emerging as a Global (Main) Player or becoming Global Market? * What is the Performance of Post- Liberalisation Leaders as Compared to Pre-liberalisation Leaders?
 Types of Foreign Collaborations Over the Years Year Technical Financial Total 17 1999 428 1422 1850 786 1477 2000 316 1730 2046 791 1039 1830 2001 291 1972 2263 1995 984 1350 2334 2002 304 1947 2251 1996 744 1594 2338 2003 292 1421 1713 1997 660 1652 2312 2004 102 1437 1539 1998 603 1176 1779 2005 20 191 211 Total 6236 17724 1992 10 7 1993 691 1994 23960
 Types of Foreign Collaborations Over the Years Year Technical Financial Fin. % 1992 10 7 41% 1999 428 1422 77% 1993 691 786 53% 2000 316 1730 85% 1994 791 1039 57% 2001 291 1972 87% 1995 984 1350 58% 2002 304 1947 86% 1996 744 1594 68% 2003 292 1421 83% 1997 660 1652 71% 2004 102 1437 93% 1998 603 1176 66% 2005 20 191 91%
 Upto 92 93 94") Indian Business Ventures Abroad Over the Years (Up to 1999) Upto 92 93 94 95 96 97 98 99 TOTAL 75 28 79 122 119 143 122 154 233 1075 Joint Ventures (JVs) 244 72 104 92 82 116 101 103 1015 Total 319 100 183 214 201 259 223 255 336 2090 1991 Wholly Owned Subsidiaries (WOS)
Indian Business Ventures Abroad Over the Years (Up to 1999) Upto 92 93 94 95 96 97 98 99 TOTAL 75 28 79 122 119 143 122 154 233 1075 Joint Ventures (JVs) 244 72 104 92 82 116 101 103 1015 Total 319 100 183 214 201 259 223 255 336 2090 1991 Wholly Owned Subsidiaries (WOS)
 Total No. of Cos. Business having Business Corporate Leader's Venturing Abroad Ventures Abroad No. of Companies among Top 1000 Other Smaller Companies Cumulative Frequency Distribution of Ventures 1 171 74 104 1+ 909 2 154 77 77 2+ 738 3 25 25 - 3+ 430 4 17 17 - 4+ 355 5 6 6 - 5+ 287 6 6 6 - 6+ 257 7 2 2 - 7+ 221 8 4 4 - 8+ 207 9 2 2 - 9+ 175 10 2 2 - 10+ 157 11 3 3 - 11+ 137 12 3 3 - 12+ 104 15 2 2 - 15+ 68 18 1 1 - 18+ 38 20 1 1 - 20+ 20 909 399 218 181
 Indian Business Ventures Abroad and Foreign Collaborations in India Corporate Leader's Venturing Abroad Upto 1991 ‘ 92 ‘ 93 ‘ 94 ‘ 95 ‘ 96 ‘ 97 ‘ 98 ‘ 99 Total Upto 1999 Foreign Collaboration in India 16836 1531 1476 1854 2337 2303 2325 1786 2224 32672 Indian JV Abroad 244 72 104 92 82 116 101 111 1023 Indian Wholly Owned Subsidiaries Abroad 75 28 79 122 119 143 122 154 238 1080 Total Indian Business Ventures Abroad 319 100 183 214 201 259 223 255 349 2103
 Is India Globalising Inwardly?
 Sorry Data not Available any more in Public Domain For Indian Business Ventures Abroad in any Structure Database For analysis purpose
 If Indian Companies are following the same strategy after liberalisation as in the preliberalisation era, do we expect a different performance pattern? * What is the Performance of Post- Liberalisation Leaders as Compared to Pre-liberalisation Leaders
 Comparative Profit Performance of Pre and Post Reform Corporate Leaders Cos. In Profit 1991 Total N 0. of Cos 1991 1992 1993 1994 1995 1996 1997 1998 1999 2000 2001 38 1696 1669 1573 1645 1691 1619 1461 1327 1203 1160 1000 293 298 289 304 285 261 225 194 191 165 448 501 518 457 374 340 287 289 241 685 760 675 561 477 438 441 342 764 786 593 516 476 503 366 351 339 270 269 274 216 235 236 188 201 146 193 205 150 106 303 304 230 217 208 316 New Cos. Entering 2001 488 New Cos. Entering 2000 328 New Cos. Entering 1999 431 New Cos. Entering 1998 584 New Cos. Entering 1997 1128 New Cos. Entering 1996 962 New Cos. Entering 1995 658 New Cos. Entering 1994 403 New Cos. Entering 1993 2151 New Cos. Entering 1992 5336 92 -2001 Cos. 19 2039
 1991 1992 1993 1994 1995 1996 1997 1998 1999") Cos. In Profit (%) 1991 1992 1993 1994 1995 1996 1997 1998 1999 2000 2001 Total N 0. of Cos 1991 New Cos. Entering 1992 403 73% 74% 72% 75% 71% 65% 56% 48% 47% 41% New Cos. Entering 1993 658 68% 76% 79% 69% 57% 52% 44% 37% New Cos. Entering 1994 962 71% 79% 70% 58% 50% 46% 36% New Cos. Entering 1995 1128 68% 70% 53% 46% 42% 45% 32% New Cos. Entering 1996 584 60% 58% 46% 47% 37% New Cos. Entering 1997 431 55% 44% 47% 34% New Cos. Entering 1998 328 59% 63% 46% 32% New Cos. Entering 1999 488 62% 47% New Cos. Entering 2000 316 69% 66% New Cos. 2151 79% 78% 73% 76% 79% 75% 68% 62% 56% 54% 46%
Cos. In Profit (%) 1991 1992 1993 1994 1995 1996 1997 1998 1999 2000 2001 Total N 0. of Cos 1991 New Cos. Entering 1992 403 73% 74% 72% 75% 71% 65% 56% 48% 47% 41% New Cos. Entering 1993 658 68% 76% 79% 69% 57% 52% 44% 37% New Cos. Entering 1994 962 71% 79% 70% 58% 50% 46% 36% New Cos. Entering 1995 1128 68% 70% 53% 46% 42% 45% 32% New Cos. Entering 1996 584 60% 58% 46% 47% 37% New Cos. Entering 1997 431 55% 44% 47% 34% New Cos. Entering 1998 328 59% 63% 46% 32% New Cos. Entering 1999 488 62% 47% New Cos. Entering 2000 316 69% 66% New Cos. 2151 79% 78% 73% 76% 79% 75% 68% 62% 56% 54% 46%
 Fragility of Indian Companies Increasing
 Trends in Fragility Rising fragility of the firms in the Indian Corporate Sector Overall Fragility Index during 1991 - 1996 Fragility Index during 1997 - 2003 Fragility Index of 1991 Cos. 33% Fragility Index of 1992 -2000 Cos. 21% 29% 43% 53% 48%
 Cos. Making Profit Year GFA Cumulati ve (Rs. in") ( In Different Performance Categories) Cos. Making Profit Year GFA Cumulati ve (Rs. in Cror No. of Cos. es) Cos. Making Loss (Rs. in Cror es) GFA Cos. Not Reporting GFA Cumulati ve (Rs. in Cror No. of Cos. es) (Rs. in Cror es) . GFA Cumulati ve No. of Cos. (Rs. in Cror es) 1991 1000 533505 688 172923 465 73290 1992 168 21344 120 12391 115 16814 1993 250 50289 71633 181 10282 22673 227 8851 25665 1994 350 15943 87576 270 18692 41366 342 8850 34516 1995 382 14594 102170 275 11434 52800 471 8929 43445 1996 229 8762 110933 124 2934 55734 231 8664 52109 1997 155 6405 117338 92 2970 58704 184 4194 56303 1998 112 3597 120936 62 8455 67160 154 2468 58771 1999 247 10964 131900 95 6053 73213 146 2812 61583 2000 219 4163 136063 86 2418 75631 11 816 62399 2001 25 5794 141857 13 420 76051 Total 2112 141857 1305 76051 1881 62399 Grand Tota l 3112 675362 1993 248973 2346 135689
( In Different Performance Categories) Cos. Making Profit Year GFA Cumulati ve (Rs. in Cror No. of Cos. es) Cos. Making Loss (Rs. in Cror es) GFA Cos. Not Reporting GFA Cumulati ve (Rs. in Cror No. of Cos. es) (Rs. in Cror es) . GFA Cumulati ve No. of Cos. (Rs. in Cror es) 1991 1000 533505 688 172923 465 73290 1992 168 21344 120 12391 115 16814 1993 250 50289 71633 181 10282 22673 227 8851 25665 1994 350 15943 87576 270 18692 41366 342 8850 34516 1995 382 14594 102170 275 11434 52800 471 8929 43445 1996 229 8762 110933 124 2934 55734 231 8664 52109 1997 155 6405 117338 92 2970 58704 184 4194 56303 1998 112 3597 120936 62 8455 67160 154 2468 58771 1999 247 10964 131900 95 6053 73213 146 2812 61583 2000 219 4163 136063 86 2418 75631 11 816 62399 2001 25 5794 141857 13 420 76051 Total 2112 141857 1305 76051 1881 62399 Grand Tota l 3112 675362 1993 248973 2346 135689
") Total Assets Locked in the Companies Making Loss/ Not Reporting Performance (Rs. In Crores) GFA GFA Making Loss Making Not reporting Total (LM & NR) 675362 248973 135689 384662 (36. 2%) Profit
Total Assets Locked in the Companies Making Loss/ Not Reporting Performance (Rs. In Crores) GFA GFA Making Loss Making Not reporting Total (LM & NR) 675362 248973 135689 384662 (36. 2%) Profit
 Collapse of Financial Institutions 2001 -02 IFCI, IDBI, UTI, ICICI
 2001 $ mn 2003 2004 2005 6. 8 6. 9 12. 5 12. 4 11. 1 118% % OF FOREIGN EQUITY (BY NO) 2002 91% 102% 99% 2271 1840 1869 1848 2198
 Increasing") Secondary /Tertiary Impacts 1. Collapse of Development Banks (IFCI, IDBI, UTI, ICICI etc) Increasing dependence on external funds 2. Reduction in interest rate- inflation rate difference Pensioners, retired persons not taken care EPF rates down (few investment opportunities for ordinary persons) 3. Unsustainable deficits now even in central government 4. Where the investment is going, if not in corporate sector
Secondary /Tertiary Impacts 1. Collapse of Development Banks (IFCI, IDBI, UTI, ICICI etc) Increasing dependence on external funds 2. Reduction in interest rate- inflation rate difference Pensioners, retired persons not taken care EPF rates down (few investment opportunities for ordinary persons) 3. Unsustainable deficits now even in central government 4. Where the investment is going, if not in corporate sector
 2, 001 -6633 Rise 2, 002 -7208 109% 2,") Year Trade Gap US$ mn) 2, 001 -6633 Rise 2, 002 -7208 109% 2, 003 -13729 207% 2, 004 -21661 327% 2, 005 -38721 584% 2, 006 -51370 774% 2, 007 -64764 976%
Year Trade Gap US$ mn) 2, 001 -6633 Rise 2, 002 -7208 109% 2, 003 -13729 207% 2, 004 -21661 327% 2, 005 -38721 584% 2, 006 -51370 774% 2, 007 -64764 976%
 The Emerging Patterns on Balance of Payment
 Will software industry be able to support trade gap?
 Sales Top 50 40810 Total 242 Foreign Equity>40% 9") Software Industry (Rs. In Crores) Sales Top 50 40810 Total 242 Foreign Equity>40% 9 Equity > 30% 5 6 39% 43761 4%
Software Industry (Rs. In Crores) Sales Top 50 40810 Total 242 Foreign Equity>40% 9 Equity > 30% 5 6 39% 43761 4%
 Study on Corporate Tax Payment Patterns
 Year Compan y Reporti") Performance of Corporate Sector During 1990 -2005 (Rs. in Crores) Year Compan y Reporti Total income Tax PBT Divid end Total income Tax Provisio Provisi % Rise PBT Tax/ PBT 1990 221798 2751 11048 1755 1991 2074 282667 3168 12385 2078 127% 115% 112% 26% 1992 2379 341561 4546 15620 2578 121% 143% 126% 29% 1993 2930 400031 4752 14822 3025 117% 105% 95% 32% 1994 3873 456958 5606 22798 4255 114% 118% 154% 25% 1995 4972 594400 7236 43386 6052 130% 129% 190% 17% 1996 5429 731804 10683 52319 7688 123% 148% 121% 20% 1997 5567 824782 15013 52656 8841 113% 141% 101% 29% 1998 5767 906976 16870 57123 9923 110% 112% 108% 30% 1999 6253 1006054 16631 50941 11329 111% 99% 89% 33% 2000 6628 1185984 19825 60648 13122 118% 119% 33% 2001 6890 1419459 23008 65401 16072 120% 116% 108% 35% 2002 7527 1477116 33121 82419 18280 104% 144% 126% 40% 2003 7720 1638635 45335 122506 24455 111% 137% 149% 37% 2004 6806 1780649 54268 177693 29222 109% 120% 145% 31% 2005 1471 5057 1973190 60180 220031 35859 111% 124% 27% 116% 124% Average Rise 25%
Performance of Corporate Sector During 1990 -2005 (Rs. in Crores) Year Compan y Reporti Total income Tax PBT Divid end Total income Tax Provisio Provisi % Rise PBT Tax/ PBT 1990 221798 2751 11048 1755 1991 2074 282667 3168 12385 2078 127% 115% 112% 26% 1992 2379 341561 4546 15620 2578 121% 143% 126% 29% 1993 2930 400031 4752 14822 3025 117% 105% 95% 32% 1994 3873 456958 5606 22798 4255 114% 118% 154% 25% 1995 4972 594400 7236 43386 6052 130% 129% 190% 17% 1996 5429 731804 10683 52319 7688 123% 148% 121% 20% 1997 5567 824782 15013 52656 8841 113% 141% 101% 29% 1998 5767 906976 16870 57123 9923 110% 112% 108% 30% 1999 6253 1006054 16631 50941 11329 111% 99% 89% 33% 2000 6628 1185984 19825 60648 13122 118% 119% 33% 2001 6890 1419459 23008 65401 16072 120% 116% 108% 35% 2002 7527 1477116 33121 82419 18280 104% 144% 126% 40% 2003 7720 1638635 45335 122506 24455 111% 137% 149% 37% 2004 6806 1780649 54268 177693 29222 109% 120% 145% 31% 2005 1471 5057 1973190 60180 220031 35859 111% 124% 27% 116% 124% Average Rise 25%
 CT/PBT Ration of Profit Making Companies Only CT/ PBT Ratio PBT/ TI Ratio 2002 2003 2004 2005 2006 Manufacturing 28% 29% 26% 27% 22% 9% 10% 11% Banking 33% 36% 29% 27% 23% 30% 29% 27% 23% Financial 21% 26% 17% 14% 26% 27% 38% 57% 45% Services 19% 28% 26% 17% 13% 10% 12% 13% IT Sector 10% 13% 12% 12% 24% 22% 23% Others 19% 28% 26% 17% 13% 10% 12% 13% Total Profit Making Cos. 4326 4668 4577 3701 3356
 Year TAX/PBT Estimated Ratio Tax Loss Estimated Tax at Tax / PBT Ratio 40% 2002 40% 2003 37% 49003 3668 2004 31% 71077 16809 2005 27% 88012 27832 Estimated Tax Fall 48309 Increase in Tax 2002 -05 27059 Net Tax Fall 21251
 The Next Generation Reform?
 FDI Chai The Balance of Payment Issues Forex Reserves Rising? How
 Forex Exchange Reserves are by and large created by Investments, Loans and Banking Capitals (i. e. through Capital Account), not by Current Account (i. e. Merchandise Trade, Software or even Private transfers)
 Even in Capital Account 48. 5% is constituted by Loans and Banking Capital (which are to be returned). It is incidence is to be fully realized 30% of Total Forex reserves come from Portfolio Investments, which is vulnerable to flight overnight happened in 1991
 Software services were giving hopes in 2000 -04 period that they shall be able to meet the challenge of trade deficit, but that hope has been belied as the software service share has fallen from 90% (in 2003 -04) to 43% (in 2006 -07) of the bugeoning trade deficit.
 The contribution of Private Transfers has been to the tune of 105% of Forex Reserve It is to be seen what % of this (if any) is transferable, through current account
 of") A sum of U. S. $ 171 bn (almost 40% of annual budget) of the Government of India has entered the country in the last 4 years which has affected the real estate, financial markets, to make India look shining, which is not the true picture (!). India is increasingly dependent for every day affair to outsiders
A sum of U. S. $ 171 bn (almost 40% of annual budget) of the Government of India has entered the country in the last 4 years which has affected the real estate, financial markets, to make India look shining, which is not the true picture (!). India is increasingly dependent for every day affair to outsiders
 Amount in Rs. Crores Year Balance Ex/i") India's Balance of Trade Corporate Sector (CMIE) Amount in Rs. Crores Year Balance Ex/i m Ratio Export Import Balanc e Jan. Dec Export Import 2001 150177 181539 -31362 83% 111080 194227 -83147 2002 239686 274672 -34986 87% 117007 194744 2003 267380 331167 -63788 81% 140439 2004 2005 Corporates' Contribution 342284 438264 440480 609000 -98195 -170737 78% 179270 72% 2006 548066 781669 -233602 70% 2007 395625 576107 -180482 69% 249712 Source: RBI 294543 Expo rt Impor t Balan ce 57% 74% 107% -265% -77737 60% 49% 71% -222% 230233 -89794 61% 53% 70% -141% 280367 101097 64% 52% 64% -103% 405608 155896 62% 57% 67% -91% 506457 211914 58% 54% 65% -91% Source: Prowess (dt. 171007) Ex/im Ratio
India's Balance of Trade Corporate Sector (CMIE) Amount in Rs. Crores Year Balance Ex/i m Ratio Export Import Balanc e Jan. Dec Export Import 2001 150177 181539 -31362 83% 111080 194227 -83147 2002 239686 274672 -34986 87% 117007 194744 2003 267380 331167 -63788 81% 140439 2004 2005 Corporates' Contribution 342284 438264 440480 609000 -98195 -170737 78% 179270 72% 2006 548066 781669 -233602 70% 2007 395625 576107 -180482 69% 249712 Source: RBI 294543 Expo rt Impor t Balan ce 57% 74% 107% -265% -77737 60% 49% 71% -222% 230233 -89794 61% 53% 70% -141% 280367 101097 64% 52% 64% -103% 405608 155896 62% 57% 67% -91% 506457 211914 58% 54% 65% -91% Source: Prowess (dt. 171007) Ex/im Ratio
 and Non- Corporate Sector which was supporting balancing adverse merchandise") Other Corporates (Outside Prowess) and Non- Corporate Sector which was supporting balancing adverse merchandise related adversity, is losing ground.
Other Corporates (Outside Prowess) and Non- Corporate Sector which was supporting balancing adverse merchandise related adversity, is losing ground.
 is") Fast growth (following philosophy of catching up by latching up use external resources) is making India increasingly dependent on foreign resources bases (technology and financial). It is also resulting in distortions in payment terms (initiated by software industry), and resources allocation
Fast growth (following philosophy of catching up by latching up use external resources) is making India increasingly dependent on foreign resources bases (technology and financial). It is also resulting in distortions in payment terms (initiated by software industry), and resources allocation
 Skilled Manpower not going to desired sectors (IIM & IIT boys for financial, consulting and software sectors). IIMs IITs unable to increase intake? Choking of supply side resulting in extraordinary hikes in costs (construction costs up 50% due to shortage of steel and cement, caused partly by exports)
 Crude prices hitting the roof. How India is going to cope with balance of payment issue? Cost of infrastructure extremely high, making among individuals richest in the world but prices sour due to demand supply gap Inflation going out of control. Fin. Minister washes off hand. Everyone hoping god will help it contain. When country is facing crisis, Media is busy keeping people engrossed in cricket or murder cases
 Return of Wazid Ali Shah Days
 Allowing/ Protecting Allowing/ Protecting Academic Demading/ protecting Legislature De m a Pro nding/ tect ing / ing and ng m De tecti Pro Executive Al Pr lowi ote ng cti / ng Firm INDUSTRY / nding Dema ting Protec Press Allowing/ Protecting De m Pro andi tec ng/ tin g Judiciary g/ i n ng w lo cti Al ote Pr External determinants of competitiveness
 Thank You
 Table 5 Share of Leaders in the Different Parameters in the year 2001 Top Sales Profits Gross Exports Fixed Assets Imports Net Export 100 59% 91% 53% 42% 67% -98% 500 83% 119% 77% 71% 88% -107% 1000 91% 122% 86% 84% 94% -106% 2000 97% 113% 92% 96% 95% -101% 5141 100% 100% 12, 28, 927 41, 216 9, 24, 336 1, 05, 077 1, 91, 150 -86, 073 Total 5141 (Rs. in Crores)
 The government of India initiated economic reforms as an aftermath of a serious foreign exchange crisis in 1991, which were further accelerated when the World Trade Organization came in existence in 1995 with India as a founder member. The three major planks (LPG) of the economic reforms have been: (a) Internal and External Liberalization (b) Privatization and (c) Globalization. It was assumed/ expected, inter-alia, that these reforms will increase the global competitiveness of Indian industry, improve the economic prosperity of masses and avert possibility of any foreign exchange crisis in the future.
 Issues For Discussion 1. Competition in the Indian Corporate Sector has increased manifold since economic reform and external liberalisation started in 1991. 2. How is that impacting the Indian Corporate sector? 3. What are secondary and tertiary effects of the same? 4. Are there trends, which need careful watched and policy measures taken so that fruits of liberalisation are realised in a sustainable manner? 5. What is the role of academicians in this?
 The intensity of competition in the Indian Industry is increasing and existing Indian players have to work hard at staving off foreign competition as well as increased competition locally The competition is not merely on an increasing trajectory, the very nature of this competition is also changing.
 Changing Nature and Intensity of Competition 1. Rapid increase in number of competitors. (3 - 50 times, average 12 times from 1991 -2001) 2. Competitors emerging from unexpected quarters. 3. Increase in number of foreign players. 4. Increase in number of countries of foreign players 5. Foreign players are serious to do business, interest not limited to investment only. 6. Foreign players have strong technical, financial and managerial power. 7. Innovation is name of the game, and it is not limited to product or service, but permeates the entire value chain and all the functional areas
 No.") Table 1 Increase in Intensity of Competition Increase in No. of Players (times) No. of Industry Sectors 1 -2 2 -3 22 88 3 -4 77 4 -5 5 -10 44 55 10 -20 11 >20 11 Total Industry Sectors 28 Average 3. 81 Times
Table 1 Increase in Intensity of Competition Increase in No. of Players (times) No. of Industry Sectors 1 -2 2 -3 22 88 3 -4 77 4 -5 5 -10 44 55 10 -20 11 >20 11 Total Industry Sectors 28 Average 3. 81 Times
 Number of Collaborating Countries in the Pre and Post -liberalisation Era # collaborations Pre-liberalisation (1951 -91) No. of Cumulat Countries ive Post- liberalisation (1992 -2000) No. of Cumulati Countries ve > 3000 2 2 1 1 > 1000 but <3000 2 4 4* 5* > 500 but <1000 3 7 6 11 > 100 but <500 6 13 13 24 > 50 but <100 6 19 8 31 > 10 but <50 4 23 27 59 > 1 but <10 2 25 55 113 # including NR’s which was nil in pre-liberalization era.
 Foreign Collaboration s in the Post-liberalisation Era by Type YEAR TYPE FIN TOTAL 1407 FIN % 1992 639 TECH 768 1993 785 691 1476 53% 1994 1062 792 1854 57% 1995 1996 1997 1998 1999 2000 1353 1557 1664 1185 1726 1684 984 746 661 601 498 414 2337 2303 2325 1786 2224 2098 58% 68% 72% 66% 78% 80% TOTAL 11642 6155 17810 65% 45%
 What is the Impact on Firms Indian Corporate Sector ?
 Data used is from PROWESS Developed by CMIE Mumbai Whole Industry set is used than sample
 % of profit making companies 1991 -2003 # of co. s 1991 companies 2025 1992 companies 391 1993 companies 619 1994 companies 953 1995 companies 1164 1996 companies 596 1997 companies 394 1998 companies 264 1999 companies 424 2000 companies 374 2001 companies 268 2002 230 199 1 80 199 2 199 3 199 4 199 5 199 6 199 7 199 8 199 9 2000 200 1 200 2 200 3 80 75 78 81 78 70 63 58 56 52 50 48 75 74 73 78 73 66 57 49 49 45 45 41 70 78 79 72 58 51 45 46 42 38 36 71 80 70 59 49 46 47 40 41 40 69 71 51 43 40 44 37 36 33 60 55 43 43 45 42 42 37 52 52 44 49 42 42 33 56 62 53 50 47 39 63 64 58 49 42 70 70 54 47 62 59 46 51 55
 Central Govt. PSUs A State Govt. PSUs State &") Sectoral Performance —Overall (1991 -2003) Central Govt. PSUs A State Govt. PSUs State & Pvt. Sector (Joint Sector) Private (Foreign) Taken over PSU Cooperative Sector Private Sector (Individual) Private Sector (Business Groups) NRI Business Houses B C D G J P P Gr. H Loss Not Profit making Repor Making ting 28% 16% 57% 28% 25% 22% 59% 0% 29% 67% 35% 33% 25% 18% 24% 35% 26% 33% 37% 42% 53% 23% 76% 36% 44% 0%
Sectoral Performance —Overall (1991 -2003) Central Govt. PSUs A State Govt. PSUs State & Pvt. Sector (Joint Sector) Private (Foreign) Taken over PSU Cooperative Sector Private Sector (Individual) Private Sector (Business Groups) NRI Business Houses B C D G J P P Gr. H Loss Not Profit making Repor Making ting 28% 16% 57% 28% 25% 22% 59% 0% 29% 67% 35% 33% 25% 18% 24% 35% 26% 33% 37% 42% 53% 23% 76% 36% 44% 0%
 Profit Making Central Govt. PSUs 1991 92 -2003 56% 60% State Govt. PSUs State & Pvt. Sector (Joint Sector) Private (Foreign) Taken over PSU Cooperative Sector Private Sector (Individual) Private Sector (Business Groups) 36% 44% 63% 19% 33% 39% 50% 38% 40% 45% 100% 83% 36% 40%
 Cos. Making Profit Year GFA Cumulati ve (Rs. in") ( In Different Performance Categories) Cos. Making Profit Year GFA Cumulati ve (Rs. in Cror No. of Cos. es) Cos. Making Loss (Rs. in Cror es) GFA Cos. Not Reporting GFA Cumulati ve (Rs. in Cror No. of Cos. es) (Rs. in Cror es) . GFA Cumulati ve No. of Cos. (Rs. in Cror es) 1991 1000 533505 688 172923 465 73290 1992 168 21344 120 12391 115 16814 1993 250 50289 71633 181 10282 22673 227 8851 25665 1994 350 15943 87576 270 18692 41366 342 8850 34516 1995 382 14594 102170 275 11434 52800 471 8929 43445 1996 229 8762 110933 124 2934 55734 231 8664 52109 1997 155 6405 117338 92 2970 58704 184 4194 56303 1998 112 3597 120936 62 8455 67160 154 2468 58771 1999 247 10964 131900 95 6053 73213 146 2812 61583 2000 219 4163 136063 86 2418 75631 11 816 62399 2001 25 5794 141857 13 420 76051 Total 2112 141857 1305 76051 1881 62399 Grand Tota l 3112 675362 1993 248973 2346 135689
( In Different Performance Categories) Cos. Making Profit Year GFA Cumulati ve (Rs. in Cror No. of Cos. es) Cos. Making Loss (Rs. in Cror es) GFA Cos. Not Reporting GFA Cumulati ve (Rs. in Cror No. of Cos. es) (Rs. in Cror es) . GFA Cumulati ve No. of Cos. (Rs. in Cror es) 1991 1000 533505 688 172923 465 73290 1992 168 21344 120 12391 115 16814 1993 250 50289 71633 181 10282 22673 227 8851 25665 1994 350 15943 87576 270 18692 41366 342 8850 34516 1995 382 14594 102170 275 11434 52800 471 8929 43445 1996 229 8762 110933 124 2934 55734 231 8664 52109 1997 155 6405 117338 92 2970 58704 184 4194 56303 1998 112 3597 120936 62 8455 67160 154 2468 58771 1999 247 10964 131900 95 6053 73213 146 2812 61583 2000 219 4163 136063 86 2418 75631 11 816 62399 2001 25 5794 141857 13 420 76051 Total 2112 141857 1305 76051 1881 62399 Grand Tota l 3112 675362 1993 248973 2346 135689
 There is need for a tool to identify and measure cases of instability The fragility' index is defined as the ratio of the number of years a company was not reporting profit (x) to the total number of years since the company came into the database
 47.") Performance of Private vs. Public Sector-Fragility Index Measure Fl Average of Private (Indian-Individual) 47. 4 Average of Private (Indian-Group) Private 39. 66 Average of Private (Foreign) 32. 86 Average of Private sector overall 44. 03 Average of Central govt Average of State govt Average of Public sector overall 38. 26 56. 51 43. 15
Performance of Private vs. Public Sector-Fragility Index Measure Fl Average of Private (Indian-Individual) 47. 4 Average of Private (Indian-Group) Private 39. 66 Average of Private (Foreign) 32. 86 Average of Private sector overall 44. 03 Average of Central govt Average of State govt Average of Public sector overall 38. 26 56. 51 43. 15
 Performance of Groups-Fragility Index Measure Overall. Groups Indian Groups Foreign Groups Overall Average 39. 58 Average of pre 1991 firms 30. 01 Average of post 1991 46. 14 firms* 39. 66 29. 94 46. 32 37. 78 31. 35 44. 22 Average of post 1996 firms* 50. 08 46. 22 49. 91
 Year wise Performance of groups-Fragility Index GROUPS-Indian Fl GROUPS-Foreign Year no of firms Fl Fl 1991 1098 30. 05 1045 29. 94 53 31. 35 1992 179 36. 83 175 37. 05 4 27. 08 1993 220 41. 07 215 41. 01 5 43. 64 1994 212 42. 83 208 43. 22 4 22. 50 1995 228 49. 95 222 49. 7 6 59. 26 1996 166 47. 97 160 48. 36 6 37. 50 1997 137 56. 41 132 56. 49 5 54. 29 1998 127 49. 21 117 49. 57 10 50. 00 1999 124 49. 19 119 48. 74 5 60. 00 2000 75 49. 00 71 50. 7 4 18. 75 2001 55 44. 85 52 45. 5 3 33. 33 2002 49 47. 96 48 46. 87 1 100 2003 6 50. 00 0 NA
 # of cos. Size GFA Fragility Category NN LL MM HH VV EE Total 0 -10 10 -25 25 -50 50 -75 75 -100 GFA Sizs % Rs. in Cr. s Cat >10, 000 MI 16 456519 35% 11 1 0 2 16 5000 -10000 EI 24 162369 13% 9 2 3 4 1 5 24 1000 -5000 VI 124 264764 21% 43 19 23 13 8 18 124 500 -1000 II 167 117314 9% 52 17 26 34 18 20 167 100 -500 SI 840 180934 14% 223 100 134 200 93 90 840 50 -100 LI 696 48474 4% 140 66 110 211 95 74 696 25 -50 OK 807 28455 2% 141 61 108 228 174 95 807 10 -25 SK 1315 21314 2% 176 66 188 339 296 250 1315 5 -10 OO 972 7029 1% 117 35 136 267 218 199 972 0 -5 TI 2423 4086 0% 252 46 296 614 608 607 2423 0 GC 335 0 0% 335 7719 1291258 100 crs + 1171 1181900 % 15. 17% 91. 53% 0% 7719
 Fragility Category Size GFA Rs. in Cr. s 0 Sizs Cat <10 but >0 NN LL <25 but >10 <50 but >25 <75 but >50 MM HH VV <100 but >75 EE >10000 MI 360418 21536 14542 27919 5000 -10000 EI 57999 17375 21302 25554 6752 33387 1000 -5000 VI 95311 44363 46816 21949 15829 40497 500 -1000 II 37557 12448 17754 24059 11786 13710 100 -500 SI 49890 21626 26624 42082 20255 20457 50 -100 LI 9673 4501 7571 14935 6433 5362 25 -50 OK 5020 2126 3850 8161 6088 3210 10 -25 SK 2779 1058 3146 5528 4858 3945 5 -10 OO 876 241 987 1920 1574 1431 0 -5 TI 386 76 523 1048 1051 1002 0 GC 0 0 0 619908 125350 143116 173154 74625 155105 Total 1291258 32103
 229730 18%") Fragility Index GFA Rs. in crores # of Companies Fragile (Index >50%) 229730 18% 3074 40% Fragile (Index >25%) 402884 31% 5046 65%
Fragility Index GFA Rs. in crores # of Companies Fragile (Index >50%) 229730 18% 3074 40% Fragile (Index >25%) 402884 31% 5046 65%
 1999 -00 2000 -01 2001 -02 (I+II+III) 2, 155 4,") 2002 -03 (R) 1999 -00 2000 -01 2001 -02 (I+II+III) 2, 155 4, 029 6, 130 5, 035 4, 673 I. 2, 155 2, 400 4, 095 2, 764 2, 387 3, 026 2, 760 2, 021 979 11, 377 768 831 477 600 459 2, 135 1, 847 1, 505 377 10, 918 123 8 2 3 9 2 — 5, 181 6, 789 8, 151 6, 014 16, 050 Direct Investment Equity (a+b+c+d+e) Portfolio Investment (a+b+c) a. GDRs/ADRs # # b. FIIs ** c. Offshore funds and others (A+B) 2003 -04 (P) 1991 -04 00 -04 27129 13, 801 35629 20, 163 24475 16, 782 87233 42, 185
2002 -03 (R) 1999 -00 2000 -01 2001 -02 (I+II+III) 2, 155 4, 029 6, 130 5, 035 4, 673 I. 2, 155 2, 400 4, 095 2, 764 2, 387 3, 026 2, 760 2, 021 979 11, 377 768 831 477 600 459 2, 135 1, 847 1, 505 377 10, 918 123 8 2 3 9 2 — 5, 181 6, 789 8, 151 6, 014 16, 050 Direct Investment Equity (a+b+c+d+e) Portfolio Investment (a+b+c) a. GDRs/ADRs # # b. FIIs ** c. Offshore funds and others (A+B) 2003 -04 (P) 1991 -04 00 -04 27129 13, 801 35629 20, 163 24475 16, 782 87233 42, 185
 2001 $ mn 2003 2004 2005 6. 8 6. 9 12. 5 12. 4 11. 1 118% % OF FOREIGN EQUITY (BY NO) 2002 91% 102% 99% 2271 1840 1869 1848 2198
 Increasing") Secondary /Tertiary Impacts 1. Collapse of Development Banks (IFCI, IDBI, UTI, ICICI etc) Increasing dependence on external funds 2. Reduction in interest rate- inflation rate difference Pensioners, retired persons not taken care EPF rates down (few investment opportunities for ordinary persons) 3. Unsustainable deficits now even in central government 4. Where the investment is going, if not in corporate sector
Secondary /Tertiary Impacts 1. Collapse of Development Banks (IFCI, IDBI, UTI, ICICI etc) Increasing dependence on external funds 2. Reduction in interest rate- inflation rate difference Pensioners, retired persons not taken care EPF rates down (few investment opportunities for ordinary persons) 3. Unsustainable deficits now even in central government 4. Where the investment is going, if not in corporate sector
 • TECHNOLOGICAL DISADVANTAGES The technological competence stems for three centuries old Industrial revolution. The MNcs take the lead in invention and then develop technology to scaling up the level of operations. • EXCHANGE RATE DISADVANTAGES puts a disadvantage for creating infrastructure for business in a developed country. Disadvantage in terms of losing local supply of the domestic companies also figures clearly. • SIZE DISADVANTAHES A typical international player is several hundred times larger than the domestic players. • POWER TO DECIDE THE RULES OF GAME The size of MNCs also influences the trade negotiations, as the international trade by major players in the developing countries form an insignificant amount to let them have a major say in the negotiations
 • POWER TO CREATE MYTHS LIKE –INTERNATIONAL TRADE IS IMPERATIVE FOR DEVELOPMENT –FREE FLOW OF GOODS IS ESSENTIAL –ONLY DEVELOPED COUNTRIES ARE GOOD AT INNOVATING –THE DEVELOPED COUNTRIES’ WOULD PROVIDE TECHNICAL ASSISTANCE TO DEVELOPING COUNTRIES FOR CAPABILITY BUILDING
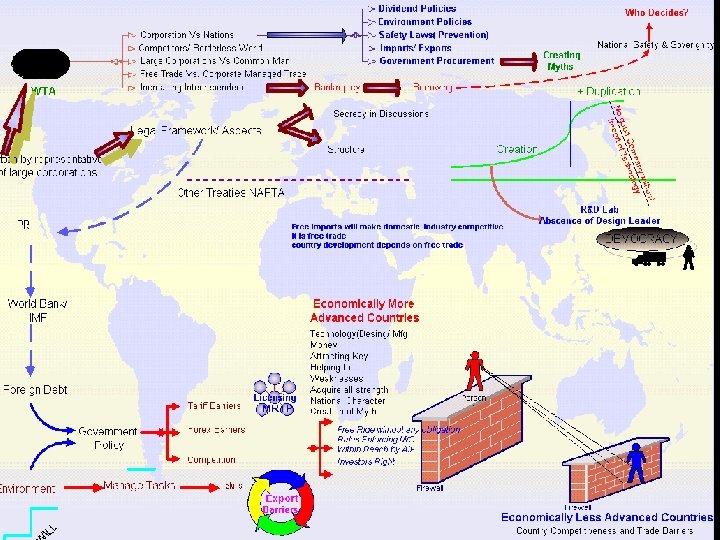
 Money Attracting Key Players Helping to Weaken Acquire all strengths National Character") Technology(Desing/ Mfg) Money Attracting Key Players Helping to Weaken Acquire all strengths National Character Creation of Myths Free Ride without any obligation Rules Enforcing MNCs Within Reach by All. Investors Right Firewall Economically Less Advanced Countries Country Competitiveness and Trade Barriers Population
Technology(Desing/ Mfg) Money Attracting Key Players Helping to Weaken Acquire all strengths National Character Creation of Myths Free Ride without any obligation Rules Enforcing MNCs Within Reach by All. Investors Right Firewall Economically Less Advanced Countries Country Competitiveness and Trade Barriers Population
 Money Attracting Key Players Helping to Weaken") AT PAR LEVEL PLAYING FIELD Technology(Desing/ Mfg) Money Attracting Key Players Helping to Weaken Acquire all strengths National Character Creation of Myths Free Ride without any obligation Rules Enforcing MNCs Within Reach by All. Investors Right Firewall Economically Less Advanced Countries Country Competitiveness and Trade Barriers
AT PAR LEVEL PLAYING FIELD Technology(Desing/ Mfg) Money Attracting Key Players Helping to Weaken Acquire all strengths National Character Creation of Myths Free Ride without any obligation Rules Enforcing MNCs Within Reach by All. Investors Right Firewall Economically Less Advanced Countries Country Competitiveness and Trade Barriers
 ISSUES FOR RESEARCH • There is a need for extensive, ongoing comprehensive work on nature, scope and magnitude of innovation being carried out in the country. It is also necessary to conduct sectoral studies on innovation, to understand how much of the innovations are being done by domestic efforts and how much by/ with the assistance of foreign players. • It is important to study how much of the value of innovation is being captured and dominated by the foreign players. How much of the investment in infrastructure and intellectual capital is being made by domestic and foreign players and how it is being apportioned.
 A critical ongoing research agenda also has to be on the degree of dependence or independence in innovations, as the dependence is directly related to the issue of sovereignty of the country. The magnitude and task of the research work is so onerous, that traditional methods of research will be grossly inadequate, inefficient and may give partial or even misleading/ lopsided view of the situation. New, innovative appropriate research approaches have to be thought of for such large-scale coordinated research.
 • The enormity of the research tasks associated with the above issues suggests that individual, sporadic and piecemeal research efforts are inadequate to meet the challenge. Time has come to attend to it through large scale, coordinated research by mobilizing and unifying the national efforts with active industry involvement at various stages of research. • Such coordinated studies with close industry association are important from two other angles. Firstly, these would pave way for relevant, meaningful, rich and sound research outputs in a cost effective manner. Secondly, the association in the process of research will facilitate necessary perspective building among the academicians and managers and common masses which would eventually be reflected in the way they will fine tune their approaches and strategies to meet the emerging challenges
 Measuring Competitiveness Developing Measurements of Competitiveness Measuring Competitiveness * Firms * Industry * Country Enhancing Competitivenes Strategies for Enhancing Competitiveness New Product Developments Organisation Innovations Strategic Alliances/ JVs Internationalisation of Business Acquisitions/ Mergers & Divestitures Managing Change & Transformation Roadblocks to Competitiveness Determinants of Competitiveness Roles of Various Estates Socio-cultural-political impact on Competitiveness Impact of Trade Agreements/ Regional Trade Blocks Economic Reforms & Competitiveness Strategic Disadvantages of Developing Countries Impact of Multinational organisations on competitiveness Legislature Executive Judiciary Press/ Media Wider Ramifications of Loss/ Gain of Competitiveness Social Political Economic Cultural Technological
 www. gcfindia. org
 THANK YOU
 WHAT NEEDS TO BE DONE Bringing awareness among common masses about various developments Giving a holistic/ coherent picture Giving longitudinal patterns of developments Highlighting/ analysing wider ramifications Mobilising public opinion for national decisions in desirable directions/ to benefit larger masses, and protecting long term interest of the country Publishing data backed analytical articles
 Internal Adjustments POLICIES De Reservation De Regulation Free Import Tariff barriers FDI These resulted into Difficult survivals Easy Creation Too many players Increased variety Investments Lost Assets Locked as NPAs A/M & Divestitures Falling Interest Rates Suffering Divestitures Cost Reductions MNCs Down Sizing Policies Equilibrium policies VRS Retirement Decreasing Industry Demand Led to Decrease In Deposits to Development Banks Leads To More Deposits in Commercial Banks High Liquidity Diverted towards Consumer Loans
 Major Upheavels in the form of Corporate Restructuring No. of Mergers between 1997 -2003 = 653 No. of Divestiture cases (more than 30% of Assets) = 736 between 1997 -2000
 Table 1 Indian Business Ventures Abroad Upto ‘ 92 ‘ 93 ‘ 94 ‘ 95 ‘ 96 ‘ 97 ‘ 98 ‘ 99 1991 Indian JV Abroad Indian Wholly Owned 244 75 Total Up to 1999 72 104 82 116 101 111 1023 79 122 119 143 122 154 238 1080 100 183 214 201 259 223 255 349 2103 28 92 Subsidiaries Abroad Total Indian Business Ventures Abroad 319
 Table 2 Contribution to Export/ Import by Size of the Companies in 2001 Top 100 Positive Net Export Top 101 - 500 # of Firms Top 501 -1000 1001 -2000 Top Total 2001 -5141 Firms 22 Negative Net Export 143 188 412 775 1540 13825 Amount (Rs. In Crs. ) 12397 7304 8054 3085 # of Firms 53 No Export/Import # of Firms 216 279 455 812 1815 -98433 Amount (Rs. In Crs. ) Total Net (Rs. crs. ) Top -20255 -6170 -3355 -2524 25 41 33 1554 1786 -84608 -7858 1134 4698 561 5141
 Table 3 Indian Business Ventures Abroad and Foreign Collaborations in India Upto ‘ 92 ‘ 93 ‘ 94 ‘ 95 ‘ 96 ‘ 97 ‘ 98 ‘ 99 1991 Indian JV Abroad Indian Wholly Owned Total Upto 1999 244 72 104 92 82 116 101 111 1023 75 28 79 122 119 143 122 154 238 1080 319 100 183 214 201 259 223 255 349 2103 16836 1531 1476 1854 2337 2303 2325 1786 2224 32672 Subsidiaries Abroad Total Indian Business Ventures Abroad Foreign Collaboration in India
") Table 4 Corporate Leaders and Foreign Collaborations Sales in year 2000 (Rs. in Cr) Unlisted Listed Companies Comapnies > No. of No. of Collab No. of Firms orat. No. of Collab No. of Collab Firms orat. Top 100 1731. 1 51 475 9 32 60 507 Top 500 315. 4 301 1486 54 214 354 1700 Top 1000 137. 4 545 2260 113 361 658 2621 Top 2000 44. 6 859 2981 317 767 1176 3768 Top 5000 1 1331 3763 1168 2225 2499 5998 Rank Total
Table 4 Corporate Leaders and Foreign Collaborations Sales in year 2000 (Rs. in Cr) Unlisted Listed Companies Comapnies > No. of No. of Collab No. of Firms orat. No. of Collab No. of Collab Firms orat. Top 100 1731. 1 51 475 9 32 60 507 Top 500 315. 4 301 1486 54 214 354 1700 Top 1000 137. 4 545 2260 113 361 658 2621 Top 2000 44. 6 859 2981 317 767 1176 3768 Top 5000 1 1331 3763 1168 2225 2499 5998 Rank Total
 Table 5 Share of Leaders in the Different Parameters in the year 2001 Top Sales Profits Gross Exports Fixed Assets Imports Net Export 100 59% 91% 53% 42% 67% -98% 500 83% 119% 77% 71% 88% -107% 1000 91% 122% 86% 84% 94% -106% 2000 97% 113% 92% 96% 95% -101% 5141 100% 100% 12, 28, 927 41, 216 9, 24, 336 1, 05, 077 1, 91, 150 -86, 073 Total 5141 (Rs. in Crores)
 Table 6 Profit Position of Pre Reform Corporate Leaders in 2001 Year No Profit No Loss Companies Profit Making Companies Loss Making Not Total Reporti ng Companies 1991 67 1686 (79%) 388 - 2151 2001 7 1000 (46%) 679 465 2151
 Corporate Leaders in the Post Liberalisation Era") Table 7 Performance of Pre- Reform (1991) Corporate Leaders in the Post Liberalisation Era Total 1991 1992 1993 1994 1995 1996 1997 1998 1999 2000 2001 Cos. In Profit 1696 1669 1573 1645 1691 1619 1461 1327 1203 1160 1000 Co. in No Profit No Los Conditio n 67 40 16 14 10 11 10 14 8 10 7 Co. in Loss 388 355 403 351 312 369 520 632 713 714 679 Cos. Not Repo rting 0 87 159 141 138 152 160 178 227 267 465 2151 2151 2151 Total 2151
Table 7 Performance of Pre- Reform (1991) Corporate Leaders in the Post Liberalisation Era Total 1991 1992 1993 1994 1995 1996 1997 1998 1999 2000 2001 Cos. In Profit 1696 1669 1573 1645 1691 1619 1461 1327 1203 1160 1000 Co. in No Profit No Los Conditio n 67 40 16 14 10 11 10 14 8 10 7 Co. in Loss 388 355 403 351 312 369 520 632 713 714 679 Cos. Not Repo rting 0 87 159 141 138 152 160 178 227 267 465 2151 2151 2151 Total 2151

 No. 41 : FOREIGN TRADE Year/ Month US dollar million Export Import Balance 5 6 7 1990 -91 18, 145 24, 073 -5, 927 1991 -92 17, 865 19, 411 -1, 545 1992 -93 18, 537 21, 882 -3, 344 1993 -94 22, 238 23, 306 -1, 068 1994 -95 26, 331 28, 654 -2, 324 1995 -96 31, 795 36, 675 -4, 880 1996 -97 33, 470 39, 132 -5, 663 1997 -98 35, 006 41, 484 -6, 478 1998 -99 33, 219 42, 389 -9, 170 1999 -00 36, 822 49, 671 -12, 848 2000 -01 44, 560 50, 536 -5, 976 2001 -02 43, 827 51, 413 -7, 587 2002 -03 52, 719 61, 412 -8, 693 2003 -04 63, 843 78, 149 -14, 307 2004 -5 Apr. Feb 69, 747 94, 509 -24, 761 1
 Poor Performance is Not Prerogative of Any Particular Sector
 Poor Performance is Not Prerogative of Any Sector