

97473fbc75f25d00e0b54f148b75e653.ppt
- Количество слайдов: 15
 COAGULATION FACTOR ASSAYS ONE-STAGE QUANTITATIVE ASSAY METHOD FOR FACTORS II, V, VII, AND X Mr. Mohammed A. Jaber
 is the basis of this test system, with specific") Principle • The prothrombin time(PT) is the basis of this test system, with specific factor deficient plasmas -one stage- being added to the patient plasma. • The percentage of factor activity* is determined by the amount of correction of the PT when specific dilutions of patient plasma are added to the factordeficient plasma. • These results are obtained from an activity curve made using clotting times of dilutions of normal reference plasma and specific factor-deficient plasma.
Principle • The prothrombin time(PT) is the basis of this test system, with specific factor deficient plasmas -one stage- being added to the patient plasma. • The percentage of factor activity* is determined by the amount of correction of the PT when specific dilutions of patient plasma are added to the factordeficient plasma. • These results are obtained from an activity curve made using clotting times of dilutions of normal reference plasma and specific factor-deficient plasma.
 Note:") Reagents and Equipment Commercial thromboplastin Specific factor-deficient plasma (II, V, VII, and X) Note: It is recommended that the factor-deficient plasma utilized be verified as having less than I % activity for the specific factor being measured and close to 100% activity of al. I other factors. • Imidazole buffered saline, p. H 7. 3 ± 0. 1 or *Owren's buffer • Normal reference plasma (commercial reference plasma with known factor levels) • Instrument: Same as that used for PT assay • • •
Reagents and Equipment Commercial thromboplastin Specific factor-deficient plasma (II, V, VII, and X) Note: It is recommended that the factor-deficient plasma utilized be verified as having less than I % activity for the specific factor being measured and close to 100% activity of al. I other factors. • Imidazole buffered saline, p. H 7. 3 ± 0. 1 or *Owren's buffer • Normal reference plasma (commercial reference plasma with known factor levels) • Instrument: Same as that used for PT assay • • •
 Procedure 1. Preparation of the activity curve. 2. Procedure for testing patient plasma.
 1. Preparation of the activity curve A. Prepare 1: 10, 1: 20, 1 : 40, 1: 80, 1: 160, 1: 320, 1: 640, and 1: 1280 serial dilutions of the normal reference plasma with imidazolebuffered saline or Owren' s buffer. § The 1: 10 dilution is considered 100% factor activity. § It is recommended that at least five dilutions be used to prepare the factor activity curve, although it is common to use seven or eight dilutions (Table).
 Buffered Saline (m. L) Dilution % of") Tube No. Amount of plasma (m. L) Buffered Saline (m. L) Dilution % of Factor 1 0. 9 1: 10 100 2 0. 5 of tube no. 1 0. 5 1: 20 50 3 0. 5 of tube no. 2 0. 5 1: 40 25 4 0. 5 of tube no. 3 0. 5 1: 80 12. 5 5 0. 5 of tube no. 4 0. 5 1: 160 6. 25 6 0. 5 of tube no. 5 0. 5 1: 320 3. 13 7 0. 5 of tube no. 6 0. 5 1: 640 1. 56 8 0. 5 of tube no. 8 0. 5 1: 1280 0. 78
Tube No. Amount of plasma (m. L) Buffered Saline (m. L) Dilution % of Factor 1 0. 9 1: 10 100 2 0. 5 of tube no. 1 0. 5 1: 20 50 3 0. 5 of tube no. 2 0. 5 1: 40 25 4 0. 5 of tube no. 3 0. 5 1: 80 12. 5 5 0. 5 of tube no. 4 0. 5 1: 160 6. 25 6 0. 5 of tube no. 5 0. 5 1: 320 3. 13 7 0. 5 of tube no. 6 0. 5 1: 640 1. 56 8 0. 5 of tube no. 8 0. 5 1: 1280 0. 78
 Preparation of the activity curve B. Warm thromboplastin to 37°C. C. Perform the following test procedure on each dilution. • Note: These steps are commonly performed by an automated coagulation analyzer. 1) Add 0. 05 m. L of specific factor-deficient plasma to 0. 05 m. L of the diluted normal reference plasma and warm to 37°C for the allotted time based on the manufacturer's specifications. 2) Add 0. 1 m. L of commercial thromboplastin to the sample and determine the clotting time. 3) Testing may be performed either singly or in duplicate. If performing duplicate testing, repeat steps 1 and 2 on the duplicate sample and average results. 1. 50 µL of specific factor-deficient plasma 2. 50 µL of diluted normal reference plasma 3. 100 µL of PT reagent
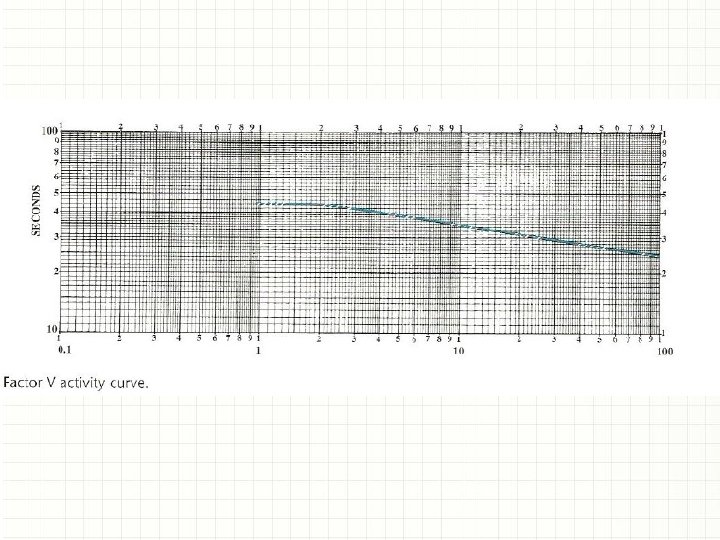
 Preparation of the activity curve D. Plot results on 2 X 3 cycle log graph paper, with percent factor activity on the x-axis and seconds on the y-axis. Draw a best-fit line. – The curve will demonstrate a plateau at the least concentrated dilutions and should be plotted as such, demonstrating the end of sensitivity for the assay. – If using an automated analyzer, the curve is generally constructed internally and stored for a specified length of time.
 Warm thromboplastin to 37°C. 2) Prepare I: 10") Procedure for testing patient plasma 1) Warm thromboplastin to 37°C. 2) Prepare I: 10 and I : 20 dilutions of citrated patient plasma with imidazole-buffered saline or Owren's buffer. If a third dilution is desired, prepare a 1 : 40. It is important to keep samples and dilutions refrigerated until they are to be tested. 3) Add 0. 05 m. L of specific factor-deficient plasma to 0. 05 m. L of diluted patient plasma.
Procedure for testing patient plasma 1) Warm thromboplastin to 37°C. 2) Prepare I: 10 and I : 20 dilutions of citrated patient plasma with imidazole-buffered saline or Owren's buffer. If a third dilution is desired, prepare a 1 : 40. It is important to keep samples and dilutions refrigerated until they are to be tested. 3) Add 0. 05 m. L of specific factor-deficient plasma to 0. 05 m. L of diluted patient plasma.
 Add 0. 1 m. L of thromboplastin to") Procedure for testing patient plasma 4) Add 0. 1 m. L of thromboplastin to the sample and determine the clotting time. 5) Testing may be performed either singly or in duplicate. If performing duplicate testing, repeat steps 3) and 4) on the duplicate sample and average the results. 6) Repeat steps 3), 4), and 5) on the 1 : 20 and. 1: 40 dilution of patient plasma, multiplying the measured result by 2 or 4 respectively to correct for the dilution ratio when compared with the I: 10 dilution. The results of the 1: 10, 1 : 20 and 1: 40 dilutions should agree within 15%. Report the average of the results. 1. 50 µL of specific factor-deficient plasma 2. 50 µL of diluted patient plasma 3. 100 µL of PT reagent
Procedure for testing patient plasma 4) Add 0. 1 m. L of thromboplastin to the sample and determine the clotting time. 5) Testing may be performed either singly or in duplicate. If performing duplicate testing, repeat steps 3) and 4) on the duplicate sample and average the results. 6) Repeat steps 3), 4), and 5) on the 1 : 20 and. 1: 40 dilution of patient plasma, multiplying the measured result by 2 or 4 respectively to correct for the dilution ratio when compared with the I: 10 dilution. The results of the 1: 10, 1 : 20 and 1: 40 dilutions should agree within 15%. Report the average of the results. 1. 50 µL of specific factor-deficient plasma 2. 50 µL of diluted patient plasma 3. 100 µL of PT reagent
 Procedure for testing patient plasma • Note: • Inhibitors will often have a "dilutional" effect, demonstrating nonparallel curves with increasing dilutions. • This should be considered if the results of the 1: 10, 1 : 20 and 1: 40 dilutions do not agree within 15%. In this case, results should not be averaged, but further dilutions such as 1 : 80, and I: 160 performed until results of two consecutive dilutions match within 15% and measure within linearity of the calibration curve.
 Procedure for testing patient plasma • Read the percent activity directly from the activity curve (Fig. ). From this curve, a result of 35 seconds on a 1: 10 dilution of patient plasma would be interpreted as 8. 3% activity. If the curve was generated using an automated coagulation analyzer, the results will automatically be read from the curve and printed out. • Note: Specific volumes required for adding factordeficient plasma, diluted patient plasma, and thromboplastin reagent may vary depending on the automated analyzer used.
 Interpretation • An approximate range of 50% to 150% is considered normal, Each laboratory should define its own reference range based on instrument, reagent, and patient population.
