3253b0d8c0ea4b85b93ff6bbae35e338.ppt
- Количество слайдов: 82
 CMU–Voyager Instrumenting for Pollution and Energy Consumption
 Team Members Pratik Agarwal Alex Eiser Gary Feigenbaum Yuan-Ning “Richard” Hsieh Gregor Kronenberger Kietae Park Asad Samar Kristen Stubbs
 Overview
 Overview: Goals • Instrument Voyager to monitor —Propulsion power generation —Energy Consumption —Energy Efficiency —Fuel Consumption
 Overview: Goals • Provide a means to view this data —For instructors: • Teaching tools —For the crew: • Visualize the information gathered • Provide ability to perform basic analysis • Provide insights for the new Voyager
 Overview: System Architecture • Three subsystems —Network of sensors • • • Fuel flow rate Electricity sensors GPS sensor —Scientific visualization tool for the crew —“Dashboard” interface for students
 Overview: Design Process • PHASE I: • Understand the problem • Create a visionary scenario • Propose an initial solution PHASE II: • Create a concrete design • Start on implementation • Discover and solve problems • Update design PHASE III: • Complete implementation • System integration and testing • Demonstration
 Final Prototype Application Launcher
 System Architecture: Application Launcher
 System Architecture: Application Launcher Wait until Status turns green Launch Dashboard
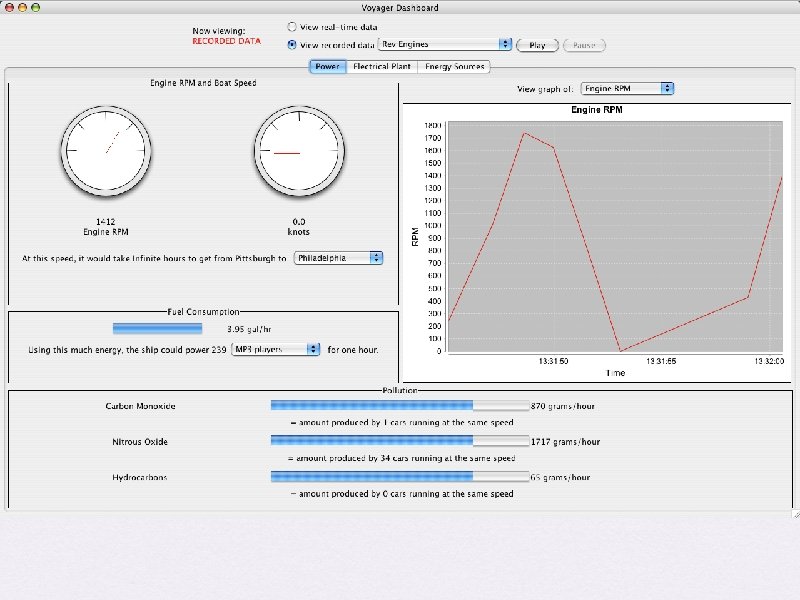
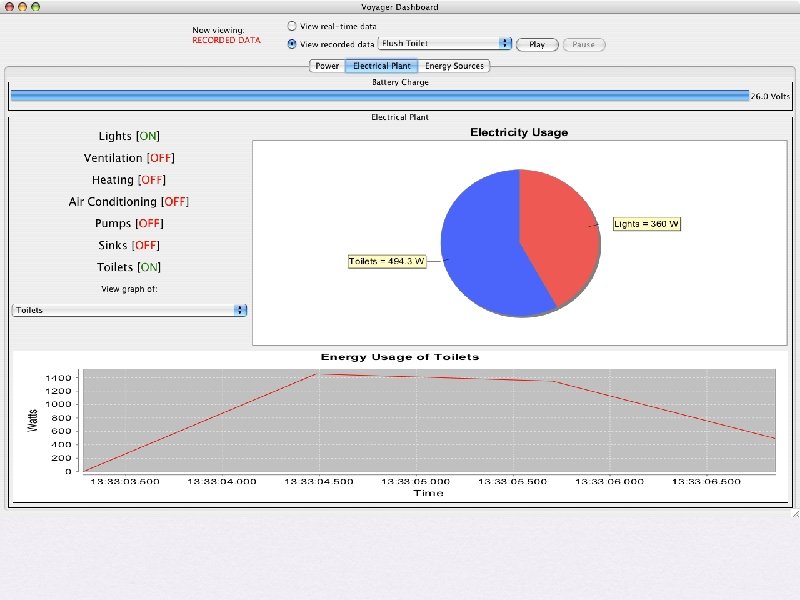
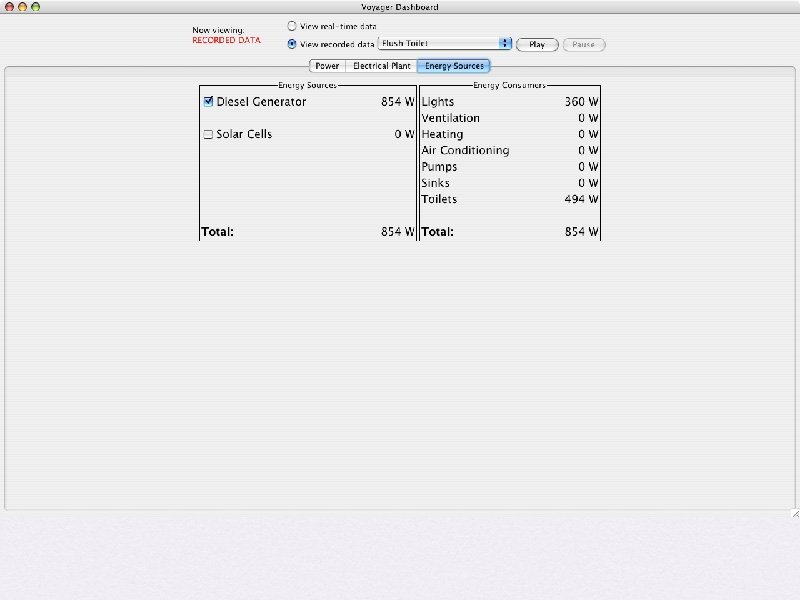
 Final Prototype Dashboard
 Final Prototype Scientific Visualization
 Data Visualization: Single Dimension • Web interface to view data • Works in IE 6/ Opera 7. 5/ Mozilla • Requires Javascript for date selection • Shows one-dimensional data vs. time
 Data Visualization • Choose Sensor —Speed —Electrical —Fuel consumption —Not pollution
 Data Visualization • Select date —using a dropdown —using the calendar
 Data Visualization • Select date —using a dropdown —using the calendar
 Bar Charts: Fuel Consumption vs. Time
 Line Charts: Fuel Consumption vs. Time
 Two Sensors: Fuel Consumption and RPM vs. Time
 Excel Export Link in graph display • Exports directly to an Excel file for further analysis •
 Excel Export Link in graph display • Exports directly to an Excel file for further analysis •
 Excel Export Link in graph display • Exports directly to an Excel file for further analysis •
 System Architecture Overview
 System Architecture
 System Architecture Sensors
 System Architecture: Device Placement
 Electrical
 System Architecture: Sensors
 Current Sensors • Self-powered so can be left permanently running • Output between 0 -5 V depending on the current flowing through the wire • No need to expose the conductor
 AC/Lights/Heating Switchover Main distribution Pumps") Electrical Subsystems Shore Power Generator Main circuit panel (hallway) AC/Lights/Heating Switchover Main distribution Pumps panel MSD Ventilation
Electrical Subsystems Shore Power Generator Main circuit panel (hallway) AC/Lights/Heating Switchover Main distribution Pumps panel MSD Ventilation
 A/C Heating Ventilation Flushing Pumps") Sensor Placement Shore Power Generator Main circuit panel (hallway) A/C Heating Ventilation Flushing Pumps Sink Switchover Main distribution Pumps panel MSD Ventilation
Sensor Placement Shore Power Generator Main circuit panel (hallway) A/C Heating Ventilation Flushing Pumps Sink Switchover Main distribution Pumps panel MSD Ventilation
 Current Sensors • Experiments, first in lab and then on the boat show they are pretty accurate • All data collected in real time now • Seven electrical sensors (worth approx. $700)
 Current Sensor Installation • Current sensors have been installed on the boat, to monitor the following: • A/C: 3 units in the main classroom • Heating: 2 units in the main classroom and 1 in pilot house
 Current Sensor Installation • Toilet pump: monitors the toilet • Engine pump: The bilge pump in the control room • Ventilation: Ventilation switch in the control room
 Flow Rate Sensor
 System Architecture: Flow Rate Sensor
 Flow Rate Sensor: Flo. Scan Constantly monitor one engine • Either engine combination can be monitored • Real time data • Will not block fuel line • Can be installed permanently • Powered by 12 V DC • Easily accessible from sensor position • 0 -5 V output • Use Data Acquisition Device to collect data • Approx cost $1, 100 •
 Flo. Scan
 How Flo. Scan Works Fuel Tank Engine
 Flo. Scan Installation • Forward and Return sensors were placed in fuel line • Wires were run to the starboard side under the floor • Wires are not visible for 90 % of path and do not interfere with engines
 Flo. Scan Installation • The monitor is mounted on the starboard side wall • Wires run to the 12 V DC power supply and to the DAD
 Data Acquisition
 Data Acquisition: Data Acquisition Device
 Data Acquisition: Data Acquisition Device • 0 -5 V input • RS 232 output • Requires power supply, some interface cards and cables — 11 channels
 Data Acquisition: Data Acquisition Device • Experiments in the lab and on the boat have shown that this works fine with the current sensors • 1 device costs $90 with the power supply.
 Data Acquisition: Installation • • DAD has been installed on the boat. Input from flow rate and current sensors, output to PC
 Data Acquisition: I/O module
 Data Acquisition: I/O Module • Specialized Application —Interfaces with DAD & GPS —Communicates with sensors using virtual COM ports through the DAD —Gathers data from sensors and GPS —Stores data in our database —Written in Java
 GPS
GPS
 GPS
GPS
 GPS: Overview • GPS — Used to track movement of Voyager • • • Distance traveled Speed Location – Longitude, Latitude Able to take accurate measurements Report data in real time USB port used as Virtual Com Port
 GPS: Product • Rayming TN-200 — Track up to 12 satellites — Built-in antenna and waterproof — Magnet included for mounting — USB output, NMEA data format
 GPS: Implementation • We plan to place the GPS sensor in the open where it can easily communicate with satellites • Testing shows accurate results for speed and location • Data is updated in our database every 10 seconds
 Mathematical Model
 Mathematical Model
 Mathematical Model: Overview RPM as a function of fuel rate - Pollution -
 Mathematical Model: RPM vs. Fuel Rate Used one of two engines to get the mathematical model • Turned on the engine at a certain RPM to get the fuel rate and plotted RPM as a function of the fuel rate •
 Mathematical Model: RPM vs. Fuel Rate RPM 0. 2 600 0. 5 800 0. 9 900 1. 2 1100 1. 3 1200 1. 4 1300
 Mathematical Model: RPM vs. Fuel Rate • From the table above, we derived the following formula • Y = -1812. 5*(X^4) + 6744. 9*(X^3) - 8322. 2*(X^2) + 4325. 9*X + 4. 1796 R 2 = 0. 9993 Where Y = RPM; X = Fuel Rate
 Mathematical Model: Pollution Emission Model - In order to understand the emission model, we have to look at the relationship between the RPM and the engine power. - We can derive the engine power value with respect to the value of the RPM when the engine is running •
 Mathematical Model: Pollution • RPM vs. Engine Power
 Mathematical Model: Pollution Emission model —CO = 1110 * engine power / 174 —HC = 83 * engine power / 174 —NOX = 2190 * engine power / 174 —SO 2 = 310 * engine power / 174 —PM = 69. 948 * engine power / 174 • Output in grams/hour •
 System Architecture Software
 System Architecture
 System Architecture • Sensors • • IO Module • • Application to input data into the database Database • • Data Input from sensor devices Stores both long term and real time data Dashboard Application • Display the real time data
 System Architecture: Data Flow Queried every second
 System Architecture: Data Flow – Explained • User Input chooses: —Recorded data • • • Toilet flushes Revving the engine Turning on the AC —Real-time data from sensors • Devices connected to the electrical system and engines
 System Architecture: Data Flow – Explained • Realtime Data Store —Holds a recent history of sensor activity • Permanent Data Store —Holds the long term history • Interesting Data Store —Holds pre-recorded data • Used to help explain how activity impacts the environment
 System Architecture: Dashboard Design
 System Architecture: Dashboard Design – Explained • IFLogic —Controls complete application function —Uses a timer to control updating GUI and accessing the database —As data changes in the database, individual components are notified
 System Architecture: Dashboard Design – Explained • Observers —Are notified when a database change has occurred —Fetch new data —Perform required conversions —Notify Viewers that new data is available
 System Architecture: Dashboard Design – Explained • Viewers —Responsible for displaying Dashboard information —Interface with Observers for fetching data —Perform any analysis
 Costs
Costs
 —Database —Data Visualization —Dashboard • Electrical sensors: 7") Costs • Computer (from previous year) —Database —Data Visualization —Dashboard • Electrical sensors: 7 ammeters • Engine sensor: 1 Fuel flow meter • GPS sensor: 1 sensor • Data Acquisition Devices: 1 DAD
Costs • Computer (from previous year) —Database —Data Visualization —Dashboard • Electrical sensors: 7 ammeters • Engine sensor: 1 Fuel flow meter • GPS sensor: 1 sensor • Data Acquisition Devices: 1 DAD
 Costs Product Task Quantity Cost / Unit Floscan 7000 Fuel flow 1 $944 Floscan monitor Floscan output 1 $188 Veris H 922 Ammeter 7(@ $96) $672 DAD + cable, power supply 0 -5 V measuring device 1 $91 Boat speed 1 $105 Dashboard graphing 1 $40 - - $2040 Rayming GPS sensor JFree. Chart sample code Total
 Timeline
 Timeline Final Presentation and Demonstration: Today Final Report and User Manual: May 6
 Demonstration! On board Voyager