efe2568ae8dfa0185698febab7669114.ppt
- Количество слайдов: 35
Cloud Computing/Virtualization 2. 0 is all about Manageability Key considerations for a Cloud Computing Ready Monitoring Solution Bala Vaidhinathan Chief Architect bala@eginnovations. com 1
Agenda • Virtualization 2. 0 / Cloud Computing • Management challenges with Cloud Computing • Key considerations for monitoring Cloud Environments • How to ? • Summary Slide 2 © 2009 e. G Innovations Inc All Rights Reserved
Virtualization 1. 0 • Focus on getting the functionality right, proving the benefits Energy and space savings, ease of provisioning, HA • Predominantly used in staging and development environments • Over-provisioning to ensure acceptable performance • Single-vendor (VMware) dominated • New service opportunities developed – e. g. , VDI Slide 3 © 2009 e. G Innovations Inc All Rights Reserved
Virtualization 2. 0 / Cloud Computing • Choice of virtualization technologies VMware® ESX, Citrix Xen. Server, Microsoft Hyper-V, Solaris x. VM • The hypervisor is now a commodity • Virtual environments prevalent in production Critical applications, business services • Key challenges - Provider: • Slide 4 Need to deliver on the promise of high availability, reliability, performance Shrinking budgets result in emphasis on right-sizing! Performance depends on several layers of software Troubleshooting, diagnosing problems now key © 2009 e. G Innovations Inc All Rights Reserved
Virtualization 2. 0 / Cloud Computing • Saas, Paas or Iaas • What is right for you? • Key challenges - Consumer: Slide 5 Lack of visibility. Management tools not mature enough to handle this explosion in technology. Service levels © 2009 e. G Innovations Inc All Rights Reserved
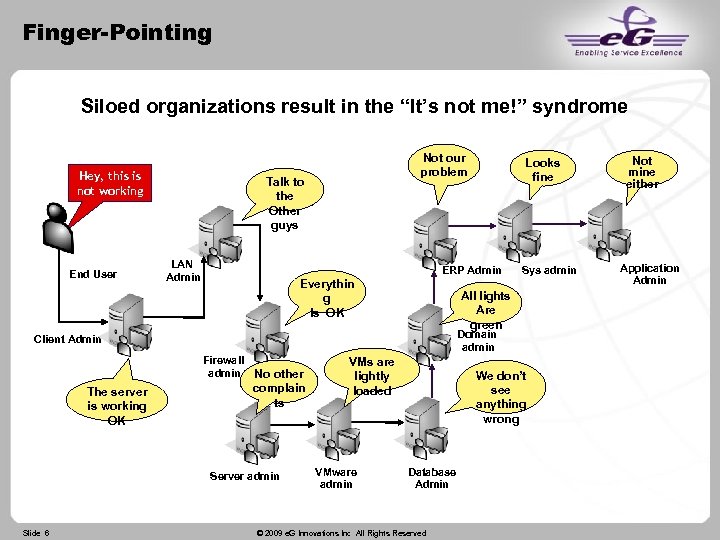
Finger-Pointing Siloed organizations result in the “It’s not me!” syndrome Hey, this is not working End User Not our problem Talk to the Other guys LAN Admin ERP Admin Everythin g Is OK Domain admin Firewall admin No other complain ts Server admin Slide 6 Sys admin All lights Are green Client Admin The server is working OK Looks fine VMs are lightly loaded VMware admin We don’t see anything wrong Database Admin © 2009 e. G Innovations Inc All Rights Reserved Not mine either Application Admin
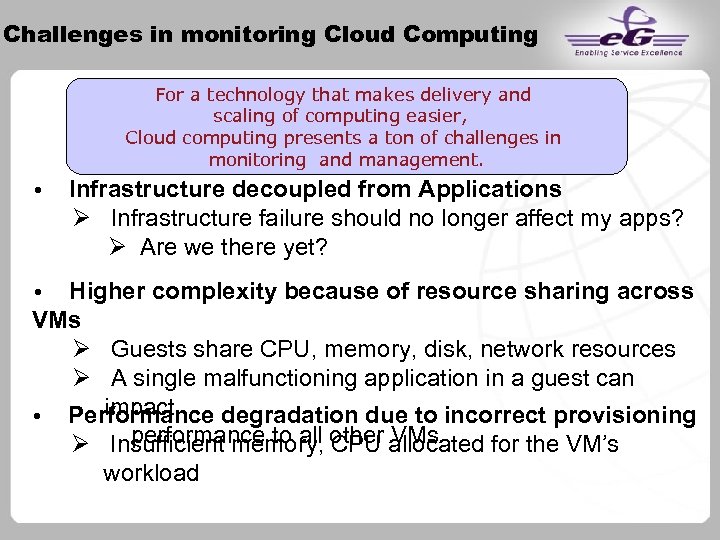
Challenges in monitoring Cloud Computing For a technology that makes delivery and scaling of computing easier, Cloud computing presents a ton of challenges in monitoring and management. • Infrastructure decoupled from Applications Infrastructure failure should no longer affect my apps? Are we there yet? Higher complexity because of resource sharing across VMs Guests share CPU, memory, disk, network resources A single malfunctioning application in a guest can impact • Performance degradation due to incorrect provisioning performance to all CPU VMs Insufficient memory, other allocated for the VM’s • workload
Key Considerations for Monitoring Cloud Environments Slide 8 © 2009 e. G Innovations Inc All Rights Reserved
Cloud Ready Monitoring End-to-end view – across virtual and physical infrastructures Physical and virtual infrastructures will co-exist Private, hybrid and Public Clouds can co-exist Common dashboard for heterogeneous cloud technologies Non-cloud, Private and Public clouds have different designs and behaviour patterns. However they all serve your IT and you should have the ability to look at all of them using a consistent dashboard. Virtualization-aware physical server monitoring Slide 9 Are the servers sized correctly? Where is the bottleneck – CPU? Memory? SAN? Network? VMware ESX, Citrix Xen, Solaris LDOMs, Microsoft Hyper-V, Solaris x. VM, AIX LPAR © 2009 e. G Innovations Inc All Rights Reserved
Cloud Ready Monitoring VM auto-discovery, availability and configuration tracking, physical resource usage Which VMs are on an ESX server? Which ones are powered on? What CPU/memory resources are they taking up? Which VM is generating max. network traffic? Which VM is accessing the disk/SAN the most? Is Live Migration working? How many migrations are happening and how long did a migration take? On demand monitoring Slide 10 Ability to deploy monitoring probes on demand. Ability to integrate your probes into your cloud computing units. Understand the dynamic nature of auto-created VMs. © 2009 e. G Innovations Inc All Rights Reserved
Cloud Ready Monitoring Inside view of a VM with clear problem demarcation Limited information for problem diagnosis • Why is a VM taking up more resources? • Malfunctioning application? Which one? • Excessive workload? • VM not sized properly? Slide 11 “Outside view” indicates which VMs are consuming physical resources and the portion of resources consumed Inside view of a VM critical for problem diagnosis • What % of the resources available to a VM are used by each application? • Is it the physical server? Application? VM? Network? © 2009 e. G Innovations Inc All Rights Reserved
Cloud Ready Monitoring Automatically establish performance baselines When there is a problem, administrators want to know what’s changed Need proactive baselines & trends, so alerting can be proactive Minimize the time and effort spent configuring the monitoring Scalability Ease of installation and configuration Tracking Service Levels Slide 12 Ability to provide different models of Service Levels Dynamic Service Levels Equally important for Providers and Consumers © 2009 e. G Innovations Inc All Rights Reserved
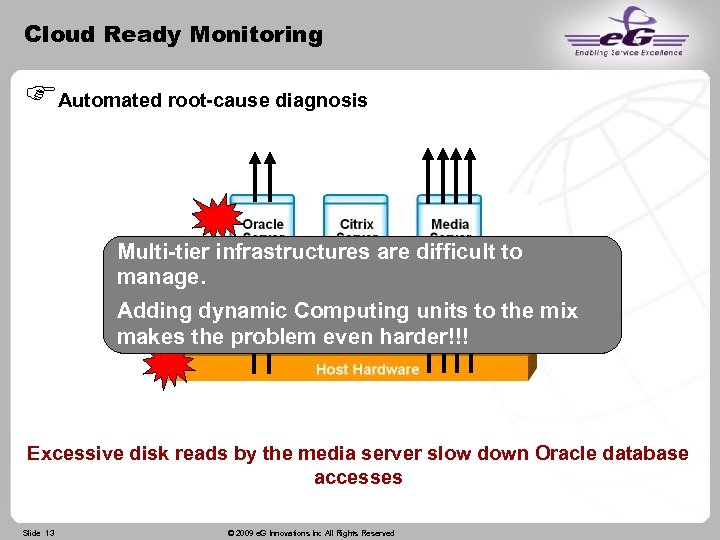
Cloud Ready Monitoring Automated root-cause diagnosis Media Streaming Database Queries Multi-tier infrastructures are difficult to manage. Adding dynamic Computing units to the mix makes the problem even harder!!! Disk reads Excessive disk reads by the media server slow down Oracle database accesses Slide 13 © 2009 e. G Innovations Inc All Rights Reserved
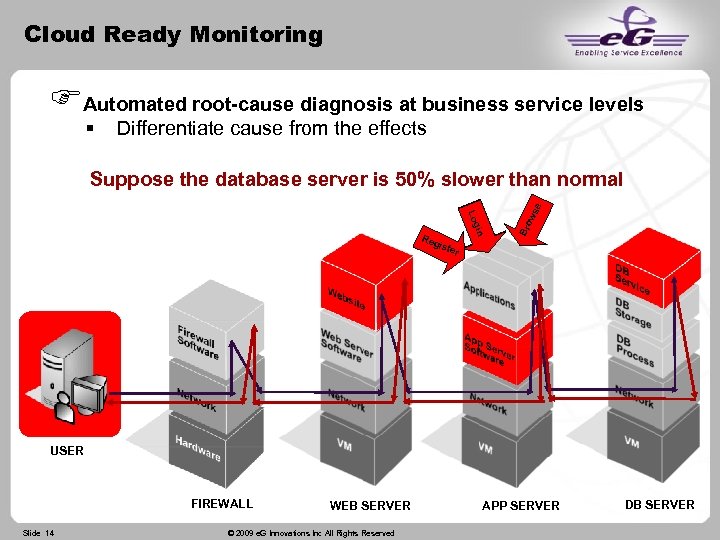
Cloud Ready Monitoring Automated root-cause diagnosis at business service levels Differentiate cause from the effects iste ow Br gin Lo Reg se Suppose the database server is 50% slower than normal r USER FIREWALL Slide 14 WEB SERVER © 2009 e. G Innovations Inc All Rights Reserved APP SERVER DB SERVER
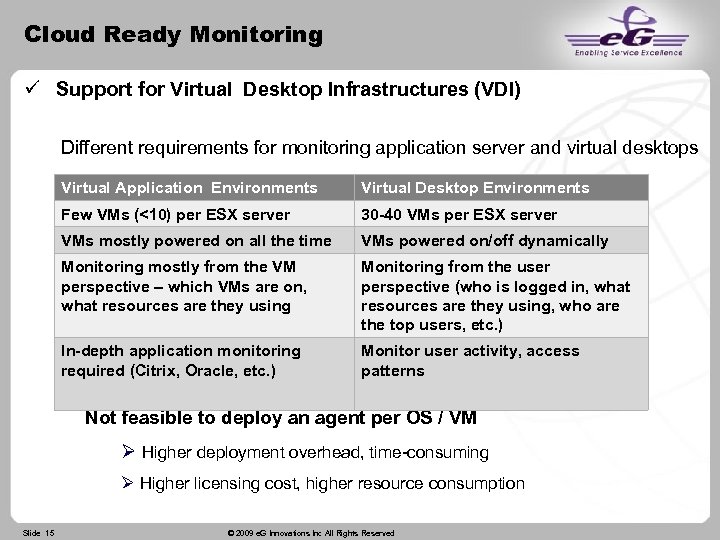
Cloud Ready Monitoring Support for Virtual Desktop Infrastructures (VDI) Different requirements for monitoring application server and virtual desktops Virtual Application Environments Virtual Desktop Environments Few VMs (<10) per ESX server 30 -40 VMs per ESX server VMs mostly powered on all the time VMs powered on/off dynamically Monitoring mostly from the VM perspective – which VMs are on, what resources are they using Monitoring from the user perspective (who is logged in, what resources are they using, who are the top users, etc. ) In-depth application monitoring required (Citrix, Oracle, etc. ) Monitor user activity, access patterns Not feasible to deploy an agent per OS / VM Higher deployment overhead, time-consuming Higher licensing cost, higher resource consumption Slide 15 © 2009 e. G Innovations Inc All Rights Reserved
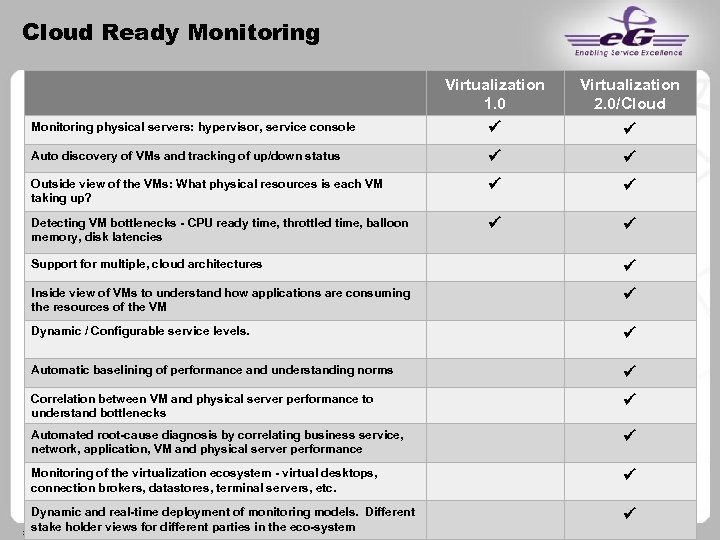
Cloud Ready Monitoring Virtualization 1. 0 Virtualization 2. 0/Cloud Monitoring physical servers: hypervisor, service console Auto discovery of VMs and tracking of up/down status Outside view of the VMs: What physical resources is each VM taking up? Detecting VM bottlenecks - CPU ready time, throttled time, balloon memory, disk latencies Support for multiple, cloud architectures Inside view of VMs to understand how applications are consuming the resources of the VM Dynamic / Configurable service levels. Automatic baselining of performance and understanding norms Correlation between VM and physical server performance to understand bottlenecks Automated root-cause diagnosis by correlating business service, network, application, VM and physical server performance Monitoring of the virtualization ecosystem - virtual desktops, connection brokers, datastores, terminal servers, etc. Dynamic and real-time deployment of monitoring models. Different stake holder views for different parties in©the eco-system. All Rights Reserved Slide 16 2009 e. G Innovations Inc
Lets take a closer look. . . Slide 17 © 2009 e. G Innovations Inc All Rights Reserved
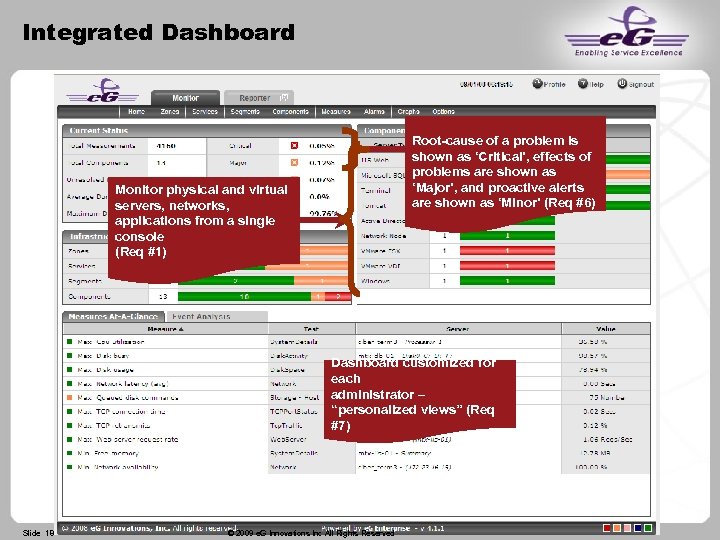
Integrated Dashboard Root-cause of a problem is shown as ‘Critical’, effects of problems are shown as ‘Major’, and proactive alerts are shown as ‘Minor’ (Req #6) Monitor physical and virtual servers, networks, applications from a single console (Req #1) Dashboard customized for each administrator – “personalized views” (Req #7) Slide 18 © 2009 e. G Innovations Inc All Rights Reserved
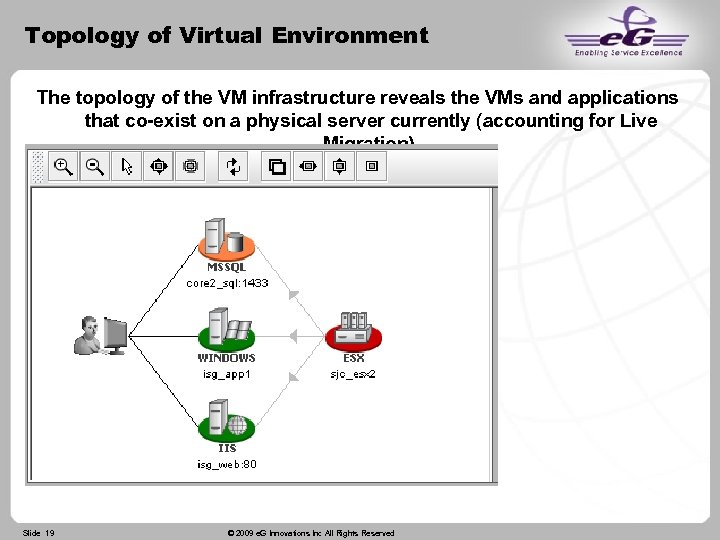
Topology of Virtual Environment The topology of the VM infrastructure reveals the VMs and applications that co-exist on a physical server currently (accounting for Live Migration). Slide 19 © 2009 e. G Innovations Inc All Rights Reserved
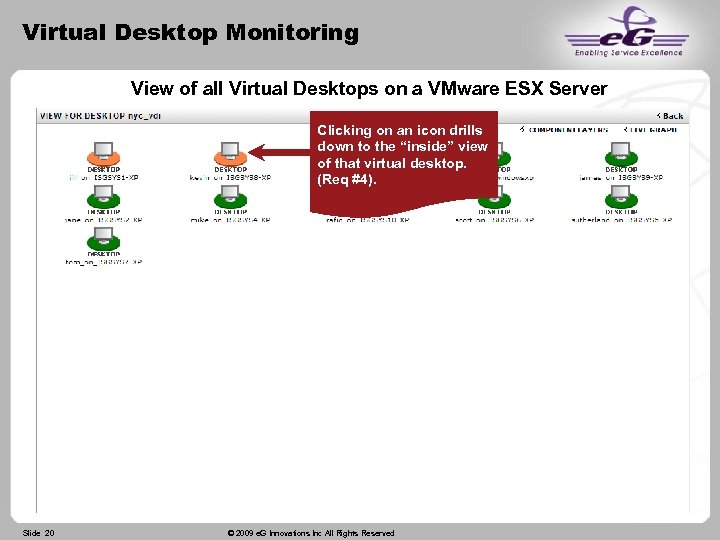
Virtual Desktop Monitoring View of all Virtual Desktops on a VMware ESX Server Clicking on an icon drills down to the “inside” view of that virtual desktop. (Req #4). Slide 20 © 2009 e. G Innovations Inc All Rights Reserved
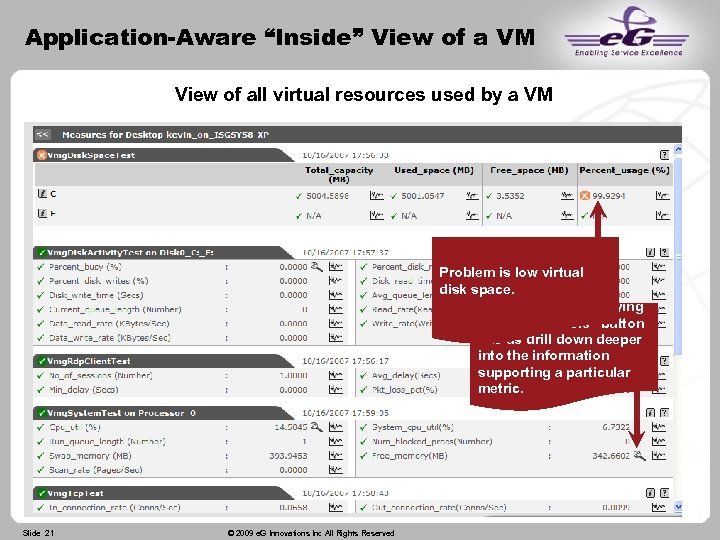
Application-Aware “Inside” View of a VM View of all virtual resources used by a VM Problem is low virtual disk space. Clicking on a magnifying glass “diagnosis” button lets us drill down deeper into the information supporting a particular metric. Slide 21 © 2009 e. G Innovations Inc All Rights Reserved
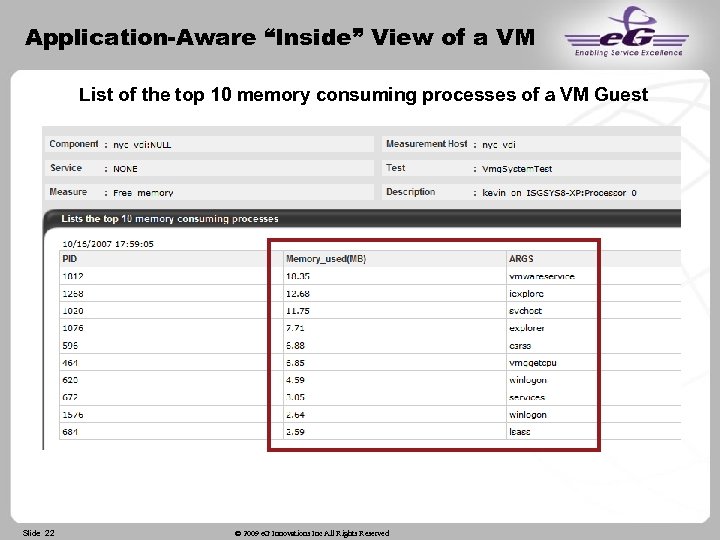
Application-Aware “Inside” View of a VM List of the top 10 memory consuming processes of a VM Guest Slide 22 © 2009 e. G Innovations Inc All Rights Reserved
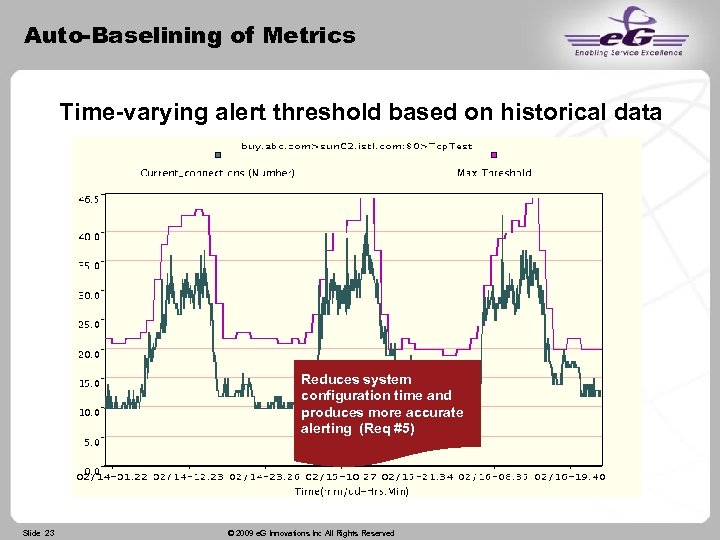
Auto-Baselining of Metrics Time-varying alert threshold based on historical data Reduces system configuration time and produces more accurate alerting (Req #5) Slide 23 © 2009 e. G Innovations Inc All Rights Reserved
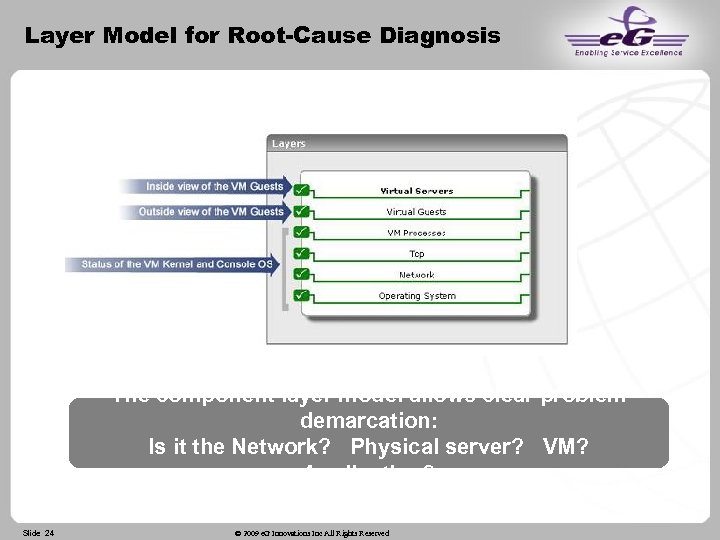
Layer Model for Root-Cause Diagnosis The component layer model allows clear problem demarcation: Is it the Network? Physical server? VM? Application? Slide 24 © 2009 e. G Innovations Inc All Rights Reserved
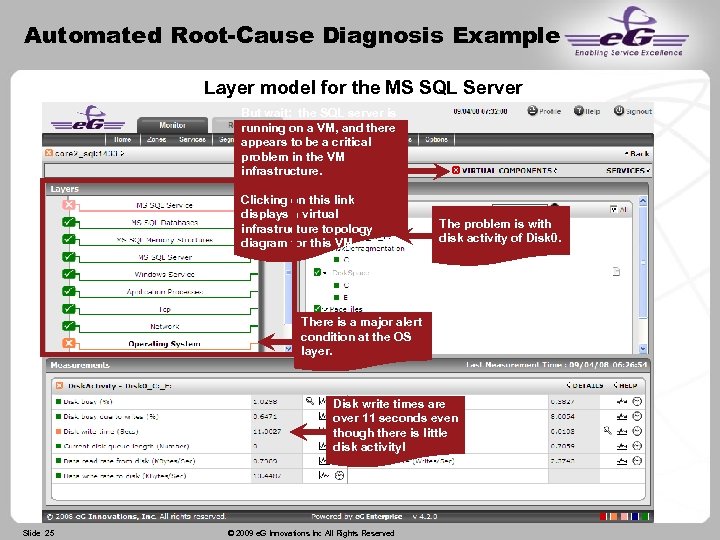
Automated Root-Cause Diagnosis Example Layer model for the MS SQL Server But wait: the SQL server is running on a VM, and there appears to be a critical problem in the VM infrastructure. Clicking on this link displays a virtual infrastructure topology diagram for this VM. The problem is with disk activity of Disk 0. There is a major alert condition at the OS layer. Disk write times are over 11 seconds even though there is little disk activity! Slide 25 © 2009 e. G Innovations Inc All Rights Reserved
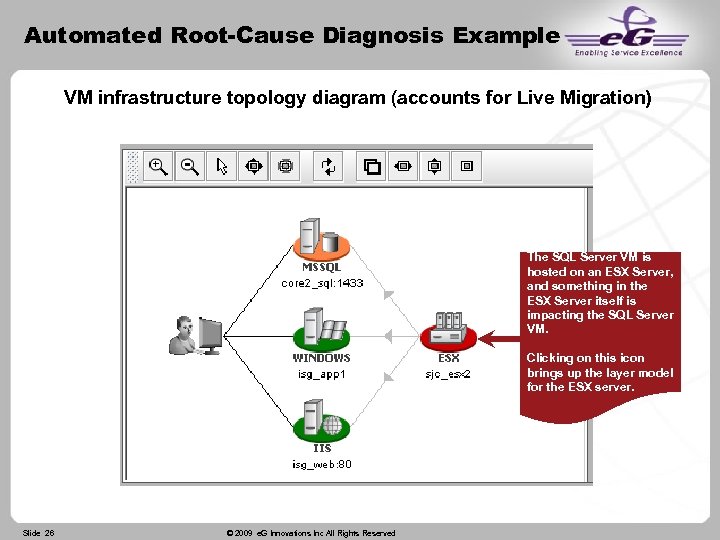
Automated Root-Cause Diagnosis Example VM infrastructure topology diagram (accounts for Live Migration) The SQL Server VM is hosted on an ESX Server, and something in the ESX Server itself is impacting the SQL Server VM. Clicking on this icon brings up the layer model for the ESX server. Slide 26 © 2009 e. G Innovations Inc All Rights Reserved
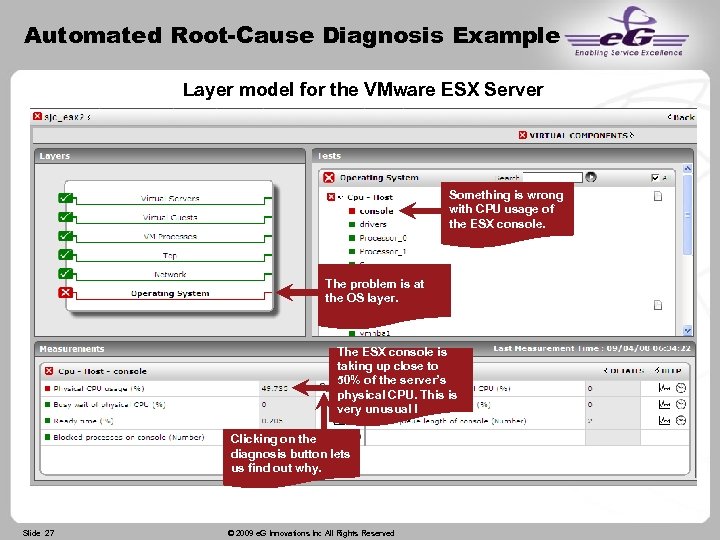
Automated Root-Cause Diagnosis Example Layer model for the VMware ESX Server Something is wrong with CPU usage of the ESX console. The problem is at the OS layer. The ESX console is taking up close to 50% of the server’s physical CPU. This is very unusual ! Clicking on the diagnosis button lets us find out why. Slide 27 © 2009 e. G Innovations Inc All Rights Reserved
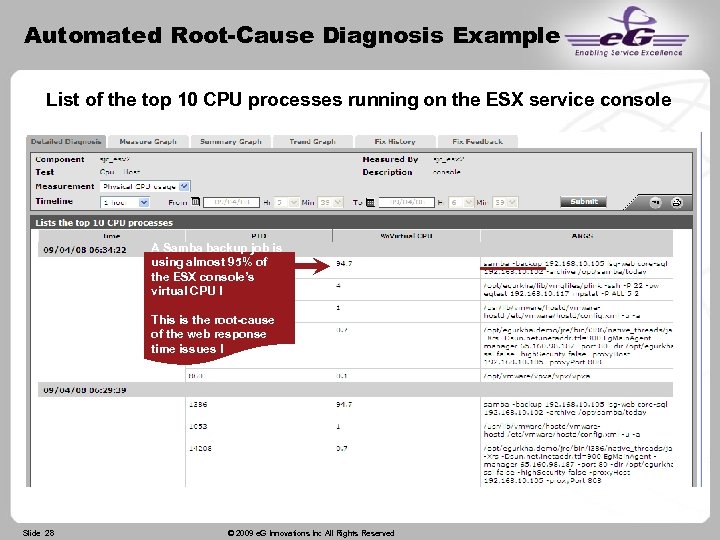
Automated Root-Cause Diagnosis Example List of the top 10 CPU processes running on the ESX service console A Samba backup job is using almost 95% of the ESX console’s virtual CPU ! This is the root-cause of the web response time issues ! Slide 28 © 2009 e. G Innovations Inc All Rights Reserved
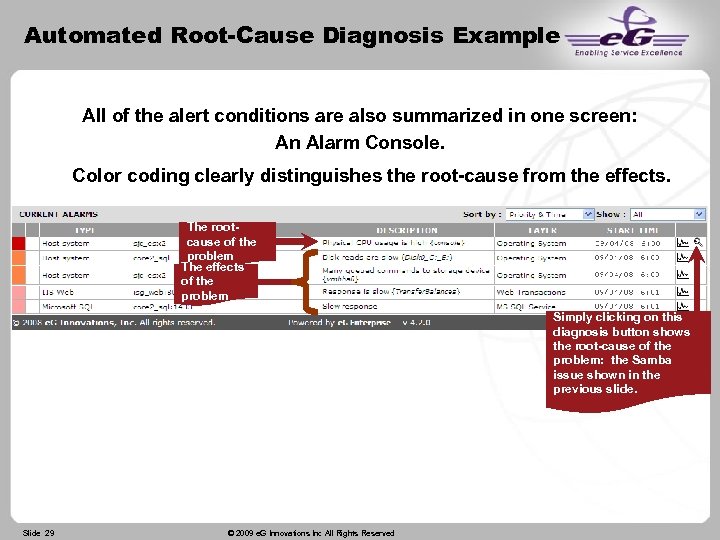
Automated Root-Cause Diagnosis Example All of the alert conditions are also summarized in one screen: An Alarm Console. Color coding clearly distinguishes the root-cause from the effects. The rootcause of the problem The effects of the problem Simply clicking on this diagnosis button shows the root-cause of the problem: the Samba issue shown in the previous slide. Slide 29 © 2009 e. G Innovations Inc All Rights Reserved
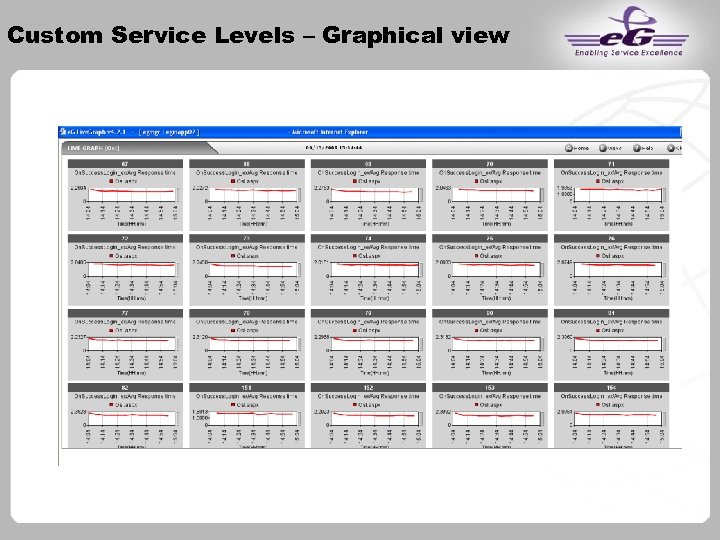
Custom Service Levels – Graphical view
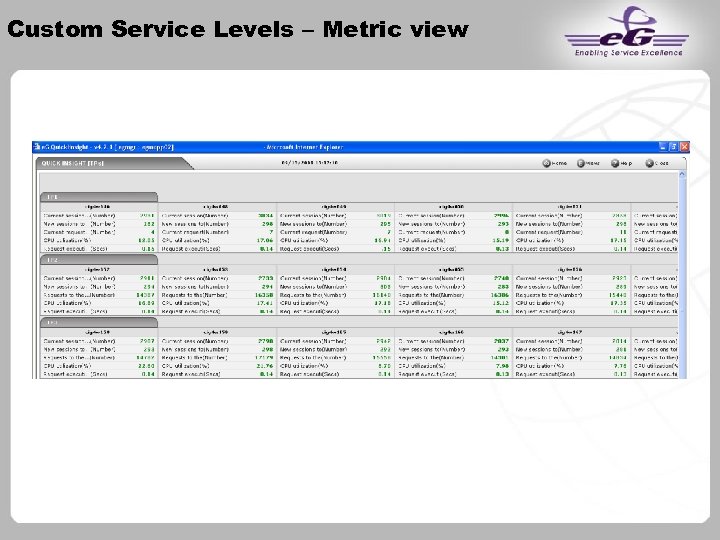
Custom Service Levels – Metric view
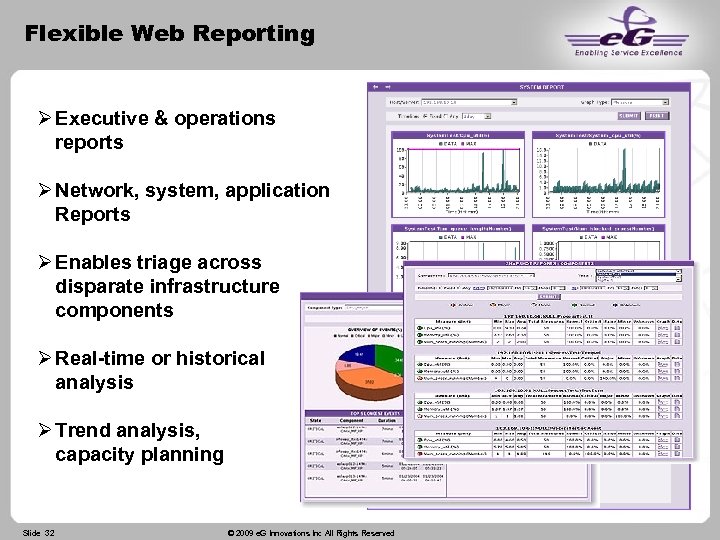
Flexible Web Reporting Executive & operations reports Network, system, application Reports Enables triage across disparate infrastructure components Real-time or historical analysis Trend analysis, capacity planning Slide 32 © 2009 e. G Innovations Inc All Rights Reserved
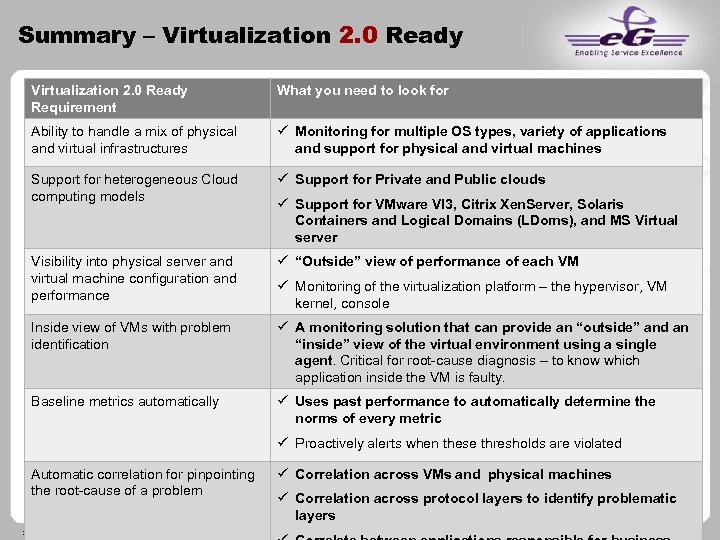
Summary – Virtualization 2. 0 Ready Requirement What you need to look for Ability to handle a mix of physical and virtual infrastructures Monitoring for multiple OS types, variety of applications and support for physical and virtual machines Support for heterogeneous Cloud computing models Support for Private and Public clouds Visibility into physical server and virtual machine configuration and performance “Outside” view of performance of each VM Inside view of VMs with problem identification A monitoring solution that can provide an “outside” and an “inside” view of the virtual environment using a single agent. Critical for root-cause diagnosis – to know which application inside the VM is faulty. Baseline metrics automatically Uses past performance to automatically determine the norms of every metric Support for VMware VI 3, Citrix Xen. Server, Solaris Containers and Logical Domains (LDoms), and MS Virtual server Monitoring of the virtualization platform – the hypervisor, VM kernel, console Proactively alerts when these thresholds are violated Automatic correlation for pinpointing the root-cause of a problem Slide 33 Correlation across VMs and physical machines Correlation across protocol layers to identify problematic layers © 2009 e. G Innovations Inc All Rights Reserved
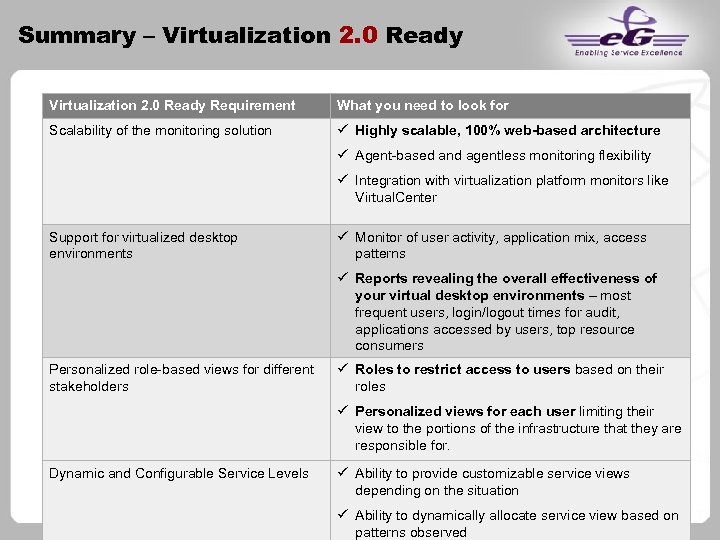
Summary – Virtualization 2. 0 Ready Requirement What you need to look for Scalability of the monitoring solution Highly scalable, 100% web-based architecture Agent-based and agentless monitoring flexibility Integration with virtualization platform monitors like Virtual. Center Support for virtualized desktop environments Monitor of user activity, application mix, access patterns Reports revealing the overall effectiveness of your virtual desktop environments – most frequent users, login/logout times for audit, applications accessed by users, top resource consumers Personalized role-based views for different stakeholders Roles to restrict access to users based on their roles Personalized views for each user limiting their view to the portions of the infrastructure that they are responsible for. Dynamic and Configurable Service Levels Ability to provide customizable service views depending on the situation Ability to dynamically allocate service view based on patterns observed

For more information Web: www. eginnovations. com Slide 35 © 2009 e. G Innovations Inc All Rights Reserved
efe2568ae8dfa0185698febab7669114.ppt