

3083de68570a78531cbfebc119636999.ppt
- Количество слайдов: 33
 Climate in the Last 20, 000 years n Last Glacial Maximum u Low temperatures and expansive ice sheets u Low atmospheric CO 2 levels (190 ppmv) u Dry, windy and sparsely vegetated landscapes u Quite different mammalian fauna
 Why the Cooling? n n n Seasonal insolation similar to today u Expected if glaciers reaching maximum extent Still insolation cannot explain climate 20 K years ago Cooling caused by u Presence of ice sheets u Lower atmospheric greenhouse gas levels
 Earth 4°C colder") CLIMAP Reconstructions n n Continental glaciations (25% land mass; 10% today) Earth 4°C colder
CLIMAP Reconstructions n n Continental glaciations (25% land mass; 10% today) Earth 4°C colder
 CLIMAP Reconstructions n n n N. Atlantic 8°C colder and sea ice more extensive u Less cooling away from northern ice sheets Expansion of Southern Ocean sea ice Equatorial temperatures a little colder
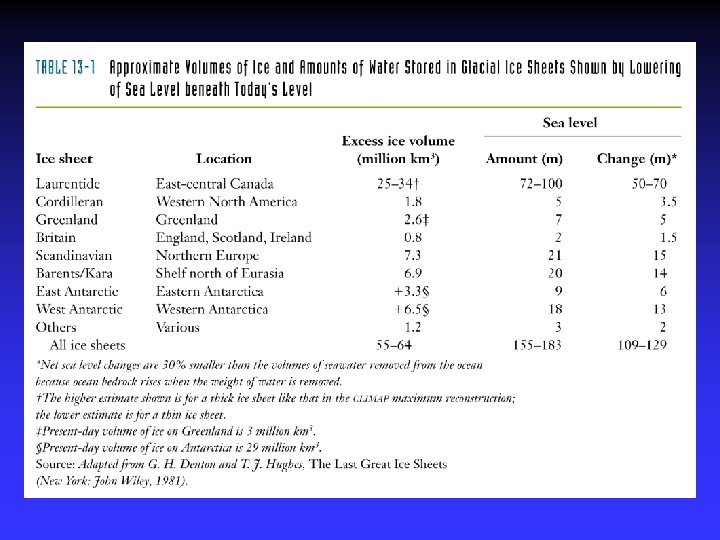
 Extent of Ice Sheets n n Ice sheets were at maximum extent 21, 000 years ago u Major ice sheets covered shelf regions Barents and part of Kara Seas
 Ice Sheet Thickness CLIMAP assumed thick, mature ice sheets u Sea level did not drop enough to accommodate thick ice sheets n N. American ice sheets rested on sediments u Slid more readily n Bedrock rebound rates support thin ice sheets n
 Dry Glacial Environments Evidence for glacial aridity is bountiful n Glacial loess deposits widespread n
 Dry Glacial Environments Desert environments source of much dust today n At LGM, environments produced more dust n
 Dry Glacial Environments n n At LGM u Sand dune deposition more extensive t Drier climate t Stronger winds Virtually every region on Earth u Shows LGM drier and dustier u Unfortunately, model simulations poor
 COHMAP n Combined terrestrial ecology – modeling approach to understand Holocene u Assemble records of boundary conditions t Climate drivers • Ice sheet size and greenhouse gases u Model simulations using changing boundary conditions u Compared with climate records from marine and lacustrine environments
 Pollen Analysis Rainfall and temperature control distribution of plants u Percentages of pollen allow climate reconstruction and can be 14 C dated n Many lakes in northern N. America formed from glacial retreat u Contain pollen from LGM to present n
 Pollen in Northern Lakes Spruce pollen indicates cold conditions n Oak pollen indicates warmer climates n Prairie grass pollen indicate a drier climate n Transitions follow deglaciation of region n
 Pollen Distributions n Pollen analyzed in lake cores worldwide u Provide geographic distribution of vegetation t LGM t Deglaciation u Geographic distribution of vegetation u Compared with output model simulations
 Spruce Distributions n Spruce found today in northeastern Canada u During LGM, found only in northern US lakes u Distribution agrees well with model simulations
 GCM and High-Level Winds n n n Presence of ice sheets can redirect jet stream u Low-level atmospheric flow blocked by ice LGM flow causes clockwise spiral of cold air u Southwestward flow over N. Atlantic Flow west across US Clockwise spiral over Scandinavia cooled Europe Upper level jet crossed Atlantic and flowed into Europe at 45 -50°N
 Cold Glacial North Atlantic n n Largest ocean cooling in N. Atlantic u Pushed the Gulf Stream and N. Atlantic Drift towards Portugal Highest rates of deposition of ice rafted debris u North of 50°N u Southward flowing icebergs encountered warm water and melted
 Southwestern United States n n Southward displacement of jet stream u Brought increased moisture to SW t Increased winter storm t Cloudiness inhibited evaporation u Most extensive lake deposits glacial Lake Bonneville Pacific NW dry u Southward displacement of jet stream u Cool, dry west winds from mid-continent
 Eastern United States n Extensive lake deposits allow rigorous model tests u Mismatch for elm pollen (warm-adapted diciduous) t Model simulations underestimate actual cooling u Cooling may be due to Mississippi River inflow t Gulf of Mexico, cooling much of SE United States
 LGM in Europe n n Modern vegetation dominated by forests u Conifers in north u Deciduous in south At LGM u Arctic tundra large area south of ice sheets u Mostly prairie and grassy steppe u Forests only on southern margin
 Cooling in Europe Clockwise flow of cold low-level winds u Across Scandinavian ice sheets n Cold North Atlantic sea surface temperatures n Mediterranean temperatures moderated u Winter storms t Brought to region by southward-shifted jet stream across the Atlantic n
 LGM in Asia n n Modern Asia covered by forests LGM grass steppe u Forests largely absent t Very harsh climate u Probably produced deep permafrost t Growth of grasses during summer thaw u Model simulations suggest strong high-pressure cell in Siberia during winter u Moisture to region from N. Atlantic nonexistent u Cold N. Pacific and Bering Sea from Siberian winds
 LGM in Antarctica Winter sea ice extended further north u Shift in the Polar Front (region of high productivity) t Not simple; driven by bathymetry n Simple models suggest u Lower CO 2 levels u Decreased flow of warm saline NADW n
 LGM in Australia n Showed expanded development of dune deposits u Arid climate and intensification of CCW winds u Large regions north of Australia exposed with drop in sea level u Probably resulted from lower CO 2 levels u Shift of storms to south in Southern Ocean
 LGM in South America n n n Suggestion of drier conditions in Amazon u Cooler ocean SST, lower sea level and low CO 2 Know Amazon was wetter from Paul Baker’s work u Wetter from south shift in westerly winds Even if Amazon wetter u Could not offset loss of vegetation in N. hemisphere
 Cold LGM Tropics Conundrum n n n CLIMAP studies indicate tropical cooling u 1 -2°C compared with today in most regions u Southern tropical Pacific 1°C warmer Terrestrial indicators suggest 4 -6°C cooling What caused the cooling? u Was it glaciers? t Too far away u Was it insolation? t Similar to today u Was it greenhouse gases? t Perhaps, as a result of lower trapping of background radiation u Was it the data?
 LGM a Model for Greenhouse World? n If LGM tropical cooling from CO 2 u Could be a model for future climate change t Response of the Earth climate system • Atmospheric CO 2 change of ~90 ppmv u What will be the future warming of the tropical oceans? u Warming of the Planet?
 CLIMAP Cooling: Pros n n Temperature estimates from faunal assemblages Species that existed in tropics at LGM Not much different from modern Conclude that cooling was slight (average 1. 5°C)
 CLIMAP Cooling: Pros n Independent agreement from alkenones u Alkenone paleotemperatures agree with those from faunal assemblages u d 18 O from planktic foraminifera t Also show general agreement • When ice volume signal removed (1. 1‰)
 CLIMAP Cooling: Cons n n Faunal assemblage have low sensitivity to temperature change at 20°C u No change observed because no change expected t Food, not temperature controlled species Pacific a poor place to examine calcareous shells u Extensive dissolution of carbonate t Preferential or no preservation Alkenone and d 18 O data suggest agreement in some parts of the world ocean u Not all Ocean margins and enclosed seas u Probably cooler – no data or unique assemblages limit confirmation of speculation
 Large LGM Cooling: Pros n n Margins of tropical and subtropical mountain glaciers u Descended 600 -1000 m t Using modern lapse-rate cooling suggests 4 -6°C cooling Descent of tree line and other vegetation on tropical mountains u Lapse-rate cooling again suggests 4 -6°C drop in temperature
 u Change") Large LGM Cooling: Cons Terrestrial cooling uses modern lapse-rate (6. 5°C km-1) u Change of only 1°C km-1 would resolve discrepancies u Consistent with models assuming steeper lapse-rate in drier glacial tropics n Terrestrial environments difficult to date n Suggestion that plants are sensitive to CO 2 u Require growth was limited by CO 2 t Could help explain lower vegetation lines n
Large LGM Cooling: Cons Terrestrial cooling uses modern lapse-rate (6. 5°C km-1) u Change of only 1°C km-1 would resolve discrepancies u Consistent with models assuming steeper lapse-rate in drier glacial tropics n Terrestrial environments difficult to date n Suggestion that plants are sensitive to CO 2 u Require growth was limited by CO 2 t Could help explain lower vegetation lines n
 Logical Conclusions n Marginal basins colder than CLIMAP estimates u Logical that shallow basins cool more than deep ocean t Open ocean cooled a little t Land cooled a lot t Coastal regions cooled somewhat more than deep oceans