

057006af6fe7309c5e7451f74ffe5a40.ppt
- Количество слайдов: 76

 Climate change – how to address the energy dilemma? Lars Rydén Baltic University Programme Centre for Sustainable Development Uppsala University www. balticuniv. uu. se BUP teachers’ Conference St Petersburg, Russia 25 -27 November 2009
 Basics of Climate Change When fossil coal, oil and gas is burnt carbon dioxide is produced and adds to carbon dioxide in the atmosphere. There it works as a greenhouse gas (GHG), causes the enhanced greenhouse effect, and contributes to global warming. The climate system of our planet is complicated. It is studied since 25 years by the Intergovernmental Panel of Climate Change, IPCC reports that there is a global warming going on and it is caused by increased emissions of GHG from society. The present concentration of carbon dioxide in atmosphere will cause an estimated warming of 2 o. C on the average, but it may be more and up to 5 -6 o. C if emissions continue as today. This will lead to serious impacts. Learning to live with climate change is called adaptation. Efforts to reduce climate change is called mitigation.
 Fossil carbon use – CO 2 in atmosphere – global warming
 Film Greenhouse gases
 The Greenhouse effect
 The steamy summer 2003 - unusual or normal? Source: Stott et") Temperature Anomaly (K) The steamy summer 2003 - unusual or normal? Source: Stott et al. Nature 432, 610 -614, 2004
Temperature Anomaly (K) The steamy summer 2003 - unusual or normal? Source: Stott et al. Nature 432, 610 -614, 2004
 The steamy summer of 2003 Casualties Economic effects www. grid. unep. ch/product/publication/download/ew_heat_wave. en. pdf
 2003 was hot but already 2005 was even hotter. 2005 was the warmest year so far recorded 2009: The top 11 warmest years on record have all been ín the last 13 years.
 Global warming is perceived in many ways: - increased average temperature - retreating glaciers - sea level rise - increased desertification - decreased ground water - increased abnormal weather events - plants and animals move north
 Extreme weather
 Sea level rise
 Glacier retreat in Alaska, America in 1914 and 2004
 Something is happening much faster than we understand Arctic Sea Ice 2007 Source: National Snow and Ice Data Center
 Surprise: Arctic sea ice Stroeve, J. , Holland, M. M. , Meier, W. , Scambos, T. and Serreze, M. , 2007. Arctic sea ice decline: Faster than forecast. Geophys. Res. Lett. , 34: L 09501.
 Tipping points J. Schellnhuber, in Steffen, et al. , Challenges of a Changing Earth, 2002
 A Global Transition is Happening. . . Faster than We Understand ? Alan At. Kisson
 Global temperature and CO 2 concentration 400 000 year data from ” Vostok iskärnan”
 Sectors Impacted by Climate Change
 flows between the atmosphere, the") The global carbon flows Carbon (mostly as CO 2) flows between the atmosphere, the greenery on the planet, the soil and the oceans. All these flows have been increased greatly by emptying the carbon stores of fossils from the crust of the Earth. There are carbon sinks and carbon sources. A growing forest is a carbon sink. A overused soil is a carbon source. When carbon is stored/bound in e. g. soil it is called sequestration.
The global carbon flows Carbon (mostly as CO 2) flows between the atmosphere, the greenery on the planet, the soil and the oceans. All these flows have been increased greatly by emptying the carbon stores of fossils from the crust of the Earth. There are carbon sinks and carbon sources. A growing forest is a carbon sink. A overused soil is a carbon source. When carbon is stored/bound in e. g. soil it is called sequestration.
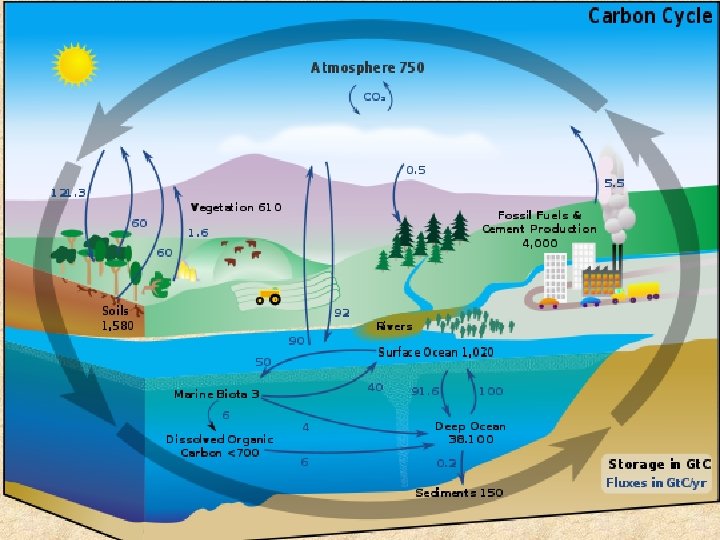
 The global carbon flows From fossil carbon stores. Due to oil-dependent society; causing loss of a non-renewable resource. From soil to atmosphere. Due to mismanagement of soil; causing desertification. From forests to atmosphere. Due to deforestation; causing biodiversity loss. From atmosphere to oceans. Due to increased CO 2 in atmosphere; causing acidification of the seas. Where to intervene? Many of these flows can be stopped and turned around. Stop combustion of fossils. Good management of soil, End deforestation;
 A different view on development
 Something New Under the Sun John Mc. Neill, 2000 Development 1900 – 2000 • global population 4 x • global economy 14 x • industrial production 40 x • energy use 16 x • carbon dioxide emissions 17 x • sulphur dioxide emissions 13 x • ocean fishing catches 35 x • number of pigs 9 x • forests 0. 8 x • agricultural fields 2 x • blue whale 0. 0025 x
 A Global Transition is Happening. . . Faster than We Understand Source: International Geosphere-Biosphere Program
 Human influence seen from space http: //visibleearth. nasa. gov
 The Global Ecological Footprint Source: Living Planet Report 2006, WWF
 The ecological footprint Total footprint – it is for us now about 5 ha (1. 8 ha is available per capita globally) The footprint may be divided: What you eat – the foodprint (e. g. as ton C) Water used – water footprint (as m 3 water) Fossil carbon used – carbon footprint (tonnes C; it is now about 5 tonnes/cap/y, need to be negative)
 Development! From Wackernagel and Reese
 Basic scenario in Limits to Growth 2003 World 3 Meadows et al, Limits to growth A thirty years update
 Planetary Boundaries
 Planetary boundaries Climate 350 ppm CO 2 +1 W/m 2 Ozone depletion 276 DU Atmospheric aerosol loading Biogeochemical loading 35 MT N/yr 11 MT P/yr TBD Ocean acidification Biodiversity loss Aragonite saturation ratio > 2. 75 10 E/MSY Agricultural land use 15% J. Rockström et al Nature, September 24, 2009 Freshwater use 4000 km 3/yr Chemical pollution TBD
 Planetary boundaries Rockström, J. et al. , 2009. Nature, September 24, 2009.
 Changing ocean p. H 1870 20002009 Source: Guinotte, et al. , Coral Reefs 22, 551 -558, 2003 p. CO 2 = 280 ppmv p. CO 2 = 375 ppmv
 Changing ocean p. H 20202029 20402049 Source: Guinotte, et al. , Coral Reefs 22, 551 -558, 2003 p. CO 2 = 415 ppmv p. CO 2 = 465 ppmv
 Changing ocean p. H 20202029 Source: Guinotte, et al. , Coral Reefs 22, 551 -558, 2003 p. CO 2 = 517 ppmv
 Tropical coral reefs of the future Examples of reefs from the Great Barrier reef that are analagous to the state of coral reefs in the future under different climate scenarios CRS-A, CRS-B and CRS-C. CRS-A = conditions stabilised at todays CO 2 levels. IPCC scenario B 1 is predicting 550 ppm CO 2 by 2100 and A 2 800 ppm.
 Forging into the Anthropocene We have moved well outside the envelope of our historical experience in terms of our relationship with our planet J. Rockström et al Nature, September 24, 2009
 Planetary Boundaries: Exploring the safe operating space for humanity in the Anthropocene (Nature, 461 : 472 – 475, Sept 24 - 2009)
 Planetary boundaries: authors Johan Rockström, Will Steffen, Kevin Noone, Åsa Persson, F. Stuart Chapin, III, Eric F. Lambin, Timothy M. Lenton, Marten Scheffer, Carl Folke, John Schellnhuber, Björn Nykvist, Cynthia A. de Wit, Terry Hughes, Sander van der Leeuw, Henning Rodhe, Sverker Sörlin, Peter K. Snyder, Robert Costanza, Uno Svedin, Malin Falkenmark, Louise Karlberg, Robert W. Corell, Victoria J. Fabry, James Hansen, Diana Liverman, Katherine Richardson, Paul Crutzen, Jonathan A. Foley
 Our ”home” ?
 The future of energy
 Lignite power plant Belchatow, Poland
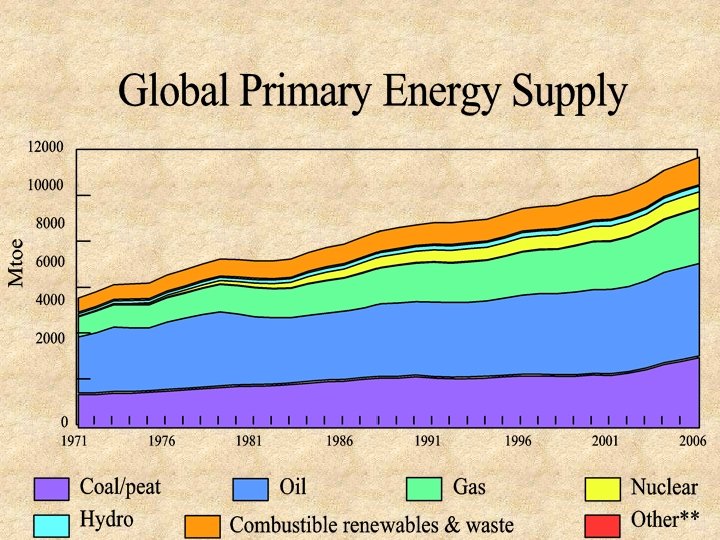
 The future of energy The end of the Oil Age
 ASPO PO; Association for the Study of Peak Oil
 The peak oil dilemma ASPO; Association for the Study of Peak Oil
 But it does not have to be like this. We did not leave the stone age because there were no more stones. We may leave oil age even if some oil is still there. .
 The carbon content of the energy From Decoupling, Azar, Holmberg and Karlsson, Chalmers University of Technology, 2002 based on IEA statistics
 Hydropower plant Harsprånget, Sweden
 Torraca, Italy, has LED for all street lights
 Building a passive energy House in Hamburg
 Technologies for energyefficient buildings • Smart windows • Sensors for temp & air quality • Photocatalytic air cleaning • (Day)lighting systems • Ventilation systems • Heat storage • Many others Source: Ångström Laboratories, Uppsala University
 Karlsson, S. , A") Why demand management is better than increased production (supply management) Karlsson, S. , A Sustainable Baltic Region, BU Press 1997
Why demand management is better than increased production (supply management) Karlsson, S. , A Sustainable Baltic Region, BU Press 1997
 Fermentation plant produces biogas from food waste
 48 buses in the town runs on locally produced biogas
 Distributed generation - solar panel fields City of Uppsala, Sweden 4300 m 2
 Integration Fossil-free Enköping Wastewater Treatment plant nutrients wood chips wastewater The city district heating Salix cultivation hot water electricity Energy plant
 STO-STV 080 -20070129 -A 1 -Binder-Synthesis Global cost curve of GHG abatement opportunities beyond business as usual 2030 Cost of abatement EUR/t. CO 2 e * * * * Smart transit Small hydro Industrial non-CO 2 Airplane efficiency Stand-by losses * * * Industrial feedstock substitution Livestock/ CCS EOR; soils New coal Forestation Nuclear * * * * Sugarcane biofuel * * * Cellulose Industrial ethanol non-CO 2 Waste Avoid deforestation Asia Solar * * CCS; new coal * * Avoided deforestation America Industrial motor systems * * Fuel efficient commercial vehicles Abatement Gt. CO 2 e/year • ~27 Gton CO 2 e below 40 EUR/ton (-46% vs. BAU) • ~7 Gton of negative and zero cost opportunities • Fragmentation of opportunities Insulation improvements 59 * Industrial CCS Air Conditioning Lighting systems * © Vattenfall AB * Soil Forestation Co-firing biomass Fuel efficient vehicles Water heating * * * Wind; low pen. CCS; coal retrofit Coal-togas shift
 Urban space for transportation Photo: City of Munster, Germany
 Hermann Knoflacher TU Wien Eisenstadt before: 10 000 cars 6000 pedestrians daily
 Hermann Knoflacher TU Wien Built environment influences behaviour
 Urban bicycle track networks Stockholm Copenhagen
 EU-15 municipal waste flows 2003. Average 580 kg/year/capita
 Source separation in Turku, Finland 2005 2007 ? Energy waste Bio waste Paper Mixed waste Paper Glass Metal Glass Cardboard non-combustible waste
 Recycling saves much energy Iron from recycled iron requires 6 times less energy. Copper from recycled copper requires 30 times less energy. Aluminium even more! Paper recycled 6 times saves 60 % of the energy for paper production (and much forest). etc.
 The Sustainability Challenge: A new – sustainable – development requires - Lifestyle changes - Technological development - The rules have to be right - International cooperation How do we come there?
 Millennium Ecosystems Assessment, 2005 Detroit Free Press, April 4 2005 It is not a budget failure! It is a political one!
 The big development shifts 600 The origin of the modern world; science revolution 750 Enlightenment - Development based on science and understanding. intellectual 850 Industrialism – Development based on fossil energy resources and machines; Consumer goods produced on large scale. Capitalism, urbanisation. 900 Social developments – Development based on education and a strong civil society; Or Marxism-Leninism. democracy, 950 Post-war optimism; Development based on economic resource use and the strong state. growth, 1 Neoliberal market economy (Thatcherism); private sector growth; globalisation and ICT; financial flows 000 A new development is needed; climate change and resource limitations starts to be understood; Sustainable Development
 Who are the actors ? Actor/Action Reso Poli- Legal urces cies rules global Pro- Produ Practijects ction calities Life styles x region x x nation x x municipality company family individual x x x
 Personal and Family level Environmental Management “at home” Simple system to start ”live as you learn” Make the project trustworthy Six components - Energy Water Waste Procurement Transport Information Simple to introduce Realistic to use Instructions on the website
 ”EMS at Home” 1. Energy, reduce and save especially if fossil Turn off lamps in empty rooms, use low energy bulbs, do not leave machines in stand-by if not needed, check windows and doors for leakage, adjust temperature, use if possible green energy 2. Water to be used sparingly, especially hot water Check toilets for leakage, use regulated faucets 3. Waste to be sorted in fractions and if possible recycled Paper, burnable, organic (compostable), glass, metal, recycling of cans etc
 Use public transport") ”EMS at Home” 4. Transport (in, and to & from work) Use public transport if possible, shared car use, use bike when possible, use green vehicles when possible 5. Procurement Check origin of office material (paper etc), buy CSR and/or green marked foodstuff, use detergents without phosphorus 6. Information Be sure your environmental management is visible; include basic understanding of EM in all courses
”EMS at Home” 4. Transport (in, and to & from work) Use public transport if possible, shared car use, use bike when possible, use green vehicles when possible 5. Procurement Check origin of office material (paper etc), buy CSR and/or green marked foodstuff, use detergents without phosphorus 6. Information Be sure your environmental management is visible; include basic understanding of EM in all courses
 Uppsala project – Local energy • • In general all activities may reduce energy costs by 20 % Swimming hall – recycling of water, solar panels District heating Using excess steam from industry for district heating Exchange of traffic lights to LED Farmers – local biogas production Small industry – turning waste into biogas
 Future alternative energy sources • • • Wind power, already well established Hydro power – use what is already there Wave power – now coming CSP – Concentrated Solar Power, CSP, growing Photovoltaic – growing rapidly Flowing water energy – being developed
 Joachim H. Spangenberg SERI, Germany Thank you!