

6119ae58943b6756e099f78b90dd6be0.ppt
- Количество слайдов: 23
 Climate Change and the European Union’s Emission Trading Scheme The Challenge for Indian Airlines Panagiotis Karamanos & Michael O’Connor* Environmental Experts, in EU-India Collaboration “Institutional Capacity Building for the Civil Aviation Sector in India, ” from Athens International Airport June 24, 2011 *This document represents the views of the above authors only
 Discussion 1. European Union’s approach to climate change 2. Aviation and the Emission Trading Scheme 3. Responsibilities of Indian airlines
 European Union’s response Q Ratification of Kyoto Protocol by all EU Member States in 2002 Q EU target: 8% reduction distributed amongst its Member States (e. g. Germany -21%, UK -12. 5%, Greece +25%) Q Generally aggressive position on climate change compared to other developed nations as shown by 2020 targets: Q Reduce GHG emissions by at least 20% vs. 1990 Q Increase share of renewable energy to 20% Q Increase energy efficiency by 20% Q Comprehensive policy and instruments to back up 2020 targets including the world’s largest Emission Trading Scheme (ETS) for GHGs
 EU Emission Trading Scheme Q Established through Directive 2003/87/EC Q Covers 10, 000+ installations (>20 MW) ~50% of EU’s CO 2 Q Member States set National Emission Caps and allocate allowances for free and increasingly by auction Q Participants exceeding their allowed emission quota may purchase allowances from other, cleaner participants, purchase approved emission reduction credits through Clean Development Mechanisms or Joint Implementation projects, or pay a fine Q 1 st Trading Period: 2005 -2007 completed Q 2 nd Trading Period: 2008 -2012 in progress Q Annual monitoring, verification & reporting of emissions
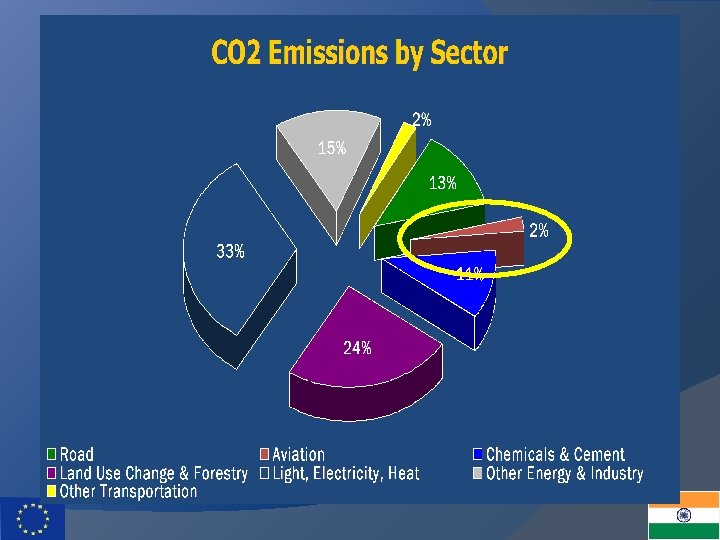
 Multiple contributors & stakeholders Q Airport operators 5% of the 2% share (i. e. 0. 1% of the emissions) is attributable to airports Q Greater airport community (handling, cargo, retail, etc. ) Q Passengers (business, tourism) Q International Civil Aviation Authority (ICAO) and local Civil Aviation Authorities Q Airlines Q Aircraft manufacturers Q Engine manufacturers
 What are airports doing about climate change? Airport Carbon Accreditation “ACI EUROPE and its members commit to reduce carbon emissions from airport operations fully within their own control with the ultimate target to become carbon neutral. ”
 Levels of accreditation & participants Level 1: Mapping Ankara, Antalya, Bologna, Budapest, Chisinau, Cork, Dublin, Dubrovnik, Farnborough, Istanbul, Izmir, Portuguese Airports, Prague, Shannon, Toulouse-Blagnac Airport Level 2: Reduction Athens International Airport, Brussels, Charles de Gaulle, Frankfurt, Hamburg, Kristiansand, Manchester, Orly Level 3: Optimisation Amsterdam, Heathrow, Gothenburg, Munich, Zurich Level 3+: Neutrality Göteborg Landvetter, Linate, Malpensa, Oslo, Stockholm, Trondheim, Umea
 in 2009 Q Upgraded to") Athens International Airport Q Accredited at Level 1 (Mapping) in 2009 Q Upgraded to Level 2 (Reduction) in 2010 Q Emission reduction target: 25% reduction in CO 2 emissions (Scope 1 and 2) by 2020 using 2005 as a baseline year Q Climate Change Corporate Action Plan since 2008: Q Conversion of vehicles to LPG / purchase of hybrid vehicles Q Investment in energy-saving technology (hardware & software) Q 50% recycling rate target for 2012 / use of recycled materials Q Vravrona wetlands protection programme Q 8 MW photovoltaic park under construction
Athens International Airport Q Accredited at Level 1 (Mapping) in 2009 Q Upgraded to Level 2 (Reduction) in 2010 Q Emission reduction target: 25% reduction in CO 2 emissions (Scope 1 and 2) by 2020 using 2005 as a baseline year Q Climate Change Corporate Action Plan since 2008: Q Conversion of vehicles to LPG / purchase of hybrid vehicles Q Investment in energy-saving technology (hardware & software) Q 50% recycling rate target for 2012 / use of recycled materials Q Vravrona wetlands protection programme Q 8 MW photovoltaic park under construction
 Multiple contributors & stakeholders Q Airport operators 5% of the 2% share (i. e. 0. 1% of the emissions) is attributable to airports Q Greater airport community (handling, cargo, retail, etc. ) Q Passengers (business, tourism) Q International Civil Aviation Authority (ICAO) and local Civil Aviation Authorities Q Airlines Q Aircraft manufacturers Q Engine manufacturers
 What about aircraft emissions? Q In 2009 the States belonging to the International Civil Aviation Organisation (ICAO) agreed to the following: Q a global goal of 2% annual improvement up to 2050 Q further explore more ambitious emission reductions including carbonneutral growth Q development of a global CO 2 standard for aircraft Q development of a framework for market-based measures, such as emissions trading, in international aviation Q further financial and technical assistance to States Q submission of States’ action plans which outline their policies and actions as well as annual reporting of aviation fuel consumption.
 4 -pillar strategy calls for") What about airlines? Q IATA’s (International Air Transport Association) 4 -pillar strategy calls for improvements in: Q Technology (airframe design and materials, engine efficiency, alternative fuels, etc. ) Q Operational Efficiency (aircraft and ground operations) Q Infrastructure (Air Traffic Management, airport capacity) Q Economic Instruments (emissions trading, emissions charges) Q Challenge: to be environmentally effective and economically feasible
What about airlines? Q IATA’s (International Air Transport Association) 4 -pillar strategy calls for improvements in: Q Technology (airframe design and materials, engine efficiency, alternative fuels, etc. ) Q Operational Efficiency (aircraft and ground operations) Q Infrastructure (Air Traffic Management, airport capacity) Q Economic Instruments (emissions trading, emissions charges) Q Challenge: to be environmentally effective and economically feasible
 Inclusion of aviation in EU ETS Q EU is implementing the first ETS to address aviation Q Aviation included in EU ETS through Directive 2008/101/EC Q All (European and foreign carrier) flights landing at or taking off from airports in EU Member States Q De minimis: airlines with less than 1 round-trip flight to / from the EU per day are exempt as well as some types of flights (training, military, research, etc. ) Q Inclusion starts in 2012 and continues through next period: 2013 -2020
 Inclusion of aviation in EU ETS Q Benchmark set at average of 2004 -2006 emissions in order to account for considerable growth in aviation since 1990 Q Emissions cap: 97% of benchmark in 2012 decreasing to 95% in 2013 Q Allowances allocation (2012): 85% free/15% auctioned Q Allocation is determined by an airlines’ share of tonnekilometers 2 years earlier, e. g. 2010 share for 2012 Q Participants exceeding their allowed emission quota may: Q purchase allowances from other participants (airlines and thermal installations) Q purchase approved emission reduction credits Q or pay a fine
 Indian carriers & EU Administering Member State Air India, Jet Airways India UK Go Airlines, Indigo, Jet Lite India Ltd France Kingfisher Airlines Cyprus
 Requirements for Indian airlines Q For those Indian airlines flying into / out of European airports meeting the criteria for inclusion in the EU ETS must have already: Q submitted an annual emissions and tonne-kilometer monitoring plan in August 2009 for approval by the relevant EU Member State Q started monitoring emissions and tonne-kilometer data since January 2010 Q submitted externally verified emissions and tonnekilometer data for 2010 by March 2011 (and every March thereafter) Q receive free allowances based on benchmark calculation in February 2012
 2012 and beyond Source: Verif. Avia
 A simplified example of how the EU ETS works
 How are 2012 allowances allocated? Average 2004 -2006 emissions: 200, 000 tonnes 2012 Cap: 194. 000 Free allowances: 165. 000 Auctioned allowances: 29. 000
 How will the 165, 000 free allowances be allocated between airlines? 2010 Tonne-Kilometers = Σ (Payload x Distance) Calculate Tonne-Kilometers of Air Greece: Calculate Tonne-Kilometers of Clean. Air: Calculate Tonne-Kilometers of Propell. Air: TOTAL Tonne-Kilometers: 2012 Free Allowances: Air Greece: Clean. Air: Propell. Air: 165, 000 82, 500 49, 500 33, 000 500, 000 TK (50 %) 300, 000 TK (30 %) 200, 000 TK (20 %) 1, 000 TK
 How much did my airline emit in 2012? Emissions = Mass of Fuel x 3. 15 tonnes CO 2 per Consumed tonne Fuel Airline Fuel Consumption (tonnes CO 2) 26, 190 Emissions Clean. Air 12, 000 37, 800 Propell. Air 15, 000 47, 250 Air Greece 82, 500
 Does my airline have enough allowances for 2012? Airline Emissions Allowances Status Air Greece 82, 500 OK Clean. Air 37, 800 49, 500 Sell Propell. Air 47, 250 33, 000 Buy/Invest
 Concluding Remarks Q Inclusion of aviation in EU ETS is a reality Q Rules are relatively clear Q EU ETS is somewhat flexible Q Several Indian airlines are required to participate Q Actual impact to be evaluated in 2013 and beyond