

4c7ed34cd739836f77c0a5722396810b.ppt
- Количество слайдов: 79
 Mundra Port") Clean Development Mechanism & Agriculture Sector Shalin Shah – Sr. Manager (Environment) Mundra Port & SEZ, Adani Group Honorary Joint Secretary - NCCSD 1
Clean Development Mechanism & Agriculture Sector Shalin Shah – Sr. Manager (Environment) Mundra Port & SEZ, Adani Group Honorary Joint Secretary - NCCSD 1
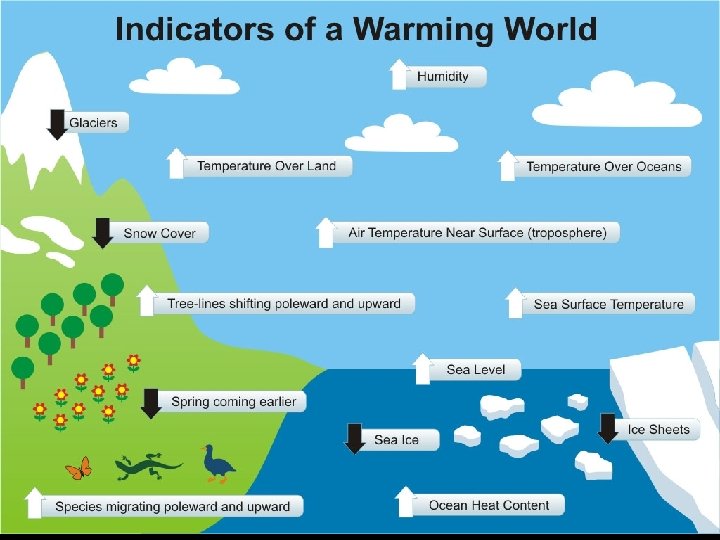
 Background for presentation n n Climate Change, Global Warming are well known terms world over. So I will not discuss anything on the basics of Climate Change.
 Outline Mitigation of Global Warming Kyoto Gases & GWP The CDM – what & how? The CDM project Cycle India’s Position Types of CDM projects 5
,") Mitigation of Global Warming To tackle the challenges posed by global warming (climate change), United Nations made an agreement at the ‘ United Nations Conference on Environment and Development’ in 1992 in Rio De Janeiro, Brazil – a conference popularly known as the “Rio Earth Summit”. That agreement was “The United Nations Framework Convention on Climate Change” (UNFCCC). 6
Mitigation of Global Warming To tackle the challenges posed by global warming (climate change), United Nations made an agreement at the ‘ United Nations Conference on Environment and Development’ in 1992 in Rio De Janeiro, Brazil – a conference popularly known as the “Rio Earth Summit”. That agreement was “The United Nations Framework Convention on Climate Change” (UNFCCC). 6
 Rio Earth Summit & birth of UNFCCC 1992 1997 Kyoto Protocol adopted IPCC GHG inventory report 1990 IPCC constituted 1988 2005 2012 First commitment period ends Kyoto Protocol comes into force 2008 First commitment period starts …… 24 year story
 in 1992 foundation of global efforts") UNFCCC Signed by 154 states (plus the EU) in 1992 foundation of global efforts to combat global warming. Objective: “ The stabilisation of greenhouse gas (GHGs) concentrations in the atmosphere at a level that would prevent dangerous man made interference with the natural climate system. ”
UNFCCC Signed by 154 states (plus the EU) in 1992 foundation of global efforts to combat global warming. Objective: “ The stabilisation of greenhouse gas (GHGs) concentrations in the atmosphere at a level that would prevent dangerous man made interference with the natural climate system. ”
 Mitigation of Global Warming Kyoto Protocol • Amendment to the UNFCCC outlined in 1997 in Kyoto, Japan • Commitment for 38 developed countries to reduce GHG emissions by 5. 2% relative to 1990 levels • It must be achieved by 2008 – 2012 – first commitment period • Developed countries – bound with targets – Annex I countries – Such as: UK, Europe, Australia etc. • Developing countries – no targets – non annex I countries – Such as: India; Pakistan; China; Thailand; Malaysia; Mexico; Brazil etc. 10
 Outline Mitigation of Global Warming Kyoto Gases & GWP The CDM – what & how? The CDM project Cycle India’s position Types of CDM projects
 Kyoto Gases & GWP There are over 30 atmospheric greenhouse gases…But only 6 attract CC, so called ”Kyoto Gases” • Carbon Dioxide (CO 2) • Methane (CH 4) • Nitrous Oxide (N 2 O) • Perfluorocarbons (CXFX) • Hydrofluorocarbons (CXHXFX) • Sulphur Hexaflouride (SF 6) Relevant to biocarbon & industrial projects Relevant to industrial projects Each of these gases has a different warming potential 12
 Kyoto Gases & GWP Each of these gases has a different ‘radiative forcing’ capability and a different atmospheric residence time Need for a ‘common currency’, so that all such Kyoto gases are denominated in the same way Solution: develop a relative scale, using CO 2 as a reference gas 13
 CO 2 CH 4 N") Kyoto Gases & GWP Kyoto Gas (Green House Gas) CO 2 CH 4 N 2 O PFC HFC SF 6 Global Warming Potential (GWP) 1 23 310 6500 – 9200 140 – 11700 23900 Relative scale – everything is measured relative to CO 2 e. g. Methane is 21 times more potent as a Green House Gas than CO 2 e. g. Sulphur Hexafluoride is 23, 900 times more potent! 14
Kyoto Gases & GWP Kyoto Gas (Green House Gas) CO 2 CH 4 N 2 O PFC HFC SF 6 Global Warming Potential (GWP) 1 23 310 6500 – 9200 140 – 11700 23900 Relative scale – everything is measured relative to CO 2 e. g. Methane is 21 times more potent as a Green House Gas than CO 2 e. g. Sulphur Hexafluoride is 23, 900 times more potent! 14
 Outline Mitigation of Global Warming Kyoto Gases & GWP The CDM – what & how? The CDM project Cycle India’s Position Types of CDM projects
 Clean Development Mechanism ‘Flexibility Mechanisms’ of Kyoto Protocol Clean Development Mechanism (Achieving part of reduction obligations of developed countries through projects in developing countries that reduce GHG emissions) It is defined under Article 12 of the Kyoto Protocol Emission Trading (Trading of emission allowances between developed countries) Joint implementation (Transferring emission allowances between developed nations, linked to specific emission reduction projects) 16
 Clean Development Mechanism Purposes of CDM – two primary goals Developed countries can reduce emissions anywhere in the world They can count these reductions towards their own targets CDM allows developed countries to generate CC (Certified Emission Reductions, CERs) in developing countries Advantages for developed countries: relatively low-cost & politically acceptable Advantages for developing countries: inward investment, environmental & technology benefits 17
 GHG emissions CERs from a") Clean Development Mechanism Generation of CC Carbon credits (CERs) GHG emissions CERs from a CDM project are calculated as: CER = BE – PE Project start The Baseline Emissions (BE) is the amount of GHG that would have been emitted to the atmosphere in the absence of the CDM project activity. PE is the Project Emissions Historical Trend Time 18
Clean Development Mechanism Generation of CC Carbon credits (CERs) GHG emissions CERs from a CDM project are calculated as: CER = BE – PE Project start The Baseline Emissions (BE) is the amount of GHG that would have been emitted to the atmosphere in the absence of the CDM project activity. PE is the Project Emissions Historical Trend Time 18
 What is Carbon Credit ? Carbon credits are reduction in emission of GHGs caused by a project 1 CER = 1 tonne of CO 2 equivalent (e) reduction 1 CER = 1 Carbon Credit 1 VER = 1 Carbon Credit ( Earned Through Voluntary Route ) _______________ CER – Certified Emission Reduction VER – Voluntary Emission Reduction
 GHG reduction -") Qualification for CDM Project Clean Development Mechanism Five major criteria a) GHG reduction - real and measurable b) Contribution to the sustainable development of the host country c) No “diversion” of official development assistance d) Demonstration of Additionality e) Project after 2 August 2008 – Inform UNFCCC within Six months 20
Qualification for CDM Project Clean Development Mechanism Five major criteria a) GHG reduction - real and measurable b) Contribution to the sustainable development of the host country c) No “diversion” of official development assistance d) Demonstration of Additionality e) Project after 2 August 2008 – Inform UNFCCC within Six months 20
 Demonstration of Additionality Clean Development Mechanism Additional incentives provided by emission reduction credits, is a concept known as "additionality". It is the most significant requirement for a project to qualify for the CDM benefits. • Emission Additionality – Net decrease in GHG emission is called Emission Additionality. • Financial Additionality – Project funding should not be counted towards the financial obligations of the host country • Technological Additionality – CDM project activities should lead to transfer of environmentally safe & sound technologies. If the industry is legally mandated (bound to do any of the above by law) to undertake the project activity (e. g. use of CNG for public transport in Delhi), such a project is generally not eligible for CDM benefits. 21
 Additionality – benchmark analysis Revenue / NPV / IRR Choose an appropriate financial indicator and compare it with a relevant benchmark value: e. g. required return on capital or internal company benchmark Investment threshold Project without carbon element Project with carbon element Carbon revenue makes the project attractive relative to investment alternatives Project without carbon revenue is profitable – but not sufficiently profitable compared with alternatives
 Some examples of additionality ? Capturing methane from an urban landfill and flaring it — Carbon credits represent the only source of income for undertaking this activity Capturing methane from an urban landfill and utilizing it to generate electricity — Project developer would have to demonstrate that the electricity revenue alone would not make this project attractive Building a large hydro project for the grid in Ethiopia — Questionable additionality: there is already plenty of hydro activity in Ethiopia
 CDM – Cancun outcome n n n Issue - Continuation of CDM Post 2012 Progress / Decisions - Indications CDM will be part of new post-2012 scheme, despite on-going uncertainty over the future of the Kyoto Protocol Remarks Cancun conference decided that next year (at the next Climate Change Conference in South Africa), one or more new market based mechanism will be established. Any such new mechanism will maintain and build upon existing mechanisms, including those established under the Kyoto Protocol (like CDM)
 Outline Mitigation of Global Warming Kyoto Gases & GWP The CDM – what & how? The CDM project Cycle India’s position Types of CDM projects
 CDM Project Cycle CDM Approval Stages Responsible Parties Duration PP 2 – 6 Months A Project Design Project screening Development of PIN, PDD & PCN B Host Country Approval (HCA) Submission of PCN & PDD to NCDMA/DNA Presentation by PP during NCDMA meeting PP DNA 2 Months C Validation Submission of PDD & HCA approval letter to DOE 1 Month D Registration Submission of validation report & PDD to CDM EB 2 Months E Project Implementation and Monitoring Implementation of project Monitoring and recording of emissions PP Continuous F Verification and Certification Verification of emission reduction Certification of emission reduction DOE Once every year G Issuance of CER Submission of certificate given by DOE to CDM EB Issuance of CER to Project Proponent DOE CDM EB 10 or 21 Years (variable) 26
") CDM - Time Needed Vs. Time Taken Activities in CDM Cycle Time Needed (Weeks) Average Time Taken (Weeks) Reason for Delay Preparation of PIN, PCN, PDD 8 16 Resource Constraint, Lack of Knowledge, procedural changes etc. Host Country Approval 6 10 Delay in submission of required documents Validation 14 24 Delay in appointment of DOE, Amendment of frequent changes in methodology, Guidelines, Tool etc. Registration 4 -8 24 Delay in web-hosting by EB, Req. for Review, Under Review, Corrections Requested etc. Monitoring & Verification 52 70 Delay in appointment of DOE, Delay in webhosting by EB etc. Issuance of CER 4 12 Req. for Review, Under Review, Corrections Requested etc. CER Transaction 4 8 Delay in identifying buyers, ERPA signing, Buyer DNA approval etc. Total (Approx. ) 96 164
CDM - Time Needed Vs. Time Taken Activities in CDM Cycle Time Needed (Weeks) Average Time Taken (Weeks) Reason for Delay Preparation of PIN, PCN, PDD 8 16 Resource Constraint, Lack of Knowledge, procedural changes etc. Host Country Approval 6 10 Delay in submission of required documents Validation 14 24 Delay in appointment of DOE, Amendment of frequent changes in methodology, Guidelines, Tool etc. Registration 4 -8 24 Delay in web-hosting by EB, Req. for Review, Under Review, Corrections Requested etc. Monitoring & Verification 52 70 Delay in appointment of DOE, Delay in webhosting by EB etc. Issuance of CER 4 12 Req. for Review, Under Review, Corrections Requested etc. CER Transaction 4 8 Delay in identifying buyers, ERPA signing, Buyer DNA approval etc. Total (Approx. ) 96 164
 Project Design CDM Project Cycle Three major credentials Ø Ø Ø Project Idea") A) Project Design CDM Project Cycle Three major credentials Ø Ø Ø Project Idea Note (PIN): It includes the basic information and basic calculations to check the viability of the proposed project. It is not a mandatory document. Project Concept Note (PCN): It includes basic information about project and project developers, technology, finance, sustainable development criteria, project risks, baseline methodology etc. Mandatory document required for HCA Project Design Document (PDD): It is a project specific document which included expected emission reduction calculations and monitoring plan along with the elaborated information provided in the PCN. Mandatory document required by NCDMA; DOE and CDM EB 36
A) Project Design CDM Project Cycle Three major credentials Ø Ø Ø Project Idea Note (PIN): It includes the basic information and basic calculations to check the viability of the proposed project. It is not a mandatory document. Project Concept Note (PCN): It includes basic information about project and project developers, technology, finance, sustainable development criteria, project risks, baseline methodology etc. Mandatory document required for HCA Project Design Document (PDD): It is a project specific document which included expected emission reduction calculations and monitoring plan along with the elaborated information provided in the PCN. Mandatory document required by NCDMA; DOE and CDM EB 36
 Host Country Approval 37") B) Host Country Approval 37
B) Host Country Approval 37
 CDMValidation: Once the PDD has been completed and the HCA has been Project Cycle B. received, all documents along with HCA letter have to be submitted to DOE (Designated Operational Entity) for review and approval ( Validation). C. Registration: The DOE submits the validation report, validation opinion and a request for registration to the CDM EB. Registration of project by the CDM EB is an act of formal acceptance of the validated project. D. Project Implementation & Monitoring: Once the project has been registered, it can be implemented. From the point of implementation on, the project developer needs to monitor the project performance, according to the procedures laid out in validated monitoring plan of PDD. Verification & certification: The DOE verifies the data collected by the project developers according to the monitoring plan and certifies the total emission reductions actually occurred during the specified time period. E. Issuance of CERs: Based on the DOE certification, CDM EB issues the 38 CERs to the project proponent.
 Crediting period CDM mitigation projects • Project developers have two crediting period options: – A maximum of 7 years, which can be renewed up to 2 times (i. e. a potential total crediting period of 21 years) – A maximum of 10 years, with no option for renewal CDM sequestration projects (forestry) • Project developers have two crediting period options: – A maximum of 20 years, which can be renewed up to 2 times (i. e. a potential total crediting period of 60 years) – A maximum of 30 years, with no option for renewal
 A maximum of 10 years with no option of renewal Greenhouse gas emissions Crediting period Starting date of the crediting period enario e sc aselin b er the s und ion Emissions under the project scenario 10 years No renewal
 Greenhouse gas emissions Why not maximise the crediting period? Baseline must be reassessed by DOE at each renewal 7 years
 Greenhouse gas emissions Why not maximise the crediting period? Baseline must be reassessed by DOE at each renewal Emissions under the baseline scenario The baseline scenario may become less favourable Emissions under the project scenario 7 years
 Outline Mitigation of Global Warming Kyoto Gases & GWP The CDM – what & how? The CDM project Cycle India’s position Types of CDM projects
 Per Capita CO 2 Emissions 25 19. 18 20 15 10. 06 9. 54 10 4. 91 5 1. 31 India China Source: EIA 2008 Germany Japan U. S. A. 0
 Per Capita") TOP 20 Emitters of the World Country Total Emissions (MMt. CO 2) Per Capita Emissions (Tons/Capita) 1. China 6534 4. 91 2. United States 5833 19. 18 3. Russia 1729 12. 29 4. India 1495 1. 31 5. Japan 1214 9. 54 6. Germany 829 10. 06 7. Canada 574 17. 27 8. United Kingdom 572 9. 38 9. Korea, South 542 11. 21 10. Iran 511 7. 76 11. Saudi Arabia 466 16. 56 12. Italy 455 7. 82 13. South Africa 451 9. 25 14. Mexico 445 4. 04 15. Australia 437 20. 82 16. Indonesia 434 1. 83 17. Brazil 428 2. 18 18. France 415 6. 48 19. Spain 359 8. 86 20. Ukraine 350 7. 61 Source: EIA 2008
TOP 20 Emitters of the World Country Total Emissions (MMt. CO 2) Per Capita Emissions (Tons/Capita) 1. China 6534 4. 91 2. United States 5833 19. 18 3. Russia 1729 12. 29 4. India 1495 1. 31 5. Japan 1214 9. 54 6. Germany 829 10. 06 7. Canada 574 17. 27 8. United Kingdom 572 9. 38 9. Korea, South 542 11. 21 10. Iran 511 7. 76 11. Saudi Arabia 466 16. 56 12. Italy 455 7. 82 13. South Africa 451 9. 25 14. Mexico 445 4. 04 15. Australia 437 20. 82 16. Indonesia 434 1. 83 17. Brazil 428 2. 18 18. France 415 6. 48 19. Spain 359 8. 86 20. Ukraine 350 7. 61 Source: EIA 2008
 India’s Position March, 2005 First registration: 8 th First CER issued: 21 st August, 2005 Registered projects: 513 projects (as of July, 2010) HCA projects: 1704 projects (as of July, 2010) Estimated CER volume: 441 million CERs (39690 Crore INR, till 2012) if they are successfully registered by CDM-EB CERs issued: ~79. 11 million CERs The majority of registered project in India are renewable energy project focusing on hydropower, and wind energy 46
, 4% N 2") The CDM project pipeline Fossil fuel switch 3% Energy efficiency (industry), 4% N 2 O 2% Other 7% Hydro 26% Agriculture, 6% Biogas, 7% Landfill gas, 8% Energy efficiency (own generation) 9% Biomass energy 16% Wind 12%
The CDM project pipeline Fossil fuel switch 3% Energy efficiency (industry), 4% N 2 O 2% Other 7% Hydro 26% Agriculture, 6% Biogas, 7% Landfill gas, 8% Energy efficiency (own generation) 9% Biomass energy 16% Wind 12%
 India offers vast untapped market for Carbon Trading India today manufactures >25 million tons of steel. Installed capacity of electrical generation of >110, 000 MW power Produces over >200 million tons of foodgrains With GDP growth of 8. 5% against the energy consumption growth rate of 7. 5%
,") India offers…. . cont. Leading sectors, having GHG Mitigation potential include energy efficiency (45%), renewable energy (35%), methane emissions abatement (15%), and improvements in thermal energy generation sector (5%). In India, total C 02 -e emissions in 1990 were 10, 01, 352 Gg, which was approx. 3% of global emissions. The Power sector was the largest emitter of C 02, contributing 55% of national emissions. India would be requiring an additional 100, 000 MW of power by 2012.
India offers…. . cont. Leading sectors, having GHG Mitigation potential include energy efficiency (45%), renewable energy (35%), methane emissions abatement (15%), and improvements in thermal energy generation sector (5%). In India, total C 02 -e emissions in 1990 were 10, 01, 352 Gg, which was approx. 3% of global emissions. The Power sector was the largest emitter of C 02, contributing 55% of national emissions. India would be requiring an additional 100, 000 MW of power by 2012.
 India’s Position 50
 India’s Position Case Study Gujarat Fluoro Chemicals Limited: Registered on 8 th March, 2005 Claims ~ 3 million CERs (270 Crore INR) every year for reducing GHG by thermal oxidation of HFC 23 (GWP = 11700) Recent monitoring report (01/08/08 to 30/09/08) claimed ~ 1. 4 million CERs (126 Crore INR) Tamilnadu Spinning Mills Association (TASMA): Registered on 10 th June, 2007 Claims ~ 0. 69 million CERs (62 Crore INR) every year for reducing GHG by bundled wind power project in Tamilnadu Recent monitoring report (01/01/08 to 31/08/08) claimed ~ 0. 6 million CERs (48. 6 Crore INR) 51
 Installed Capacity (MW) Untapped") RE & EE Potential in India Sector Estimated Potential (MW) Installed Capacity (MW) Untapped Potential (MW) Wind 45, 195 7, 844. 52 37, 350. 48 Small Hydro (<25 MW) 15, 000 2, 045. 61 12, 954. 39 Biomass 16, 881 605. 8 16, 275. 2 --- 2. 18 --- Cogeneration bagasse 5, 000 719. 83 4, 280. 17 Waste to Energy 2, 700 55. 25 2, 644. 75 Solar Power Plant Source: Ministry of New and Renewable Energy, Govt. of India (As on 31 st December 2007) Energy Efficiency: 23, 000 MW (Assessed by World Bank, Source: FICCI)
RE & EE Potential in India Sector Estimated Potential (MW) Installed Capacity (MW) Untapped Potential (MW) Wind 45, 195 7, 844. 52 37, 350. 48 Small Hydro (<25 MW) 15, 000 2, 045. 61 12, 954. 39 Biomass 16, 881 605. 8 16, 275. 2 --- 2. 18 --- Cogeneration bagasse 5, 000 719. 83 4, 280. 17 Waste to Energy 2, 700 55. 25 2, 644. 75 Solar Power Plant Source: Ministry of New and Renewable Energy, Govt. of India (As on 31 st December 2007) Energy Efficiency: 23, 000 MW (Assessed by World Bank, Source: FICCI)
 Outline Mitigation of Global Warming Kyoto Gases & GWP The CDM – what & how? The CDM project Cycle India’s position Types of CDM projects
 Types of CDM Projects Small Scale CDM Projects Ø Small-scale projects can use simplified procedures. Ø The following types of projects are considered small-scale. ü Renewable energy projects: up to 15 MW capacity ü Energy efficiency projects: up to 60 GWh/yr reduction in energy consumption ü Other projects: up to 60 Kt. CO 2 equivalent (60, 000 CER) emission reduction o CH 4 recovery in wastewater treatment o Switching fossil fuels o Landfill CH 4 recovery 57
 Programmatic CDM offers new Opportunities Regular CDM Size-Distribution of Potential CDM Project Sites • Single site, stand-alone projects • ‘Carbon upgrades’ Bundled CDM Number of installations / units • Bundling several projects under a single PDD • All projects must be identified ex ante, and must start at the same time Programmatic CDM large medium Installation / unit size small • Addresses the ‘long tail’ of small units • Permits sector-wide transition to low-carbon economy • Particular relevance to Africa
 CDM Projects in Agriculture Sector Improved manure management Reduced enteric fermentation Improved/reduced chemical agri-inputs use (fertilizers, pesticides, herbicides, etc. ) Reduced machinery use (and/or lower fossil fuel intensity of conservation agriculture practices) Agronomic planning (selection of seeds and species with low chemical agri-inputs demand water requirements) Energy from dedicated crops Energy from agricultural residues, animal waste, and other on-farm organic waste Water management (water saving from improved water retention, reduced evaporation, ect. ) Improved irrigation techniques/technologies (i. e. drip and sprayer irrigation) Improved water management in rice cultivation
 = 1") Global contribution of agriculture to greenhouse gas emissions. 1 Pg (Peta gram) = 1 Gt (Giga tonne) = 1000 million tonnes. Source: Cool Farming Climate Impacts of Agriculture & Mitigation potential GREENPEACE 2008
Global contribution of agriculture to greenhouse gas emissions. 1 Pg (Peta gram) = 1 Gt (Giga tonne) = 1000 million tonnes. Source: Cool Farming Climate Impacts of Agriculture & Mitigation potential GREENPEACE 2008
 Mt CO 2 -eq CH 4+ N 2 O CH 4 CO 2 N 2 O CH 4+ N 2 O sources of agricultural greenhouse gases, excluding land use change
 GHG emissions from fossil fuel and energy use in farm operations and production of chemicals for agriculture. kg CO 2 -eq km-2 Tillage Application of agrochemicals Drilling or seeding Combine harvesting Use of farm machinery Pesticides (production) Irrigation Fertiliser (production) Total Pg CO 2 -eq 440 – 7360 180 – 3700 810 – 1430 2210 – 4210 Subtotal 220 – 9220 3440 – 44400 – 0. 007 – 0. 113 0. 003 – 0. 057 0. 015 – 0. 022 0. 034 – 0. 065 0. 059 – 0. 257 0. 003 – 0. 14 0. 053 – 0. 684 0. 284 – 0. 575 0. 399 – 1. 656
 Energy requirement and carbon dioxide emissions resulting from the production of different fertilisers Fertiliser Energy requirement Carbon dioxide emissions in in MJ kg-1 N kg (CO 2)/kg produced* Nitrogen 65 – 101 Phosporus 15 Potassium 8 Lime Manure N as manure 3. 294 – 6. 588 0. 366 – 1. 098 0. 366 – 0. 732 0. 110 – 0. 842 0. 026 – 0. 029 0. 6 – 2. 9
 Global carbon stocks in vegetation and top one metre of soils Biome Area Carbon Stocks (Pg CO 2 -eq) Carbon stock concentration (Pg CO 2 -eq M km-2) M km 2 Vegetation Soils Total Tropical forests Temperate forests Boreal forests Tropical savannas Temperate grasslands Deserts and Semi deserts Tundra Wetlands Croplands 17. 60 10. 40 13. 70 22. 50 12. 50 45. 50 9. 50 3. 50 16. 00 776 216 322 242 33 29 22 55 11 791 366 1724 966 1080 699 443 824 468 1566 582 2046 1208 1113 728 465 878 479 89 56 149 54 89 16 49 251 30 Total 151. 20 1706 7360 9066 60 Source: IPCC 2001, Land use, land use change and forestry.
: IPCC") Technical mitigation potential by 2030 of each agricultural management practice Source: IPCC (2007): IPCC Fourth Assessment Report: Climate Change: Mitigation of Climate Change.
Technical mitigation potential by 2030 of each agricultural management practice Source: IPCC (2007): IPCC Fourth Assessment Report: Climate Change: Mitigation of Climate Change.
 for each") Total technical mitigation potentials (all practices, all GHGs: Mt. CO 2 -eq/yr) for each region by 2030, Source: IPCC (2007): IPCC Fourth Assessment Report: Climate Change: Mitigation of Climate Change.
Total technical mitigation potentials (all practices, all GHGs: Mt. CO 2 -eq/yr) for each region by 2030, Source: IPCC (2007): IPCC Fourth Assessment Report: Climate Change: Mitigation of Climate Change.
 Economic potential for GHG Agricultural mitigation by 2030
 Simplified methodologies Aspect 1: Technology/measure: What would be specific examples for new sustainable technologies, management practice etc. (avail)able to reduce GHG emissions (e. g. reduced mechanization, low-tillage practices, or use of lighter machinery)?
 Simplified methodologies Aspect 2: Baselines Could you think of clear, logical and quantifiable procedures for the identification of baseline emissions, i. e. the scenario for GHG emissions in absence of the proposed activity/project?
 Simplified methodologies Aspect 3: Monitoring plan What would be simple, straight-forward monitoring measures /plans/indicators to verify GHG reductions throughout the life time of each respective activity/project?
 Simplified methodologies Aspect 4: Project boundary What is your idea of reasonable project boundaries (e. g. the physical, geographical boundaries of the agricultural field, including machinery used on the field but maybe excluding machinery used for processing or transportation) for quantifying GHG emission reductions?
 cause an increase in GHG") Simplified methodologies Aspect 5: Leakage Does the project/activity (indirectly) cause an increase in GHG emissions outside its project boundaries?
Simplified methodologies Aspect 5: Leakage Does the project/activity (indirectly) cause an increase in GHG emissions outside its project boundaries?
 Two Chinese Case Examples n Rural Household Biogas n Conservation Tillage
 Approved CDM methodologies For Biogas Digesters
 Emission inventory per household under the baseline scenario and the project scenario respectively (t. CO 2 e/year/household) Manure management CO 2 emissions or CH 4 emissions from coal burning biogas digester leakage Emissions per household Baseline 0. 66 1. 95 2. 61 Project 0. 20 0. 27 0. 47 Emission Reduction 2. 14
 Conservation Tillage n n n Conservation tillage is an integrated tillage system in which large amounts of crop straws are used to cover the soil and minimize all the possible tillage activities. Conservation tillage, which employs the technologies such as no tillage or minimum tillage, micro-terrain rebuilding, land covering, and controlling weeds with herbicides, is aimed to reduce the disturbance and increase the straw coverage to soil (Gao HW, 2005; Gao WS, 2007; Li HW, 2008). It is composed of four essential components (Di Y, 2008): n Planting techniques without tillage; n Covering soil with straws or plant residues; n Deeply loosing the soil; and n Integrated control techniques on weeds and pests.
 n n reduce the disturbance") Conservation Tillage – Increase in Soil Organic Carbon (SOC) n n reduce the disturbance on soils to protect soil organic matter from oxidization and mineralization Straw coverage adds more soil organic carbon, which means conservation tillage may increase soil organic carbon in different degrees affects soil temperature and moisture status, which in turn affects soil carbon stock indirectly. Soil temperature affects micro organisms’ activity, and determines the decomposing speed of soil organic matter Different tillage practices may have different effects on micro organisms’ activity, which may lead to varying accumulation of organic matter in soils.
Conservation Tillage – Increase in Soil Organic Carbon (SOC) n n reduce the disturbance on soils to protect soil organic matter from oxidization and mineralization Straw coverage adds more soil organic carbon, which means conservation tillage may increase soil organic carbon in different degrees affects soil temperature and moisture status, which in turn affects soil carbon stock indirectly. Soil temperature affects micro organisms’ activity, and determines the decomposing speed of soil organic matter Different tillage practices may have different effects on micro organisms’ activity, which may lead to varying accumulation of organic matter in soils.
 The area of conservation tillage and its percentage of sowing area and other farming methods in the USA (1990 -2004), unit Mha, % Source: United States Conservation Tillage Information Centre (CTIC) and Reports of Crop Stubble Management (2004).
 field experiment was conducted") Chinese case example n n n 7 -year (2003– 2009) field experiment was conducted near in Shandong province Soil at the site was a loam soil, 1. 345 per cent organic matter and p. H of 7. 1. Mean annual air temperature and precipitation in the area is 13. 0°C and 621 mm, respectively The cropping system is winter wheat-maize rotation. All straw of wheat and maize was returned to the soil after harvest.
Chinese case example n n n 7 -year (2003– 2009) field experiment was conducted near in Shandong province Soil at the site was a loam soil, 1. 345 per cent organic matter and p. H of 7. 1. Mean annual air temperature and precipitation in the area is 13. 0°C and 621 mm, respectively The cropping system is winter wheat-maize rotation. All straw of wheat and maize was returned to the soil after harvest.
 Information on application amount of straw amendment and nitrogen fertilizer, nitrogen in the straw
 Total GHG emissions under baseline
 Total GHG emissions under project activity
 Complete scenario – Emission Reduction
 Shri Sharad Pawar said during 4 th World Congress on Conservation Agriculture on 4 th Feb, 2009 New Delhi n n Conservation tillage or no-tillage is now being practised on almost 100 million ha area worldwide with the major countries being USA, Brazil, Argentina, Canada and Australia. In India alone, the area under conservation tillage has increased to more than 2 million ha.
 But n n At present, the international climate change agreement post 2012 is still under negotiation. It is still uncertain if cropland management, including conservation tillage practice, can become an eligible project activity under CDM post-2012. Therefore, considering the effects of conservation tillage of enhancing the soil carbon stock, incentives for farmers to take actions of enhancing carbon sequestration, as well as providing technical support for reaching an international climate change agreement and associated implementation post-2012, it is necessary to conduct a feasibility study of conservation tillage as an eligible project activity under CDM and methodology guidelines.
 Summary India has a very big role to play More opportunities even after 2012 Demand for CERs is likely to increase Market based instruments will play a key role Government and trade organizations have to put more efforts to create strong awareness of CDM specifically for SMEs
 Why all these to you? ? The audience I am addressing consists of Agriculture Specialists Secondly, the CDM project developers need to have certain capabilities such as: • Analytical thinking • Mathematical ability • Understanding of chemical processes and operations • Creative opinion The mother Earth needs our attention You have these qualities – Meaning YOU CAN DO IT !! 88
 Some Important Reference unfccc. int cdmindia. in cdmindia. com UNEP Risoe Centre
 oppenhagen Magic of urban C DM exico
 Let’s make the world a better place to live in Shalin Shah Environmental Engineer Email: shalinshah 65@gmail. com Mobile: +919879203702