

82e8d3a071372623e5bdd42c2e570d15.ppt
- Количество слайдов: 102
 Class 27: 28 April 2008 Planning and Analysis of a Height Modernization Survey using TM 58/59 GISC 3325 28 April 2007
 GPS-Derived Heights Part II Planning and Evaluating a GPS Vertical Survey NOAA, NOS, National Geodetic Survey
 Topics To Be Discussed Review of heights and accuracies A Guide for Establishing GPS-derived Orthometric Heights Sample project following NGS’ guidelines Discussion on base line processing and analysis of repeat base line results Discussion of adjustment procedures and analysis of results Height Modernization Initiative NGS web site and services
 Ellipsoid, Geoid, and Orthometric Heights “h = H + N” s th’ce r Ea rfa Su P Plumb Line Ellipsoid h Q Mean Sea Level N “Geoid” PO Ocean h (Ellipsoid Height) = Distance along ellipsoid normal (Q to P) N (Geoid Height) = Distance along ellipsoid normal (Q to PO) H (Orthometric Height) = Distance along plumb line (PO to P)
 = P (") GPS - Derived Ellipsoid Heights Z Axis P (X, Y, Z) = P ( , , h) h Earth’s Surface Zero Meridian Reference Ellipsoid Y Axis X Axis Mean Equatorial Plane
GPS - Derived Ellipsoid Heights Z Axis P (X, Y, Z) = P ( , , h) h Earth’s Surface Zero Meridian Reference Ellipsoid Y Axis X Axis Mean Equatorial Plane
 Simplified Concept of ITRF 00 vs. NAD 83 h 83 eters 2. 2 m NAD 83 Origin h 00 Earth’s Surface ITRF 00 Origin Identically shaped ellipsoids (GRS-80) a = 6, 378, 137. 000 meters (semi-major axis) 1/f = 298. 25722210088 (flattening)
 •") Expected Accuracies • GPS-Derived Ellipsoid Heights 4 2 centimeters (following NOS NGS-58 Guidelines) • Geoid Heights (GEOID 03) 4 4 Relative differences typically less than 1 cm in 10 km 2. 4 cm RMS about the mean nationally • Leveling-Derived Heights 4 Less than 1 cm in 10 km for third-order leveling
Expected Accuracies • GPS-Derived Ellipsoid Heights 4 2 centimeters (following NOS NGS-58 Guidelines) • Geoid Heights (GEOID 03) 4 4 Relative differences typically less than 1 cm in 10 km 2. 4 cm RMS about the mean nationally • Leveling-Derived Heights 4 Less than 1 cm in 10 km for third-order leveling
 Recommendations to Guidelines Based on Tests and Sample Projects • Must repeat base lines Different days 4 Different times of day » Detect, remove, reduce effects due to multipath and having almost the same satellite geometry 4 • Must FIX integers • Base lines must have low RMS values, i. e. , < 1. 5 cm
 Available “On-Line” at the NGS Web Site: www. ngs. noaa. gov
 Table 1. -- Summary of Guidelines
 Sample Project Showing Connections CS 2 CS 1 LN 2 PB 1 SB 1 LN 6 PB 3 CS 3 SB 4 LN 5 SB 3 LN 4 LN 3 PB 2 SB 2 LN 7 SB 5 PB 4 CS 4
") A Guide for Establishing GPS-Derived Orthometric Heights (Standards: 2 cm and 5 cm)
A Guide for Establishing GPS-Derived Orthometric Heights (Standards: 2 cm and 5 cm)
 3") A Guide for Establishing GPS-Derived Orthometric Heights (Standards: 2 cm and 5 cm) 3 -4 -5 System • Three Basic Rules • Four Basic Control Requirements • Five Basic Procedures
A Guide for Establishing GPS-Derived Orthometric Heights (Standards: 2 cm and 5 cm) 3 -4 -5 System • Three Basic Rules • Four Basic Control Requirements • Five Basic Procedures
 Three Basic Rules • Rule 1: 4 Follow NGS’ guidelines for establishing GPS-derived ellipsoid heights (Standards: 2 cm and 5 cm) • Rule 2: 4 Use latest National Geoid Model, i. e. , GEOID 03 • Rule 3: 4 Use latest National Vertical Datum, i. e. , NAVD 88
 Four Basic Control Requirements • BCR-1: Occupy stations with known NAVD 88 orthometric heights 4 Stations should be evenly distributed throughout project • BCR-2: Project areas less than 20 km on a side, surround project with NAVD 88 bench marks 4 i. e. , minimum number of stations is four; one in each corner of project • BCR-3: Project areas greater than 20 km on a side, keep distances between GPS-occupied NAVD 88 bench marks to less than 20 km • BCR-4: Projects located in mountainous regions, occupy bench marks at base and summit of mountains, even if distance is less than 20 km
 BCR Example BCR 1: Sketch indicates that the 20 km rule was met. BCR 2: This requirement is not applicable because the project is greater than 20 km on a side. BCR 3: Circled bench marks are mandatory. Analysis must indicate bench marks have valid NAVD 88 heights. Other BMs can be substituted but user must adhere to 20 km requirement. BCR 4: This requirement is not applicable because project is not in a mountainous region.
 Five Basic Procedures • BP-1: Perform 3 -D minimum-constraint least squares adjustment of GPS survey project 4 Constrain 1 latitude, 1 longitude, 1 orthometric height • BP-2: Analyze adjustment results from BP-1 4 Detect and remove all data outliers
 BP 2: After performing minimum constraint adjustment, plot ellipsoid height residuals (or d. U residuals) and investigate all residuals greater than 2 cm.
 BP 2: Station pairs with large residuals, i. e. , greater than 2. 5 cm, also have large repeat base line differences. NGS guidelines for estimating GPS-derived ellipsoid heights require user to re-observe these base lines. Following NGS guidelines provides enough redundancy for adjustment process to detect outliers and apply residual on appropriate observation, i. e. , the bad vector.
 • BP-3: Compute differences between GPSderived orthometric heights from minimumconstraint") Five Basic Procedures (continued) • BP-3: Compute differences between GPSderived orthometric heights from minimumconstraint adjustment in BP-2 and published NAVD 88 BMs
Five Basic Procedures (continued) • BP-3: Compute differences between GPSderived orthometric heights from minimumconstraint adjustment in BP-2 and published NAVD 88 BMs
 BP 3: All height differences are under 5 cm and most are less than 2 cm. Almost all relative height differences between adjacent station pairs are less than 2 cm. However, most of the height differences appear to be positive relative to the southwest corner of the project.
 • BP-4: Determine which BMs have valid NAVD 88 height") Five Basic Procedures (continued) • BP-4: Determine which BMs have valid NAVD 88 height values from results from BP-3 Differences need to agree 2 cm for 2 cm survey 4 Differences need to agree 5 cm for 5 cm survey 4 May detect systematic tilt over large areas » Solve for geoidal slope and scale 4 • BP-5: Perform constrained adjustment with results from BP-4 Constrain 1 latitude, 1 longitude, all valid orthometric height values 4 Ensure final heights not distorted in adjustment 4
Five Basic Procedures (continued) • BP-4: Determine which BMs have valid NAVD 88 height values from results from BP-3 Differences need to agree 2 cm for 2 cm survey 4 Differences need to agree 5 cm for 5 cm survey 4 May detect systematic tilt over large areas » Solve for geoidal slope and scale 4 • BP-5: Perform constrained adjustment with results from BP-4 Constrain 1 latitude, 1 longitude, all valid orthometric height values 4 Ensure final heights not distorted in adjustment 4
 BP 4: To detect and remove any systematic trend, a tilted plane is best fit to the height differences (Vincenty 1987, Zilkoski and Hothem 1989). After a trend has been removed, all the differences are less than +/- 2 cm except for one and almost all relative differences between adjacent station are less than 2 cm.
, of all the") BP 5: After rejecting the largest height difference (-2. 4 cm), of all the closely spaced station pairs only 3 are greater than 2 cm, 1 is greater than 2. 5 cm and none are greater than 3 cm.
BP 5: After rejecting the largest height difference (-2. 4 cm), of all the closely spaced station pairs only 3 are greater than 2 cm, 1 is greater than 2. 5 cm and none are greater than 3 cm.
 Elevation published to centimeters. Orthometric height determined by GPS.
 GPS-Derived Orthometric Heights Project
 Baltimore County Maryland, NAVD 88 GPS-Derived Orthometric Height Project
 Baltimore County, Maryland, NAVD 88 GPS-derived Orthometric Height Project Horizontal and Vertical Control
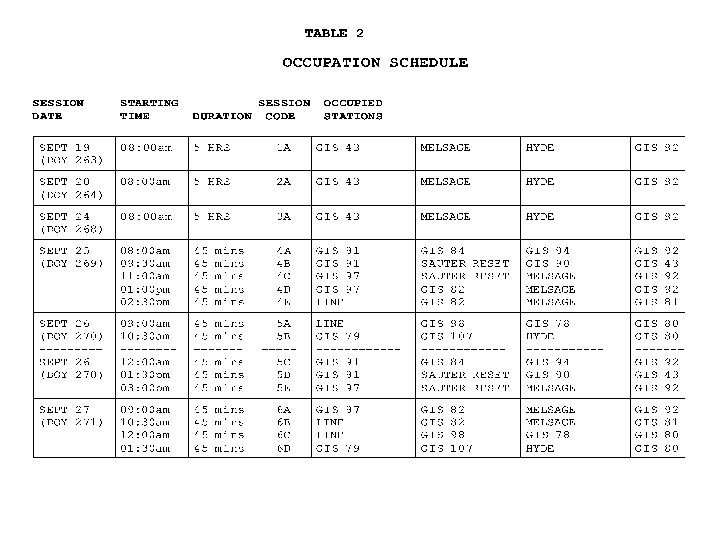
 Observation Sessions; Primary Control Day 263 = Project Day 1 Day 264 = Project Day 268 = Project Day 3 Session A for all days; 5 hour observations HYDES HARN 1 A, 2 A, 3 A 92 1 A , 3 A 1 A, 2 A MELSAGE HARN 1 3 A 2 A, A, KEY 1 A , 2 A, 3 A 1 A, 2 A, 3 A , 2 A , 3 A 43 Existing HARN New Primary Control Baltimore City
 Observation Sessions; Local Control Day 269 = Project Day 4 Day 270 = Project Day 5 Day 271 = Project Day 6 Session =A, B, C, D, E; 45 minute observations 92 4 C 4 D 5 E 6 A 4 A 5 C 4 D 4 A 4 A 5 C 5 C 5 C 4 A 4 D 6 A 91 4 D 5 E 6 A 5 E 5 D 4 E 6 B 81 4 E 6 B 6 B 6 B 4 E 6 C, 5 A 5 A LINE 6 C 78 6 C 5 A 5 E 5 D 5 D 43 4 B SAUTER RESET 5 A 6 C 6 D 5 B 6 D 79 5 B 6 D 5 B HYDES HARN 107 KEY 4 C 4 B 4 B 80 98 MELSAGE HARN 4 C 4 B 5 D 90 4 E 6 A 4 C 94 84 82 97 Baltimore City
 Repeat Baseline Differences
") Repeat Baseline Differences (Baselines less than 10 KM)
Repeat Baseline Differences (Baselines less than 10 KM)
 5 Hour Sessions") Height Differences (du) 5 Hour Sessions
Height Differences (du) 5 Hour Sessions
 45 Minute Sessions") Height Differences (du) 45 Minute Sessions
Height Differences (du) 45 Minute Sessions
 45 Minute Sessions (continued)") Height Differences (du) 45 Minute Sessions (continued)
Height Differences (du) 45 Minute Sessions (continued)
 45 Minute Sessions (continued)") Height Differences (du) 45 Minute Sessions (continued)
Height Differences (du) 45 Minute Sessions (continued)
 Vertical Free Adjustment Results GEOID 96
 Vertical Free Adjustment Results G 96 SSS
 Vertical Free Adjustment Results GEOID 93
 (Units = cm)") Baltimore County GPS-Derived Orthometric Height Project H GPS - H Leveling(88) (Units = cm) -0. 5 -0. 6 92 -0. 7 82 97 81 78 94 91 84 0. 0 -0. 4 -0. 3 90 -0. 2 -1. 5 MELSAGE HARN 0. 0 0. 5 0. 3 98 107 -2. 1 -0. 9 -1. 2 KEY 0. 0 GEOID 93 GEOID 96 -1. 0 43 79 LINE -0. 1 HYDES HARN 80 SAUTER RESET Baltimore City G 96 SSS
Baltimore County GPS-Derived Orthometric Height Project H GPS - H Leveling(88) (Units = cm) -0. 5 -0. 6 92 -0. 7 82 97 81 78 94 91 84 0. 0 -0. 4 -0. 3 90 -0. 2 -1. 5 MELSAGE HARN 0. 0 0. 5 0. 3 98 107 -2. 1 -0. 9 -1. 2 KEY 0. 0 GEOID 93 GEOID 96 -1. 0 43 79 LINE -0. 1 HYDES HARN 80 SAUTER RESET Baltimore City G 96 SSS
 Final Set of GPS-Derived Orthometric Heights GPS-derived Orthometric height relative to MELSAGE from minimally constrained adjustment (m) GPS-derived Orthometric height from final constrained adjustment (m) C=Constrained Minimally constrained minus final constrained adjustment (cm) GIS 43 84. 762 84. 777 C -1. 5 GIS 78 80. 697 80. 694 0. 3 GIS 79 77. 587 77. 589 -0. 2 GIS 80 81. 094 0. 0 GIS 81 97. 356 97. 357 -0. 1 GIS 82 199. 366 199. 372 -0. 6 GIS 84 129. 844 129. 851 -0. 7 GIS 90 146. 039 146. 046 -0. 7 GIS 91 167. 906 167. 910 C -0. 4 Station Name
 GPS-derived Orthometric height relative to MELSAGE") Final Set of GPS-Derived Orthometric Heights (cont. ) GPS-derived Orthometric height relative to MELSAGE from minimally constrained adjustment (m) GPS-derived Orthometric height from final constrained adjustment (m) C=Constrained Minimally constrained minus final constrained adjustment (cm) GIS 92 187. 745 187. 751 C -0. 6 GIS 94 168. 846 168. 851 -0. 5 GIS 97 200. 692 200. 703 -1. 1 GIS 98 79. 076 0. 0 GIS 107 145. 219 145. 228 C -0. 9 HYDE 102. 932 102. 935 -0. 3 LINE 130. 148 130. 143 C 0. 5 MELSAGE 161. 989 C 0. 0 SAUTER RESET 140. 895 140. 918 -2. 3 Station Name
Final Set of GPS-Derived Orthometric Heights (cont. ) GPS-derived Orthometric height relative to MELSAGE from minimally constrained adjustment (m) GPS-derived Orthometric height from final constrained adjustment (m) C=Constrained Minimally constrained minus final constrained adjustment (cm) GIS 92 187. 745 187. 751 C -0. 6 GIS 94 168. 846 168. 851 -0. 5 GIS 97 200. 692 200. 703 -1. 1 GIS 98 79. 076 0. 0 GIS 107 145. 219 145. 228 C -0. 9 HYDE 102. 932 102. 935 -0. 3 LINE 130. 148 130. 143 C 0. 5 MELSAGE 161. 989 C 0. 0 SAUTER RESET 140. 895 140. 918 -2. 3 Station Name
 Data Processing and Analysis of Repeat Base Line Results
 Vector Processing Controls • Elevation Mask - 15 degrees • Ephemeris - Precise • Tropospheric Correction Model • Iono Corrections - All baselines longer than 5 km. • Fix Integers 4 4 Baselines less than 5 km: L 1 fixed solution Baselines greater than 5 km: Iono free (L 3) solution • Looking for RMS - Less than 1. 5 cm
 Washington Monument Survey 1934 1999
 DY (m) DZ") L 1, Float Solution, Predicted Weather From To Session DX (m) DY (m) DZ (m) Vector 1 st - Next Length (m) 000 A WASH 231 B 230 B 229 A 231 A 23. 3958 -0. 2463 -0. 1140 0. 1718 0. 1387 -101. 5071 -0. 2060 0. 1148 -0. 2620 -0. 2439 142. 1077 -0. 0313 -0. 0838 0. 2073 0. 2101 176. 198 0. 060 -0. 149 0. 341 0. 328 868 H WASH 229 A 230 B 229 B 231 A 230 A 231 B 194. 0185 -0. 0135 -0. 1019 -0. 0053 -0. 0354 -0. 0983 -335. 8332 0. 2206 0. 1925 0. 0117 0. 0883 0. 1579 -176. 4013 -0. 2093 -0. 1924 -0. 0331 -0. 1207 -0. 1745 426. 080 -0. 093 -0. 119 0. 002 -0. 036 -0. 097 JEFF WASH 231 B 231 A 230 A 229 B 230 B 146. 1021 0. 1341 -0. 0595 -0. 1014 0. 0961 -129. 6425 -0. 2111 -0. 0776 0. 1360 0. 0648 80. 2985 0. 1901 0. 0688 -0. 1639 -0. 0276 211. 189 0. 295 0. 033 -0. 216 0. 016
L 1, Float Solution, Predicted Weather From To Session DX (m) DY (m) DZ (m) Vector 1 st - Next Length (m) 000 A WASH 231 B 230 B 229 A 231 A 23. 3958 -0. 2463 -0. 1140 0. 1718 0. 1387 -101. 5071 -0. 2060 0. 1148 -0. 2620 -0. 2439 142. 1077 -0. 0313 -0. 0838 0. 2073 0. 2101 176. 198 0. 060 -0. 149 0. 341 0. 328 868 H WASH 229 A 230 B 229 B 231 A 230 A 231 B 194. 0185 -0. 0135 -0. 1019 -0. 0053 -0. 0354 -0. 0983 -335. 8332 0. 2206 0. 1925 0. 0117 0. 0883 0. 1579 -176. 4013 -0. 2093 -0. 1924 -0. 0331 -0. 1207 -0. 1745 426. 080 -0. 093 -0. 119 0. 002 -0. 036 -0. 097 JEFF WASH 231 B 231 A 230 A 229 B 230 B 146. 1021 0. 1341 -0. 0595 -0. 1014 0. 0961 -129. 6425 -0. 2111 -0. 0776 0. 1360 0. 0648 80. 2985 0. 1901 0. 0688 -0. 1639 -0. 0276 211. 189 0. 295 0. 033 -0. 216 0. 016
 DY (m)") L 1, Partial Fixed Solution, Predicted Weather From To Session DX (m) DY (m) DZ (m) Vector 1 st - Next Length (m) 000 A WASH 229 A 231 A 230 B 229 B 231 B 23. 2992 0. 0054 -0. 0435 -0. 0236 -0. 1005 -101. 3609 -0. 0414 0. 1553 0. 0825 0. 1497 141. 9511 0. 0020 -0. 1650 -0. 0953 -0. 1596 175. 974 0. 026 -0. 228 -0. 128 -0. 228 868 H WASH 229 A 229 B 230 B 231 A 230 A 194. 0163 -0. 0323 -0. 0366 -0. 1028 -0. 0302 -0. 0070 -335. 8572 0. 1054 0. 1522 0. 1360 0. 0540 0. 0198 -176. 3620 -0. 0964 -0. 1457 -0. 1370 -0. 0590 -0. 0440 426. 082 -0. 058 -0. 076 -0. 097 -0. 032 -0. 001 JEFF WASH 230 A 230 B 229 B 231 A 146. 1764 0. 1508 -0. 0509 0. 0809 0. 1914 -129. 6260 0. 0315 0. 1939 0. 0107 -0. 1280 80. 2979 -0. 0017 -0. 2241 0. 0039 0. 1387 211. 230 0. 084 -0. 239 0. 051 0. 264
L 1, Partial Fixed Solution, Predicted Weather From To Session DX (m) DY (m) DZ (m) Vector 1 st - Next Length (m) 000 A WASH 229 A 231 A 230 B 229 B 231 B 23. 2992 0. 0054 -0. 0435 -0. 0236 -0. 1005 -101. 3609 -0. 0414 0. 1553 0. 0825 0. 1497 141. 9511 0. 0020 -0. 1650 -0. 0953 -0. 1596 175. 974 0. 026 -0. 228 -0. 128 -0. 228 868 H WASH 229 A 229 B 230 B 231 A 230 A 194. 0163 -0. 0323 -0. 0366 -0. 1028 -0. 0302 -0. 0070 -335. 8572 0. 1054 0. 1522 0. 1360 0. 0540 0. 0198 -176. 3620 -0. 0964 -0. 1457 -0. 1370 -0. 0590 -0. 0440 426. 082 -0. 058 -0. 076 -0. 097 -0. 032 -0. 001 JEFF WASH 230 A 230 B 229 B 231 A 146. 1764 0. 1508 -0. 0509 0. 0809 0. 1914 -129. 6260 0. 0315 0. 1939 0. 0107 -0. 1280 80. 2979 -0. 0017 -0. 2241 0. 0039 0. 1387 211. 230 0. 084 -0. 239 0. 051 0. 264
 DY (m) DZ") L 1, Float Solution, Recorded Weather From To Session DX (m) DY (m) DZ (m) Vector 1 st - Next Length (m) 000 A WASH 229 B 231 A 229 A 230 B 23. 4735 0. 0349 0. 1006 0. 1578 0. 1569 -101. 5769 -0. 0099 -0. 0148 -0. 0754 -0. 0359 142. 1521 -0. 0105 0. 0467 0. 0643 0. 0296 176. 284 0. 002 0. 060 0. 116 0. 065 868 H WASH 229 A 229 B 230 A 231 B 230 B 231 A 194. 1045 -0. 0472 0. 0599 -0. 0604 0. 0733 0. 0061 -336. 0715 -0. 0049 -0. 0952 -0. 0141 -0. 0290 -0. 0184 -176. 2377 -0. 0677 0. 0204 -0. 0716 -0. 0379 -0. 0120 426. 240 0. 010 0. 094 0. 013 0. 072 0. 022 JEFF WASH 230 A 230 B 231 B 229 B 231 A 146. 1589 0. 1522 0. 0187 0. 0319 0. 1027 -129. 5715 0. 1006 0. 1229 0. 0955 0. 1151 80. 2348 -0. 0685 -0. 1099 -0. 1089 -0. 0498 211. 161 0. 018 -0. 104 -0. 078 -0. 019
L 1, Float Solution, Recorded Weather From To Session DX (m) DY (m) DZ (m) Vector 1 st - Next Length (m) 000 A WASH 229 B 231 A 229 A 230 B 23. 4735 0. 0349 0. 1006 0. 1578 0. 1569 -101. 5769 -0. 0099 -0. 0148 -0. 0754 -0. 0359 142. 1521 -0. 0105 0. 0467 0. 0643 0. 0296 176. 284 0. 002 0. 060 0. 116 0. 065 868 H WASH 229 A 229 B 230 A 231 B 230 B 231 A 194. 1045 -0. 0472 0. 0599 -0. 0604 0. 0733 0. 0061 -336. 0715 -0. 0049 -0. 0952 -0. 0141 -0. 0290 -0. 0184 -176. 2377 -0. 0677 0. 0204 -0. 0716 -0. 0379 -0. 0120 426. 240 0. 010 0. 094 0. 013 0. 072 0. 022 JEFF WASH 230 A 230 B 231 B 229 B 231 A 146. 1589 0. 1522 0. 0187 0. 0319 0. 1027 -129. 5715 0. 1006 0. 1229 0. 0955 0. 1151 80. 2348 -0. 0685 -0. 1099 -0. 1089 -0. 0498 211. 161 0. 018 -0. 104 -0. 078 -0. 019
 Analysis of the Data Processing • Fixed solutions / low RMS • Repeatability of measurements • Analysis of loop misclosures • Be aware that repeatability and loop misclosures do not disclose all problems
 Repeat Vector Analysis From To Station BR 13 BR 14 BR 19 BR 20 BR 14 Session 0780 -0780 0770 -0770 0761 -0762 K 251 0780 -0780 0770 -0770 0762 -0761 GR 15 0780 -0780 0770 -0770 0762 -0765 CL 20 0781 -0781 0771 -0771 0762 -0763 BR 30 0782 -0782 0772 -0772 0760 -0763 VINT HILL 0782 -0782 0772 -0772 0760 -0763 dh Meters Diff cm 45. 974* 46. 004 -3. 0 46. 009 -3. 5 -12. 397 -12. 400 0. 3 -12. 408 1. 1 43. 680 43. 654* 2. 6 43. 607* 7. 3 54. 703* 55. 031 -32. 8 55. 007* -30. 4 28. 939 28. 947 -0. 8 28. 940 -0. 1 33. 045 33. 051 -0. 6 33. 063 -1. 8 Dist Meters RMS 1628 0. 016 0. 017 0. 015 0. 006 0. 022 0. 024 0. 020 0. 047 0. 022 0. 019 0. 014 0. 020 0. 011 0. 009 0. 013 673 1133 365 9850 11967 Solution Type L 1 float double L 1 fixed double L 1 fixed double L 1 fixed double Iono free fixed Iono free fixed *NOTE - Reprocess all vectors which have difference greater than 2 cm.
 Repeat Vector Analysis After Re-Processing From To Station BR 13 BR 14 BR 19 BR 20 BR 14 Session 0761 -0762 0770 -0770 0780 -0780 K 251 0770 -0770 0780 -0780 0762 -0761 GR 15 0780 -0780 0765 -0762 0770 -0770 CL 20 0771 -0771 0781 -0781 0762 -0763 BR 30 0782 -0782 0772 -0772 0760 -0763 VINT HILL 0782 -0782 0760 -0763 0772 -0772 dh Meters 46. 009 46. 004 46. 007 -12. 400 -12. 397 -12. 408 43. 680 43. 658 43. 654 55. 031 55. 027 55. 019 28. 939 28. 947 28. 940 33. 045 33. 063 33. 051 Diff cm Dist Meters 1628 0. 5 0. 2 673 -0. 3 0. 8 1133 2. 2 2. 6 365 0. 4 1. 2 9850 -0. 8 -0. 1 11967 -1. 8 -0. 6 RMS 0. 015 0. 017 0. 015 0. 006 0. 022 0. 020 0. 024 0. 022 0. 023 0. 018 0. 014 0. 020 0. 011 0. 013 0. 009 Solution Type L 1 fixed double L 1 fixed double L 1 fixed double Iono free fixed Iono free fixed
 Adjustment Procedures to Obtain GPS-Derived NAVD’ 88 Orthometric Heights
 Least Squares Adjustments • The adjustment minimizes the effects of random errors • A least squares adjustment computes a single network solution, even with redundant vectors • Least squares will highlight blunders and large errors • It will provide estimates on the precision of the coordinates for the stations
 Errors • All real observations contain errors Random error 4 Two types of errors » Random errors which mean to zero » Systematic errors which do not • Least squares will only give improved results if your errors are predominantly random Systematic error
 Least Squares • Least squares is a mathematical procedure that takes a series of survey measurements 4 which must contain some extra or redundant measurements • and calculates a single set of coordinates for the stations that will satisfy all of the measurements while minimizing the sum of the squares of the misfit (or residuals) Critical value 4 3 2 1 Outliers Critical value v 1 2 3 4 Outliers Least Squares Condition
2 S (estimated errors)2 • If") Standard Error of Unit Weight SEUW = S (residuals)2 S (estimated errors)2 • If the residuals from a least squares adjustment are equal to the errors expected for the order of survey we have performed 4 The standard error of unit weight will have a value of unity • If the residuals are lower than we would expect given our initial estimates of the errors 4 SEUW will be less than 1 • If they are too high 4 SEUW will be greater than 1 • Often used as a rough indication of whether a survey meets specifications
Standard Error of Unit Weight SEUW = S (residuals)2 S (estimated errors)2 • If the residuals from a least squares adjustment are equal to the errors expected for the order of survey we have performed 4 The standard error of unit weight will have a value of unity • If the residuals are lower than we would expect given our initial estimates of the errors 4 SEUW will be less than 1 • If they are too high 4 SEUW will be greater than 1 • Often used as a rough indication of whether a survey meets specifications
 Minimally Constrained Adjustment • Hold the minimum number of control points fixed to allow the least squares process to work 4 One fixed point for GPS 4 2 for triangulation survey without distance measurements • The purpose of this adjustment is to 4 Check the internal consistency of the network 4 Detect blunders or ill-fitting observations How big do you make the bolt holes? 4 Obtain accurate error estimates
 Constrained Adjustment • Hold all control points in the network fixed at values from the NGS database 4 Minimum of 2 for GPS surveys 4 3 for triangulation survey without distance measurements • The purpose of this adjustment is to 4 Reference the network to existing control and develop final coordinates for the new control points that are being established 4 Verify existing control. If any control points are wrong the standard error of unit weight and the residuals will increase compared to the minimally constrained adjustment
 • Minimum Constrained") Adjustment of Primary Network Stations Horizontal Adjustment (Latitude, Longitude, Ellipsoid Heights) • Minimum Constrained 4 4 4 Fix latitude, longitude and ellipsoid height at one station Resolve all blunders and large residuals Determine which Control and known Primary Base Station coordinates should be fixed • Constrained 4 4 [One fixed station] [All suitable stations fixed] Fix latitude, longitude, and ellipsoid heights at Control and known Primary Base Stations Make sure the constraints did not distort the project NOTE - Geoid model NOT applied at this time
Adjustment of Primary Network Stations Horizontal Adjustment (Latitude, Longitude, Ellipsoid Heights) • Minimum Constrained 4 4 4 Fix latitude, longitude and ellipsoid height at one station Resolve all blunders and large residuals Determine which Control and known Primary Base Station coordinates should be fixed • Constrained 4 4 [One fixed station] [All suitable stations fixed] Fix latitude, longitude, and ellipsoid heights at Control and known Primary Base Stations Make sure the constraints did not distort the project NOTE - Geoid model NOT applied at this time
 Adjustment of Primary Base Stations 38° 20’N CORS HARN NAVD’ 88 BM New Station Primary Base Station 19. 0 km 10 CC D 191 m. 6 k 31 m LATITUDE . 7 k 28 MOLA 37° 50’N 122° 35’W m 25. 7 k km . 7 38 38. 3 k m 29. 6 km MART 25. 8 km LAKE LONGITUDE • CORS, Control Points (known Primary Control) horizontal • latitude, longitude, and ellipsoid heights • No NAVD 88 orthometric heights constrained at this time 121° 40’W
 • Minimum Constrained") Adjustment of Local Network Stations Horizontal Adjustment (Latitude, Longitude, Ellipsoid Heights) • Minimum Constrained 4 4 4 Fix latitude, longitude and ellipsoid height at one station Resolve all blunders and large residuals Evaluate coordinates at Control and Primary Base Station » should not be greatly affected by Local Station baselines • Constrained 4 4 [One fixed station] [All suitable stations fixed] Fix latitude, longitude, and ellipsoid heights at Control and Primary Base Stations Make sure the constraints did not distort the project NOTE - Geoid model NOT applied at this time
Adjustment of Local Network Stations Horizontal Adjustment (Latitude, Longitude, Ellipsoid Heights) • Minimum Constrained 4 4 4 Fix latitude, longitude and ellipsoid height at one station Resolve all blunders and large residuals Evaluate coordinates at Control and Primary Base Station » should not be greatly affected by Local Station baselines • Constrained 4 4 [One fixed station] [All suitable stations fixed] Fix latitude, longitude, and ellipsoid heights at Control and Primary Base Stations Make sure the constraints did not distort the project NOTE - Geoid model NOT applied at this time
 Adjustment of Local Network Stations LATITUDE 38° 16’N CORS HARN NAVD’ 88 BM New Station Spacing Station Primary Base Station 8. 2 k m 37° 55’N 122° 20’W LONGITUDE • Existing and newly derived Primary Control horizontal • latitude, longitude, and ellipsoid heights • No NAVD 88 orthometric heights constrained at this time 121° 40’W
 Combined Network Horizontal Adjustment • Perform combined adjustment 4 Control and Primary Base network along with local network 4 Latitude, longitude, and ellipsoid height • Use GEOID model to obtain geoid heights • Make sure combined adjustment did not distort the project
 Combined Horizontal Adjustment 38° 20’N CORS HARN NAVD’ 88 BM New Station LATITUDE Spacing Station Primary Base Station 8. 2 km 37° 50’N 122° 35’W LONGITUDE • CORS, Control Points and existing and new Primary Control horizontal • latitude, longitude, and ellipsoid heights • No NAVD 88 orthometric heights constrained at this time 121° 40’W
 • Minimum Constrained [One") Combined Network Vertical Adjustment 3 -D Vertical Adjustment (Orthometric Heights) • Minimum Constrained [One fixed station] 4 4 Fix latitude, longitude, and orthometric height at one station Resolve all blunders and large residuals Compare orthometric heights from adjustment with published NAVD 88 Determine which NAVD 88 bench marks should be fixed • Constrained 4 4 4 [All suitable orthometric heights fixed] Fix latitude, longitude at one station Fix orthometric heights at all suitable stations Make sure the constraints did not distort the project
Combined Network Vertical Adjustment 3 -D Vertical Adjustment (Orthometric Heights) • Minimum Constrained [One fixed station] 4 4 Fix latitude, longitude, and orthometric height at one station Resolve all blunders and large residuals Compare orthometric heights from adjustment with published NAVD 88 Determine which NAVD 88 bench marks should be fixed • Constrained 4 4 4 [All suitable orthometric heights fixed] Fix latitude, longitude at one station Fix orthometric heights at all suitable stations Make sure the constraints did not distort the project
 Constrained Vertical Adjustment 38° 20’N CORS HARN NAVD’ 88 BM New Station LATITUDE Spacing Station Primary Base Station 8. 2 km 37° 50’N 122° 35’W LONGITUDE • 1 horizontal latitude and longitude • All valid NAVD 88 orthometric heights 121° 40’W
 GPS-Derived Heights from GEOID 03 Separation D E C B A F Hh-N h Hh-N Topography h h h Hh-N h Ellipsoid N N N GEOID 03 = Published NAVD 88 Orthometric Height = New Control N
 Constrained Vertical Adjustment Ellipsoid Height Adjusted to Fit Constrained Orthometric Heights GPS-Derived Orthometric Heights D E C B A F h H Topography h hadj H HGPS h H hadj N N h hadj N N Ellipsoid hadj N Adjusted Ellipsoid GEOID 03 Geoid = Published NAVD 88 Orthometric Height = New Control h hadj N
 Summary • Mistakes and systematic errors must be removed before the adjustment • A least squares adjustment handles random errors and provides a single solution • The Minimally Constrained adjustment checks the internal consistency of the network • The Constrained adjustment checks the existing control and references the network to the datum • The vertical adjustment estimates GPS-derived Orthometric heights
 Analysis of a Height Project This project plan is for measuring the vertical clearance for the Cooper River Bridges, known as the Grace Memorial Bridge and Silias Pearman Bridge. The project consists of 3 different parts as follows: 1. Determine ellipsoid height of the two bridges using three different GPS receivers on the two bridges, one receiver at the pilot house, and a CORS site. 2. Determine the difference between Geoid 96 with NAVD 88 by observing a minimum of four NAVD 88 bench marks including one primary bench mark at the tidal station. 3. Determine the height from the bottom of the bridges to each of the antenna mounts on the bridges using classical and trig leveling.
 Implementation of real-time, using GPS, sensors that will determine the maximum height of a vessel at the lowest point of a bridge. This project plan is for measuring the vertical clearance for the Cooper River Bridges. Vertical clearance is critical for ensuring safe navigation for the Port of Charleston, South Carolina.
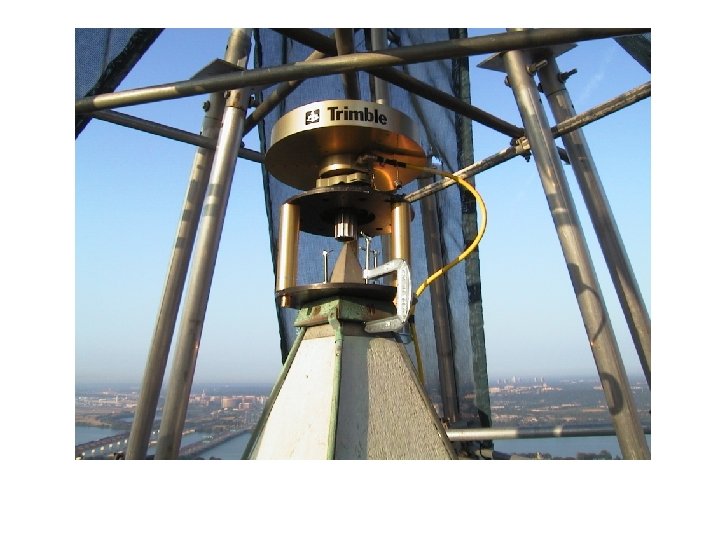
 MOUNTING THE ANTENNAS 1. Determine ellipsoid height of the two bridges using three different GPS receivers on the two bridges, one receiver at the pilot house, and a CORS site.
 GPS OCCUPATION CLASSICAL LEVELING 2. Determine the difference between Geoid 96 with NAVD 88 by observing a minimum of four NAVD 88 bench marks including one primary bench mark at the tidal station.
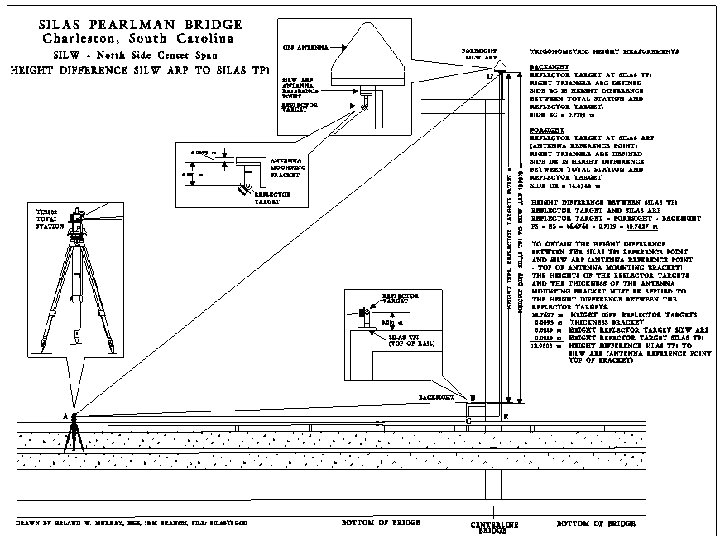
 TRIG-LEVELING 3. Determine the height from the bottom of the bridges to each of the antenna mounts on the bridges using classical and trig leveling.
 Height Project TBM SILE ARP C 69 HOLLINS 10 012 TIDAL 13 (Connection to water surface) NAVD 88 Bench Mark Temporary (Project) CORS (Mounted to each end of bridge) CHA 1 CORS CBPA
 1001 TIDE 036 A 034 B") Repeat Vector Analysis From To Session Length (Hrs) 1001 TIDE 036 A 034 B DX (m) 1 st - Next DY (m) 1 st - Next DZ (m) 1 st - Next Vector Length (m) ppm 2 2 -611. 0438 -0. 0001 -1427. 9448 0. 0092 -2098. 1300 -0. 0018 2610. 469 -0. 004 1. 36 CBPA CHA 1 040 A 24 037 A 24 036 A 24 7737. 4970 -0. 0029 -0. 0043 311. 1515 0. 0051 0. 0088 -1656. 7241 -0. 0020 -0. 0042 7918. 990 -0. 002 -0. 003 0. 28 0. 38 CHA 1 SILE 034 A 24 -7178. 4232 039 A 24 0. 0007 035 A 24 -0. 0006 1466. 8512 0. 0018 0. 0030 4311. 2394 -0. 0076 8501. 070 -0. 005 -0. 003 0. 59 0. 33 CPBA TIDE 036 A 034 B 2 2 -54. 7070 -0. 0001 365. 4396 -0. 0016 546. 3072 -0. 0011 659. 538 -0. 002 2. 71 HOLL SILE 034 B 036 C 2 2 2418. 6237 0. 0028 255. 6238 -0. 0270 -149. 0401 0. 0257 2436. 657 -0. 002 0. 67
Repeat Vector Analysis From To Session Length (Hrs) 1001 TIDE 036 A 034 B DX (m) 1 st - Next DY (m) 1 st - Next DZ (m) 1 st - Next Vector Length (m) ppm 2 2 -611. 0438 -0. 0001 -1427. 9448 0. 0092 -2098. 1300 -0. 0018 2610. 469 -0. 004 1. 36 CBPA CHA 1 040 A 24 037 A 24 036 A 24 7737. 4970 -0. 0029 -0. 0043 311. 1515 0. 0051 0. 0088 -1656. 7241 -0. 0020 -0. 0042 7918. 990 -0. 002 -0. 003 0. 28 0. 38 CHA 1 SILE 034 A 24 -7178. 4232 039 A 24 0. 0007 035 A 24 -0. 0006 1466. 8512 0. 0018 0. 0030 4311. 2394 -0. 0076 8501. 070 -0. 005 -0. 003 0. 59 0. 33 CPBA TIDE 036 A 034 B 2 2 -54. 7070 -0. 0001 365. 4396 -0. 0016 546. 3072 -0. 0011 659. 538 -0. 002 2. 71 HOLL SILE 034 B 036 C 2 2 2418. 6237 0. 0028 255. 6238 -0. 0270 -149. 0401 0. 0257 2436. 657 -0. 002 0. 67
 Free Adjustment Horizontal Positions Compared to Published NAD 83 Positions STATION NAME 10 012 CHARLESTON 1 CORS ARP 866 5530 TIDAL 13 * No Published Ellipsoid Height LAT / LON SHIFT (cm) 32. 8 0. 0 0. 8 ELLIPSOID SHIFT (cm) * 0. 0 1. 8
 Free Adjustment minus NAD 83 Published TBM SILE ARP C 69 HOLLINS 10 012 Residuals plotted to help determine inconsistencies 32. 8 cm Horiz TIDAL 13 0. 8 cm Horiz 1. 8 cm Ellip. Ht. CHA 1 CORS FIXED CBPA NAVD 88 Bench Mark Temporary (Project) CORS
 Sample Data Sheets CJ 0085* CJ 0085 CJ 0085 DESIGNATION - 866 5530 TIDAL 13 _______________________________ NAD 83(1992)- 32 46 5233453(N) 079 55 28. 70969(W) ADJUSTED NAVD 88 2. 219 (meters) 7. 28 (feet) ADJUSTED _______________________________ ELLIP HEIGHT-30. 96 (meters) GPS OBS HORZ ORDER VERT ORDER - FIRST CLASS I *************************************** CJ 0578 DESIGNATION - 10 012 CJ 0578 _______________________________ CJ 0578* NAD 83(1986)- 32 47 31. 79561(N) 079 54 20. 99377(W) ADJUSTED CJ 0578* NAVD 88 5. 336 (meters) 17. 51 (feet) ADJUSTED CJ 0578 _______________________________ CJ 0578 HORZ ORDER - FIRST CJ 0578 VERT ORDER - FIRST CLASS II NOTE - Different adjustments for the positions
![Adjusted Constrained Horizontal Compared to Free Horizontal Positions [Station 10 012 Not Fixed] STATION](https://present5.com/presentation/82e8d3a071372623e5bdd42c2e570d15/image-84.jpg "Adjusted Constrained Horizontal Compared to Free Horizontal Positions [Station 10 012 Not Fixed] STATION") Adjusted Constrained Horizontal Compared to Free Horizontal Positions [Station 10 012 Not Fixed] STATION NAME C 69 HOLLINGS 866 5530 TIDAL 13 10 012 TBM SILE ARP CHARLESTON POLIT HOUSE ARP TBM SILW ARP TBM GRAC ARP CHARLESTON 1 CORS ARP TBM SALAIS BOTTOM OF BRIDGE LAT / LON SHIFT (cm) 0. 4 0. 8 0. 4 0. 3 0. 2 0. 5 • Minimum shifts between free and constrained adjustments • Constraints did not adversely affect adjustment ELLIPSOID SHIFT (cm) -1. 4 -1. 3 -1. 8 -1. 3 -0. 8 -0. 9 -0. 6 -0. 7 -0. 1 -1. 7
Adjusted Constrained Horizontal Compared to Free Horizontal Positions [Station 10 012 Not Fixed] STATION NAME C 69 HOLLINGS 866 5530 TIDAL 13 10 012 TBM SILE ARP CHARLESTON POLIT HOUSE ARP TBM SILW ARP TBM GRAC ARP CHARLESTON 1 CORS ARP TBM SALAIS BOTTOM OF BRIDGE LAT / LON SHIFT (cm) 0. 4 0. 8 0. 4 0. 3 0. 2 0. 5 • Minimum shifts between free and constrained adjustments • Constraints did not adversely affect adjustment ELLIPSOID SHIFT (cm) -1. 4 -1. 3 -1. 8 -1. 3 -0. 8 -0. 9 -0. 6 -0. 7 -0. 1 -1. 7
![Adjusted Constrained Horizontal Compared to Free Horizontal Positions [Station 10 012 Fixed] STATION NAME](https://present5.com/presentation/82e8d3a071372623e5bdd42c2e570d15/image-85.jpg "Adjusted Constrained Horizontal Compared to Free Horizontal Positions [Station 10 012 Fixed] STATION NAME") Adjusted Constrained Horizontal Compared to Free Horizontal Positions [Station 10 012 Fixed] STATION NAME C 69 HOLLINGS 866 5530 TIDAL 13 10 012 TBM SILE ARP CHARLESTON POLIT HOUSE ARP TBM SILW ARP TBM GRAC ARP CHARLESTON 1 CORS ARP TBM SALAIS BOTTOM OF BRIDGE LAT / LON SHIFT (cm) 5. 8 6. 0 5. 3 32. 8 6. 3 5. 2 5. 9 0. 0 5. 2 • A bad constraint in position also affects the ellipsoid heights ELLIPSOID SHIFT (cm) -2. 3 -2. 9 -1. 8 -9. 0 -2. 9 -1. 6 -2. 0 -2. 1 -0. 0 -1. 7
Adjusted Constrained Horizontal Compared to Free Horizontal Positions [Station 10 012 Fixed] STATION NAME C 69 HOLLINGS 866 5530 TIDAL 13 10 012 TBM SILE ARP CHARLESTON POLIT HOUSE ARP TBM SILW ARP TBM GRAC ARP CHARLESTON 1 CORS ARP TBM SALAIS BOTTOM OF BRIDGE LAT / LON SHIFT (cm) 5. 8 6. 0 5. 3 32. 8 6. 3 5. 2 5. 9 0. 0 5. 2 • A bad constraint in position also affects the ellipsoid heights ELLIPSOID SHIFT (cm) -2. 3 -2. 9 -1. 8 -9. 0 -2. 9 -1. 6 -2. 0 -2. 1 -0. 0 -1. 7
 Free Vertical Adjustment Compared to Published NAVD 88 Elevations STATION NAME C 69 HOLLINGS 866 5530 TIDAL 13 10 012 TBM SILE ARP TBM SILW ARP LAT / LON SHIFT (cm) 0. 1 0. 2 0. 0 0. 8 0. 3 ORTHOMETRIC SHIFT (cm) 0. 6 0. 1 0. 0 -8. 2 0. 9 0. 8 • GPS-derived orthometric height does not agree with published orthometric height
 Free Vertical Adjustment minus NAVD 88 Published C 69 TBM SILE 0. 9 cm ARP 0. 6 cm HOLLINS 0. 1 cm 10 012 Residuals plotted to help determine trends or inconsistencies -8. 2 cm TIDAL 13 FIXED CHA 1 CORS NAVD 88 Bench Mark Temporary (Project) CORS CBPA
![Adjusted Constrained Vertical Compared to Free Vertical Elevations [Station 10 012 Not Fixed] STATION](https://present5.com/presentation/82e8d3a071372623e5bdd42c2e570d15/image-88.jpg "Adjusted Constrained Vertical Compared to Free Vertical Elevations [Station 10 012 Not Fixed] STATION") Adjusted Constrained Vertical Compared to Free Vertical Elevations [Station 10 012 Not Fixed] STATION NAME C 69 HOLLINGS 866 5530 TIDAL 13 10 012 TBM SILE ARP CHARLESTON POLIT HOUSE ARP TBM SILW ARP TBM GRAC ARP CHARLESTON 1 CORS ARP TBM SALAIS BOTTOM OF BRIDGE LAT / LON SHIFT (cm) 0. 1 0. 0 0. 0 • Minimum shifts between free and constrained adjustments • Constraints did not adversely affect adjustment ORTHOMETRIC SHIFT (cm) -0. 6 -0. 1 0. 0 -0. 4 -0. 7 -0. 4 -0. 8 -0. 6 -0. 0
Adjusted Constrained Vertical Compared to Free Vertical Elevations [Station 10 012 Not Fixed] STATION NAME C 69 HOLLINGS 866 5530 TIDAL 13 10 012 TBM SILE ARP CHARLESTON POLIT HOUSE ARP TBM SILW ARP TBM GRAC ARP CHARLESTON 1 CORS ARP TBM SALAIS BOTTOM OF BRIDGE LAT / LON SHIFT (cm) 0. 1 0. 0 0. 0 • Minimum shifts between free and constrained adjustments • Constraints did not adversely affect adjustment ORTHOMETRIC SHIFT (cm) -0. 6 -0. 1 0. 0 -0. 4 -0. 7 -0. 4 -0. 8 -0. 6 -0. 0
![Adjusted Constrained Vertical Compared to Free Vertical Elevations [Station 10 012 Fixed] STATION NAME](https://present5.com/presentation/82e8d3a071372623e5bdd42c2e570d15/image-89.jpg "Adjusted Constrained Vertical Compared to Free Vertical Elevations [Station 10 012 Fixed] STATION NAME") Adjusted Constrained Vertical Compared to Free Vertical Elevations [Station 10 012 Fixed] STATION NAME C 69 HOLLINGS 866 5530 TIDAL 13 10 012 TBM SILE ARP CHARLESTON POLIT HOUSE ARP TBM SILW ARP TBM GRAC ARP CHARLESTON 1 CORS ARP TBM SALAIS BOTTOM OF BRIDGE LAT / LON SHIFT (cm) ORTHOMETRIC SHIFT (cm) 0. 1 0. 0 0. 0 • A bad constraint in orthometric height affects all orthometric heights -0. 6 -0. 1 0. 0 -8. 2 -0. 7 -2. 4 -0. 8 -0. 6 -4. 2 -1. 2
Adjusted Constrained Vertical Compared to Free Vertical Elevations [Station 10 012 Fixed] STATION NAME C 69 HOLLINGS 866 5530 TIDAL 13 10 012 TBM SILE ARP CHARLESTON POLIT HOUSE ARP TBM SILW ARP TBM GRAC ARP CHARLESTON 1 CORS ARP TBM SALAIS BOTTOM OF BRIDGE LAT / LON SHIFT (cm) ORTHOMETRIC SHIFT (cm) 0. 1 0. 0 0. 0 • A bad constraint in orthometric height affects all orthometric heights -0. 6 -0. 1 0. 0 -8. 2 -0. 7 -2. 4 -0. 8 -0. 6 -4. 2 -1. 2
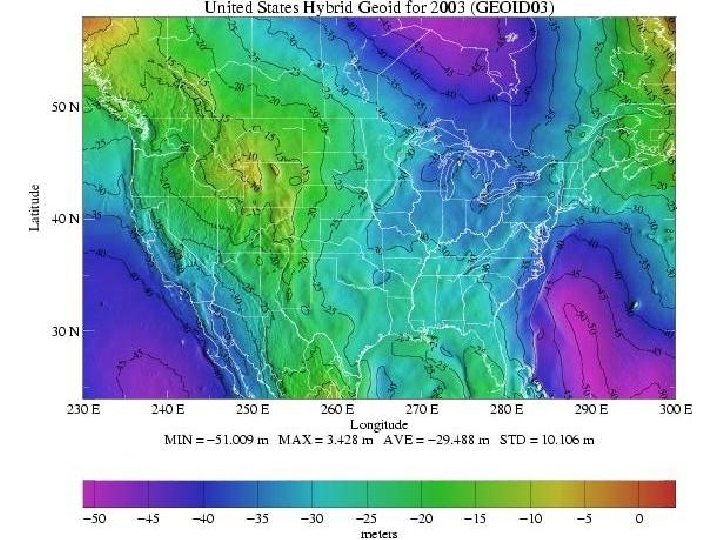
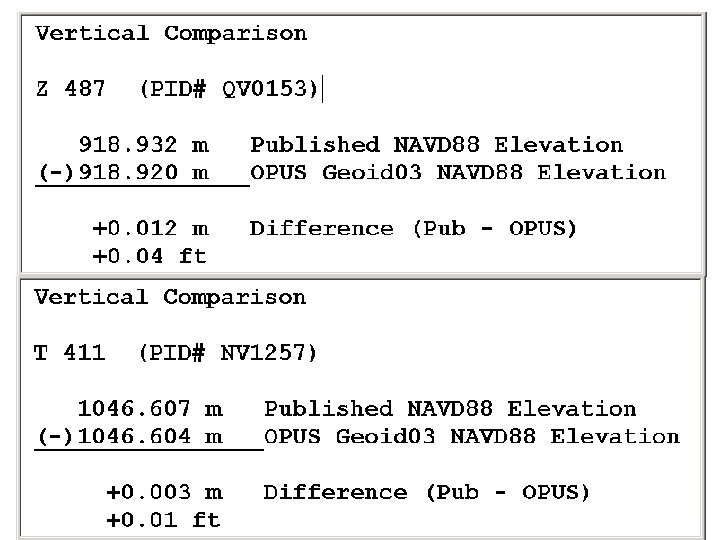
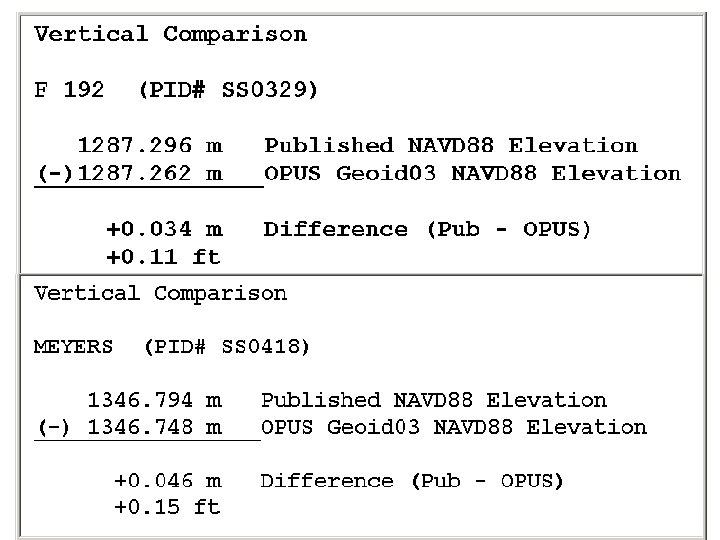
 NGS Data Sheet GEOID 03 H= h -N 102. 431 = 69. 78 - (-32. 60) 102. 431 102. 38 GEOID 96 = 0. 17 m GEOID 99 = 0. 11 m GEOID 03 = 0. 05 m
 GEOID 03 San Francisco Bay Demonstration") NAVD ‘ 88 Relative to (h - N) GEOID 03 San Francisco Bay Demonstration Project
NAVD ‘ 88 Relative to (h - N) GEOID 03 San Francisco Bay Demonstration Project
 Comparisons with Published Station") San Francisco Bay Demonstration Project H=h-N R 1393 (-1. 3) Comparisons with Published Station Heights (Centimeters) GPS Site RV 223 (+0. 4) 941 4819 TIDAL 32 (+0. 4) S 1320 (+4. 5) U 1320 (+3. 5) 0 5 10 KM 941 4750 TIDAL 7 (-2. 4) M 554 (-0. 6) M 148 (+1. 1) L 1241 (+3. 6) N 1197 (+2. 9) H = Orthometric Height h = Ellipsoid Height N = Geoid Height GEOID 03
San Francisco Bay Demonstration Project H=h-N R 1393 (-1. 3) Comparisons with Published Station Heights (Centimeters) GPS Site RV 223 (+0. 4) 941 4819 TIDAL 32 (+0. 4) S 1320 (+4. 5) U 1320 (+3. 5) 0 5 10 KM 941 4750 TIDAL 7 (-2. 4) M 554 (-0. 6) M 148 (+1. 1) L 1241 (+3. 6) N 1197 (+2. 9) H = Orthometric Height h = Ellipsoid Height N = Geoid Height GEOID 03
 “Real World”
 “Mapping World”
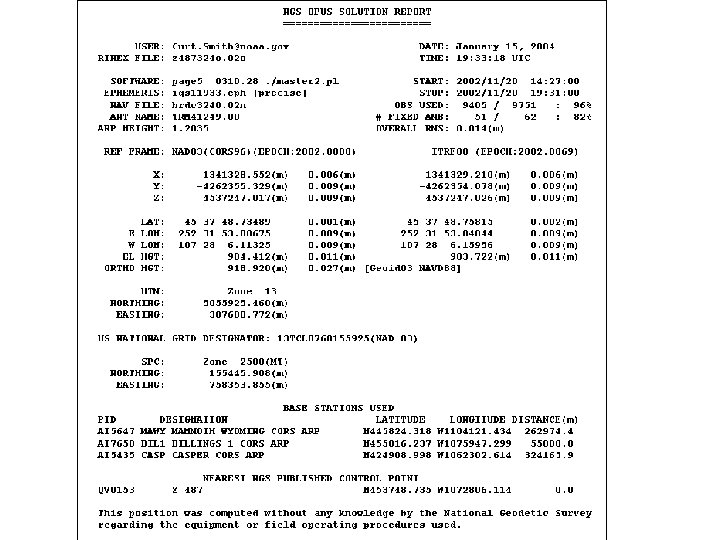
 8002 8002 8002 The Opus solution for your submitted RINEX file appears to be quite close to an NGS published control point. This suggests that you may have set your GPS receiver up over an NGS control point. Furthermore, our files indicate that this control point has not been recovered in the last five years. If you did indeed recover an NGS control point, we would appreciate receiving this information through our web based Mark Recovery Form at http: //www. ngs. noaa. gov/products_services. shtml#Mark. Recovery. Form.
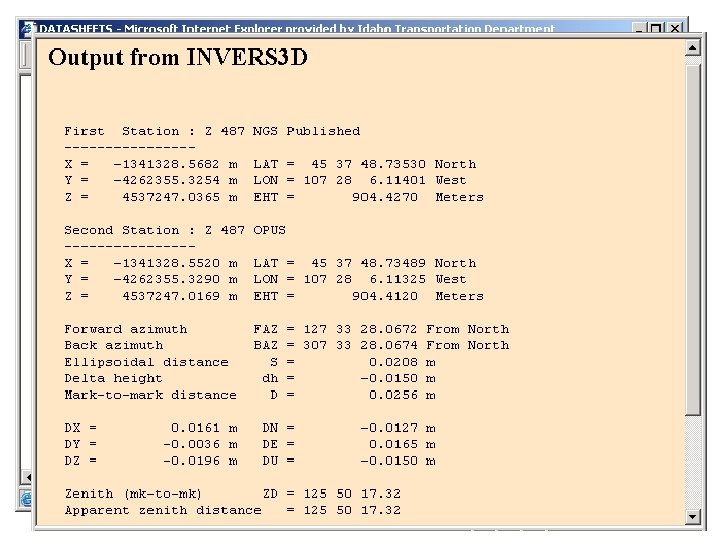
 First station : SURVEYOR 290 Second station : SURVEYOR 284 Delta height = -. 0220 Ellipsoidal distance =. 0070 Mark to mark distance =. 0231 DX =. 0122 DN = DY =. 0163 DE = DZ = -. 0109 DU = OPUS Processing Comparisons. 0068. 0015 -. 0220 Day 277 Day 278 Day 284 Day 290 First station : SURVEYOR 290 Second station : SURVEYOR 278 Delta height = -. 0150 Ellipsoidal distance =. 0089 Mark to mark distance =. 0174 DX =. 0114 DN = DY =. 0122 DE = DZ = -. 0048 DU = . 0083. 0030 -. 0150 First station : SURVEYOR 290 Second station : SURVEYOR 277 Delta height = -. 0080 Ellipsoidal distance =. 0083 Mark to mark distance =. 0115 DX =. 0079 DN = DY =. 0084 DE = DZ = -. 0001 DU = . 0080. 0022 -. 0080 2 hr 7 min 9 hr 23 min 7 hr 14 min 2 hr 7 min
 OPUS - Multiple CORS Providing Position to Base Receiver = CORS = Base Receiver = Rover Receiver
 P +P 2 P P CORS 1 Two 2+ Hour Sessions Two Receivers N +N 2 N N P Published Position - P OPUS Mean Position How well OPUS fits Published How well OPUS 1 fits OPUS 2 O 1+2 OPUS Mean Position P-N + P-N 2 P-N How well OPUS 1 fits OPUS 2 O 1+2 OPUS Mean Position P N P = Published Point N = New Point How well Process 1 fits Process 2 Process 1+2 Process Mean Position P-N Process Mean Position - N OPUS Mean Position How well Process fits OPUS CORS 3 CORS 2 FINAL POSITION N Process Mean Position + N OPUS Mean Position 2 N Process+OPUS Position N Final Position