17c7497d283a59649bb413d5a45ec36e.ppt
- Количество слайдов: 64


“Civilization exists by geological consent. . . subject to change without notice!” Will Durant, 1926

San Francisco Bay Through Time Jere H. Lipps, UCMP Berkeley

San Francisco Bay Largest estuary west Americas. 300+ sq mi Ave. depth=18 ft Drains much of California. 7 million people live in area. Large industrial base.

San Francisco Bay & Delta A very shallow, ephemeral estuary

Drainage to SF Bay & Delta ~152, 000 km 2. 40% of California. Mean annual flow = 600 m 3/sec. Sediment = 4. 2 X 10⁶ tons/year
 • • 13, 000: Arrival by sea and/or land 8,")
Human Impacts (years ago) • • 13, 000: Arrival by sea and/or land 8, 000: Began harvesting the new bay 2 -3000: Built shell mounds 250: Europeans arrived; Native Americans declined 160: California won from Mexico, Gold Rush 135: Bay filling began 100: Industrialization and development began in earnest > 100: Industrial global warming

Subject to: Sea level changes. Earthquakes. Devastating fires. Population increase. Pollution. Invasions.

History Matters! Conservation, Ecology and Evolutionary Biology as Historical Sciences

What We Can Control • Radioactivity • Destruction of Habitats • Chemical Pollution • Genetic Depletion • Climate Change

What We Cannot Control • Plate Tectonics • Sedimentation* • Global Climate Change* • Glacial Melting • Sea Level Changes • Natural Changes in Geology & Biology*

What’s the Problem? Nature Us

California: Always Changing From Hall 2005

Climate: Always Changing High Latitude Temperature Changes Inferred from Deep Sea Isotopic Records Zachos et al. 2001 Temp C: 0 4 8 12

How Do We Know? Oxygen isotopes of ice or microfossils • 16 O, 17 O • • • and 18 O 8 protons 8, 9 and 10 neutrons = different masses Each behaves differently Warmer water = more 18 O More ice = more 18 O d 18 O

Earth to Sun Relationship: Orbit, Tilt, Equinoxes Interglacials Glacials

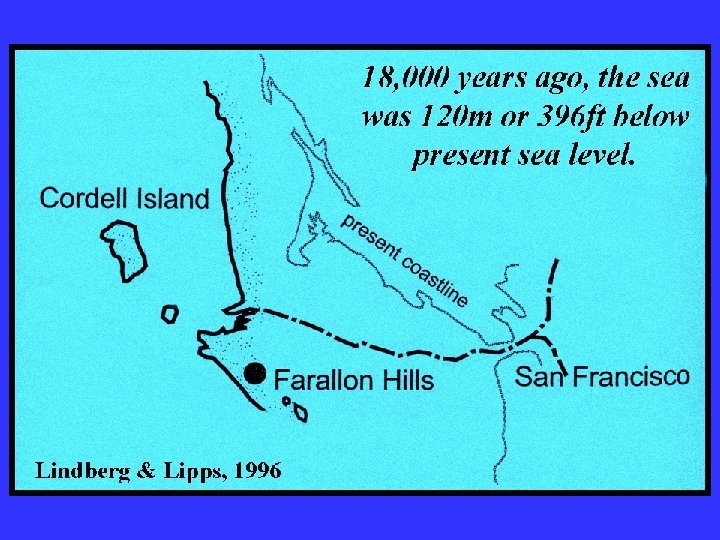
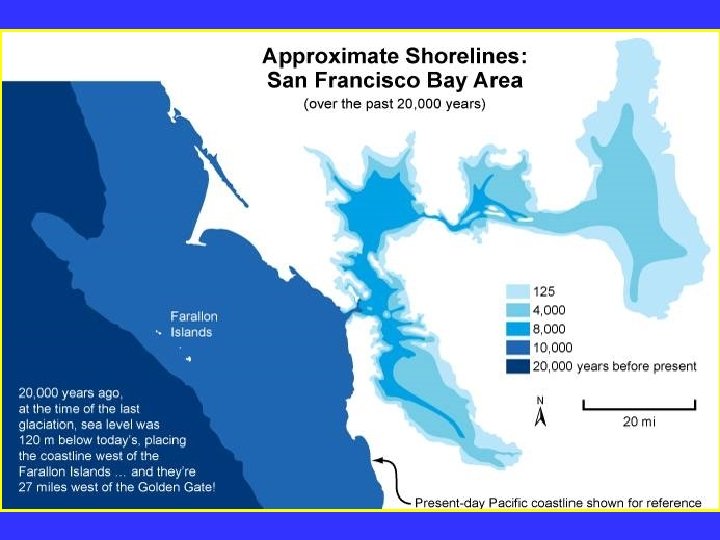
Climate/Sea Level Curve for the Past 500, 000 Years SF Bay = 7 X p. s. l. No SF Bay 10 100 200 300 400 years X 1000 500

Mostly, SF Bay was a river valley

Glacial Earth

What is Global Warming? • Certain gases in atmosphere trap heat, like in a Greenhouse. • CO 2, CO, CH 4, NO, & others. • Contributed by volcanoes, some other sources, and now human activities. • Nature can’t remove it fast enough. • Atmosphere & ocean linked. Both warm, not necessarily smoothly. • Venus & Mars are Greenhouse planets.

Greenhouse Gases • • • Water Vapor Carbon dioxide Methane Chloroflourocarbons Ozone Nitrous oxide H 2 O CO 2 CH 4 (CFCs) O 3 NO

The Carbon Cycle • An atmosphere - terrestrial biosphere loop. • A terrestrial biosphere- geospherehydrosphere loop. • An atmosphere-geospherehydrosphere loop.
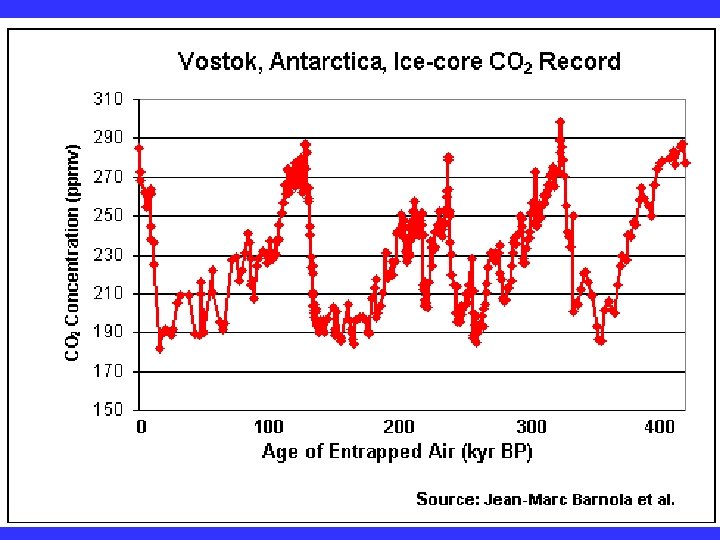

Temperature & CO 2 Variations Last 420, 000 years

Temperature & CO 2 Variations Last 18, 000 years

Temperature & CO 2 Variations Last 50 years

Greenhouse Changes

Natural & Human Climate Change

Courtesy of Ken Towe
 2) 3) 4) 5) 6) 7) 8) 9) Increasing CO 2")
Greenhouse Effects 1) 2) 3) 4) 5) 6) 7) 8) 9) Increasing CO 2 Increasing H 2 O: Flooding Increasing El Nino events Increasing temperature: 8 -12 OC Sea level rising: Up to 8+ m Increased hurricane & tornado occurrence/intensity Redistribution of crops & species Increasing diseases Major changes in oceans & biotas

Patagonia: Always Changing Glacial Retreat 80 m since 2000; more to come in next 30 years

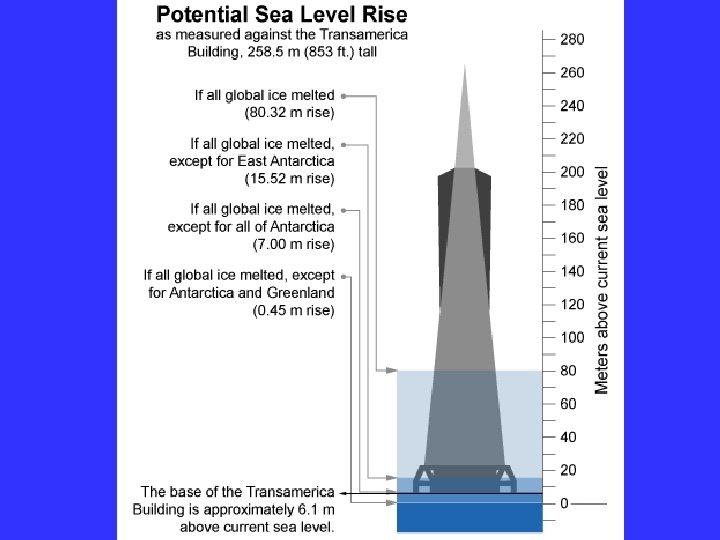
San Francisco: Sea Level Rise

Potential Sea Level Rise East Antarctica 26, 039, 200 km 3 West Antarctica 3, 262, 000 km 3 Antarctic Peninsula 227, 100 km 3 Greenland 2, 620, 000 km 3 All other ice 180, 000 km 3 TOTALS: 64. 80 m 8. 06 m. 46 m 6. 55 m. 45 m 32, 328, 000 km 3 80. 32 m

When? 1000’s of years: Natural variations. 100’s of years: Human effects. 10’s of years: Sudden release of CH 4 clathrates, Catastrophic collapse of ice sheets.

and inferred for the future. ~8 m sea level rise.

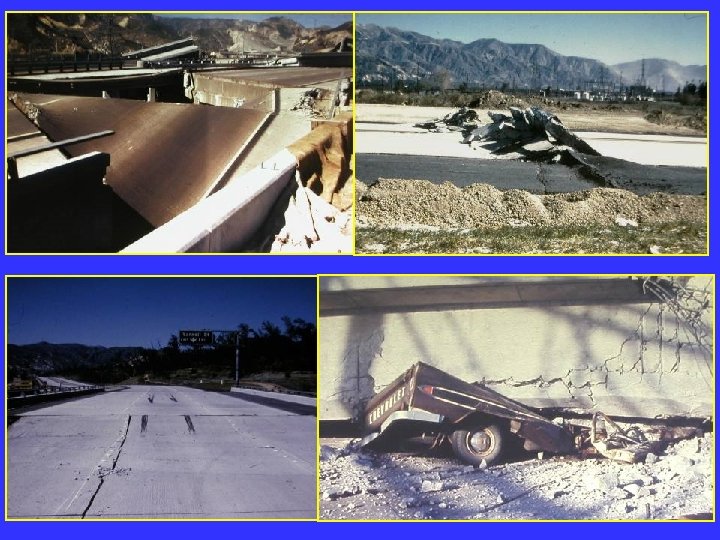
Road Damage: 1. 5 m Rise Pacific Institute

Fire Hazard Will Increase

East Bay Fires History • Fire is a natural part of the East Bay environment • Major fires have occurred every 10 to 15 years in the East Bay hills • • • 1923: 130 acres , 584 homes 1931: 1, 800 acres, 5 homes 1933: 1, 000 acres, 5 homes 1937: 700 acres 1946: 1, 000 acres 1960: 1, 200 acres, 2 homes 1970: 204 acres , 37 homes 1980: 2 acres, 5 homes 1990: 200 acres 1991: 1, 700 acres, 3, 400 homes, 25 died • 1995: 3 homes • 2002: 5 acres

The 1923 Berkeley Fire Destroyed 584 Homes in 2 HOURS

Oakland Hills Fire from space NASA

Losses 1991 Oakland Hills Fire • • • 25 Dead 150 Injured 3, 471 Homes Lost 1, 520 Acres Burned Largest Fire Loss in the history of the nation up to that time - $2. 2 billion • Economic Loss: 15 -20% business failure in nearby retail, citywide unknown

1910 2003 Tilden Park Source: Jean Quan

Living in the Hills Each arrow = house Source: Jean Quan

San Andreas Fault System >60% chance of a 6. 7 quake in next 30 years in Bay Area

Ten Greatest Quakes

A Few California Quakes • • • San Francisco Calaveras fault Imperial Valley Kern County San Fernando Coalinga Loma Prieta Northridge Parkfield 1906 1911 1940 1952 1971 1983 1989 1994 2004 8. 25 6. 5 7. 1 7. 7 6. 5 7. 1 6. 7 7. 0

Oak Knoll Hospital 1971

Bay Area Faults

Probability of Earthquakes > 6. 7 2003 -2032 = 62% USGS http: //quake. usgs. gov/

Rock Type Makes a Difference

Liquification: East Bay

San Andra San Andreas Fault 7. 2

Hayward Fault 6. 9

University of California, Berkeley UCB

Memorial Stadium

You Need an Earthquake Bucket!!

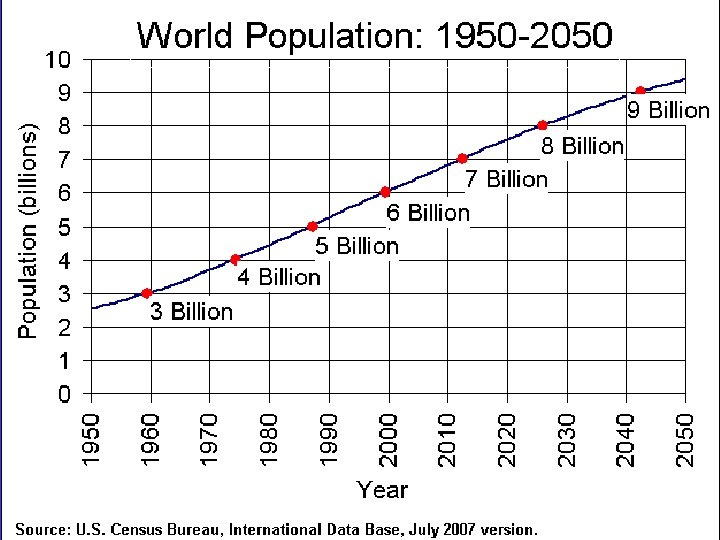
The Real Problem A World Full of Humans 1960 = 3, 000, 000 2007 = 6, 650, 189, 946 2040 = 8, 900, 000 This in your lifetime!

In Your Kids’ Lifetime • • World population will increase 3 billion US population will increase 50 million Petroleum will be used up Sea level will rise 1 -8+m Climate will warm several degrees Oceans will acidify Fishing will decrease Biodiversity & abundance will decrease enormously ONLY YOU CAN HELP YOUR CHILDREN, GRANDCHILDREN & YOURSELF

What can you do for your Bay Area? NASA 1. 2. 3. 4. 5. ? ? ?

Thanks!! Jere H. Lipps jlipps@berkeley. edu
17c7497d283a59649bb413d5a45ec36e.ppt