

060ce0b313901d72d7250e03d2daa1f9.ppt
- Количество слайдов: 186
 CII: An Introduction CMAA Owners’ Forum May 2, 2010 Atlanta, Georgia Manuel A. Garcia, P. E. Associate Director Construction Industry Institute
 Today’s Agenda • Introduce CII • CII-CMAA Alliance • Present High Owner Relevance CII Practices – – – – Zero Accidents Partnering Team Building Alignment Front End Planning For Start Up Project Delivery & Contract Strategies 2
 What is CII? • A consortium of leading owners, contractors & suppliers, and academia working to improve the constructed project and the capital investment process. • A research unit of the Cockrell School of Engineering at The University of Texas at Austin
 CII History • Established as a recommendation from The Business Roundtable CICE Project to address: – construction research – fragmentation of the industry • Founded in 1983 by 28 companies; Now 108 members • First to bring research to the engineeringconstruction world • First industry-government-academic research collaboration for the constructed project
 Purpose To measurably improve the delivery of capital facilities. Mission • Enhance business effectiveness and sustainability of the capital facility life cycle • Expand the global competitive advantage of its members through: – active involvement & participation – effective use of CII research findings, including CII Best Practices.
 Owner Members Abbott Air Liquide Air Products and Chemicals Alcoa Ameren American Transmission Co. Anheuser-Busch In. Bev Aramco Services Company Archer Daniels Midland Barrick Gold BP America Bristol-Myers Squibb Cargill Chevron CITGO Petroleum Codelco-Chile Conoco. Phillips Constellation Energy DFW International Airport Dow Chemical Du. Pont Eastman Chemical Eli Lilly Exxon. Mobil Glaxo. Smith. Kline Hovensa International Paper Kaiser Permanente Marathon Oil NASA Naval Facilities Engineering Command NOVA Chemicals Occidental Petroleum Ontario Power Generation Petrobras Praxair Procter & Gamble Progress Energy Saudi Basic Industries Corp (SABIC) Sasol Technology Shell Global Solutions US Smithsonian Institution Southern Company Sunoco Tennessee Valley Authority Trans Canada Corp. U. S. Architect of the Capitol U. S. Army Corps of Engineers U. S. Dept. of Commerce/ NIST/Building & Fire Research Lab U. S. Dept. of Energy U. S. Dept. of Health & Human Services U. S. Dept. of State U. S. General Services Administration
 Contractor Members Aker Solutions Alstom Power AMEC Atkins Faithful + Gould AZCO Baker Concrete Construction Barton Malow Bateman Engineering Bechtel Group Bentley Systems BIS Frucon Industrial Svcs. Black & Veatch Bowen Engineering Burns & Mc. Donnell CB&I CCC Group CDI Engineering Solutions CH 2 M HILL CSA Group Day & Zimmerman dck worldwide Dresser-Rand Company Emerson Process Mgt. e Project Management Fluor Foster Wheeler USA Grinaker-LTA/E+PC Gross Mechanical GS E & C Hargrove and Associates Hilti Jacobs JMJ Associates KBR Lauren E & Constructors M. A. Mortenson Mc. Dermott International Mustang Omniware Oracle USA Parsons Pathfinder Pegasus Global Holdings R. J. Mycka S&B E and C The Shaw Group Siemens Energy SNC-Lavalin Technip URS Corporation Victaulic Company Walbridge The Weitz Company Wanzek Construction Worley. Parsons Zachry Zurich
 CII Chairmen, 2005– 2010 David Mc. Kinney John Dalton Vice President of Nuclear Construction – Southern Company Executive Vice President – Mustang Emerson T. Johns Dr. J. J. Suarez Former Finance Director, Engineering, Facilities, and Corporate Remediation – Du. Pont Company President & Chief Executive Officer – CSA Group Dennis Schroeder G. Wayne Burchette President, Engineering – BE&K Engineering Company Former Director of Worldwide Engineering and Construction – Eastman Chemical Company
 CII Organization Board of Advisors Executive Committee Knowledge Creation Research Committee Academic Committee Breakthrough Strategy Committee Strategic Planning Committee Knowledge Dissemination Implementation Strategy Committee Professional Development Committee Knowledge Management Knowledge Assessment Knowledge Management Committee Benchmarking & Metrics Committee Special Functions Branding Implementation Committee Conference Committee Research Teams Product Review Board Industry-Sector Benchmarking Finance Committee Membership Committee Nominating Committee
 Universities involved 1983 -2009 University of Alabama Arizona State University Auburn University Bucknell University Carnegie Mellon University of Cincinnati Clemson University of Colorado-Boulder Colorado State University of California-Berkeley East Carolina University of Florida Georgia Institute of Technology University of Houston University of Illinois Iowa State University of Kansas University of Kentucky Lehigh University of Maryland University of Michigan Mississippi State University of New Mexico North Carolina State University North Dakota State University Oklahoma State University Oregon State University The Pennsylvania State University of Pittsburgh Purdue University Polytechnic University San Diego State University San Jose State University Stanford University State University of New York-Albany Vanderbilt University Virginia Polytechnic Institute and State University Texas A&M University The University of Texas at Austin (CII headquarters & founding university) University of Washington University of Waterloo University of Wisconsin-Madison Worcester Polytechnic Institute
 Industry Leaders Support the CII Mission John Berra Alan Boeckmann Robert J. Giorgio Steve Hanks President – Emerson Process Chief Executive Officer – Fluor President – CDI Engineering Solutions Former President – URS– Washington Division Mike Illane Theodore C. Kennedy Lee A. Mc. Intire H. Ross Perot President and General Manager – Project Resources Company (Chevron) Founder – BE&K President and Chief Operating Officer – CH 2 M HILL Chairman Emeritus – Perot Systems Jan Tuchman Dr. J. J. Suarez Vincent R. Volpe, Jr. David Wyss Editor – Engineering News-Record President & Chief Executive Officer – CSA Group President and Chief Executive Officer – Dresser-Rand Chief Economist – Standard & Poor's
 CII Knowledge Processes Management, organization, and assessment of the 500 -plus CII documents and publications. Assessment of the impact of CII practices through benchmarking. Knowledge Creation Research to define best practices, breakthroughs, & industry norms. Dissemination through publications, implementation guides, educational materials, workshops, and conferences. Knowledge Management Knowledge Assessment Knowledge Dissemination
 construction-institute. org 13
 Project Planning Phase Design/ Construction/ Startup Phases •") CII Practices (CII Best Practice Candidates) Project Planning Phase Design/ Construction/ Startup Phases • Attract and Maintain Skilled Workers • Craft Productivity Practices • Automated Identification • Design for Maintainability • Construction Input Assessment • Design for Safety • Effective Use of Global Engineering Workforce • Engineering Productivity Measurement • Environmental Remediation Management • Piping Design • Equitable Risk Allocation • International Project Risk Assessment Project Life • Cost & Schedule Control • Employee Incentives • Fully Int. & Auto. Project Processes (FIAPP) • Project Delivery and Contract Strategies • Information Integration • Project Security • Management of Education & Training • Project Teams • Managing Workers’ Compensation • Technology Implementation • Project Health Assessment • Value Management • Small Projects Execution • Leader Selection • Modularization/Preassembly • Organizational Work Structure • Work Process Simulation
CII Practices (CII Best Practice Candidates) Project Planning Phase Design/ Construction/ Startup Phases • Attract and Maintain Skilled Workers • Craft Productivity Practices • Automated Identification • Design for Maintainability • Construction Input Assessment • Design for Safety • Effective Use of Global Engineering Workforce • Engineering Productivity Measurement • Environmental Remediation Management • Piping Design • Equitable Risk Allocation • International Project Risk Assessment Project Life • Cost & Schedule Control • Employee Incentives • Fully Int. & Auto. Project Processes (FIAPP) • Project Delivery and Contract Strategies • Information Integration • Project Security • Management of Education & Training • Project Teams • Managing Workers’ Compensation • Technology Implementation • Project Health Assessment • Value Management • Small Projects Execution • Leader Selection • Modularization/Preassembly • Organizational Work Structure • Work Process Simulation
 CII Best Practices Project Planning Phase • Alignment Construction/Startup Phase • Planning for Startup • Partnering • Front End Planning • Team Building • Zero Accidents Techniques Design Phase • Constructability • Materials Management Project Life Cycle • Benchmarking & Metrics • Change Management • Disputes Prevention • Implementation of CII Research • Lessons Learned • Quality Management
 Use of Best Practices Begins with Strong Implementation Culture Ends with Improved Performance 16
") CII Grouping of 10 Practices/ Best Practices 3 Components Planning Execution Organization Behavior (OB) 10 Practices FEP Alignment During FEP Planning for Startup Constructability Project risk Assessment (PRA) Change Mgmt. Partnering Project Delivery and Contract Strategies (PDCS) Team Building Zero Accident Techniques VBP Survey Start of Section 4. 3
CII Grouping of 10 Practices/ Best Practices 3 Components Planning Execution Organization Behavior (OB) 10 Practices FEP Alignment During FEP Planning for Startup Constructability Project risk Assessment (PRA) Change Mgmt. Partnering Project Delivery and Contract Strategies (PDCS) Team Building Zero Accident Techniques VBP Survey Start of Section 4. 3
 The Owner’s experience…
 Schedule Growth Impact of Best Practice Use on Schedule Performance- Owners 20% 15% 10% 5% 0% -5% -10% 11. 5% High Use = 9. 7 % Schedule Improvement 1. 8% High Low (N=27) (N=14) Best Practice Index Mean N SEM High 1. 8% 27 3. 3% Low 11. 5% 14 4. 1% VBP Survey Figure 14 P Sig. α=0. 1 0. 082 Y
 Cost Growth Impact of Best Practice Use on Cost Performance- Owners 20% 15% 10% 5% 0% -5% -10% 8. 6% High Use = 10. 9 % Cost Improvement -2. 3% High (N=29) Low (N=25) Best Practice Index Mean High Low VBP Survey Figure 13 N SEM P Sig. α=0. 1 -2. 3% 8. 6% 29 25 2. 2% 2. 7% 0. 030 Y
 Impact of Planning Best Practice Use on Cost Performance- Owners Cost Growth 20% 15% 10% 5% 0% -5% -10% • Front End Planning • Alignment for FEP • Planning for Startup 6. 3% High (N=29) Low (N=24) Planning Best Practice Index Mean N SEM High -1. 2% 29 3. 0% Low 6. 3% 24 2. 9% VBP Survey Figure 15 High Use = 7. 5 % Cost Improvement -1. 2% P Sig. α=0. 1 0. 080 Y
 Owners… • If you are not implementing these CII Best Practices: – – – Front End Planning Alignment for Front End Planning Partnering Change Management Planning for Startup Your projects are costing you 20% more than they should 22
 The Contractor’s Experience…
 Cost Growth Impact of Execution Best Practice Use on Cost Performance- Contractors 20% 15% 10% 5% 0% -5% -10% -3. 0% • Constructability • Project Risk Assessment • Change Management High (N=12) Low (N=13) Execution Best Practice Index Mean N SEM High -3. 0% 12 2. 7% Low 9. 2% 13 3. 4% VBP Survey Figure 16 9. 2% High Use = 12. 2 % Cost Improvement P Sig. α=0. 1 0. 011 Y
 Leadership at the Top to “Bottom Line” Impact Company Culture Practice Implementation Performance Result$!
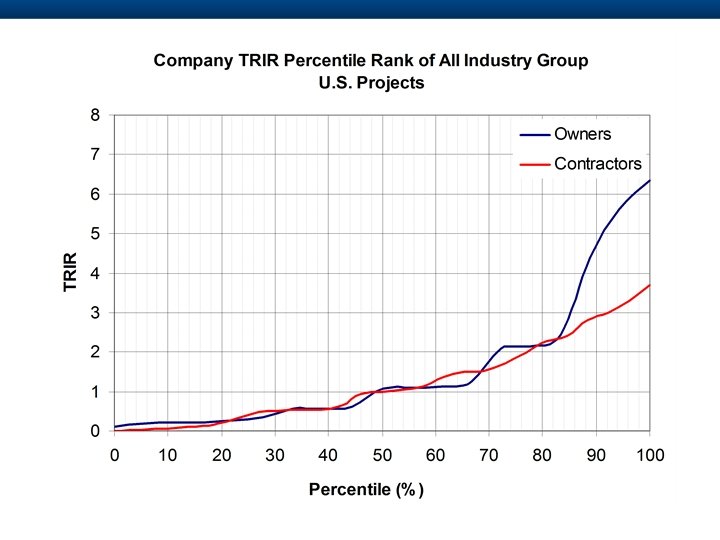
 TRIR Rate
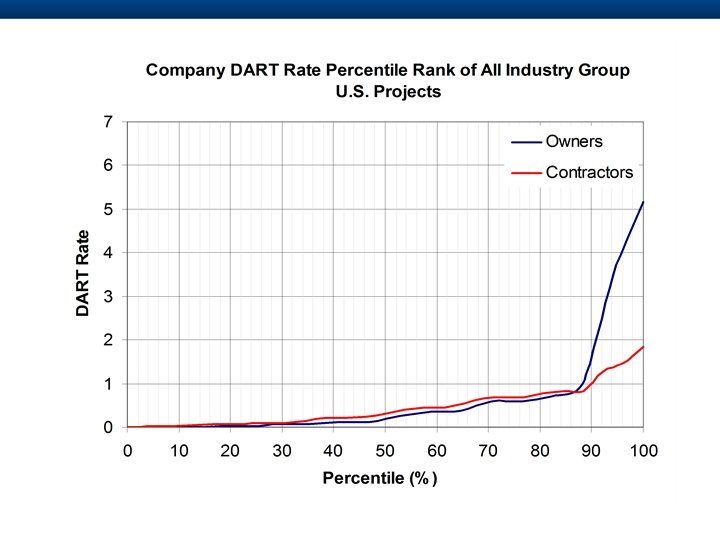
 DART Rate
 Project Distribution by Location Number of Responded Projects 90 80 81 Owner Contractor 70 60 50 40 43 35 30 20 10 9 0 USA/Canada International Project Location VBP Survey Figure 3
 Number of Projects Project Distribution by Nature 50 43 Owner Contractor 41 40 30 20 25 18 10 0 14 11 1 3 Addition Grass Roots Modernization Brownfield or Co-location Project Nature VBP Survey Figure 4
 80 71 Owner Contractor 60 40 28 36 20 13 7 6 4 3 e ur st ru ct ild fra In nd ht I Li g Bu al us tri ria du st In vy ea H in g 0 l Number of Responded Projects Project Distribution by Industry Sector Industrial Group VBP Survey Figure 5
 Number of Responded Projects Project Distribution by Cost Category 45 40 35 30 25 20 15 10 5 0 Owner Contractor 36 34 21 16 10 7 18 13 9 2 <= $5 MM $15 MM $50 MM - > $100 MM Cost Category VBP Survey Figure 6
 Project Distribution by Project Delivery System Traditional D-B-B 31. 5% CM at Risk 10. 7% Design-Build 35. 7% Parallel Primes 14. 9% VBP Survey Figure 7 Other Multiple 3. 0% Design-Build 4. 2%
 Value of Best Practices Theoretical Relationship Performance 0. 4 0. 3 0. 2 Better 0. 1 0 -0. 1 -0. 2 4 th Quartile Low 3 rd Quartile 2 nd Quartile Practice Use 1 st Quartile High
 CII Resources Research Products • CII Research Summaries • CII Implementation Resources • CII Research Reports CII Productions • Professional Development Continuum • CII Store • Education Modules • CII Online Education • CII Courses • Registered Education Providers • Executive Leadership Program CII Events • Annual Conference • Performance Improvement Workshops • Benchmarking Seminars/ Workshops • Web Seminars • Communities of Practice CII Mentoring • Implementation Champion Program • Experienced ISC members • CII Staff Implementation Tool Box
 Professional Development Continuum • Development of project management professionals • Online education path outlining CII educational resources • Targeted to competencies in: • • Leadership & Human Relations Project Organization & Management Continuous Improvement Front End Planning & Risk Management Project Implementation & Controls Design, Procurement & Materials Management Construction Practices and Contracts Safety, Health, Environment & Security
 CII Education Modules • CII research formatted as instructor-led courses • Developed by industry experts and adult learning instructional designers 18 different topics Taught right from the book – or – Customized by your own trainers to specific company needs and applications
 CII Education Modules Everything an instructor needs … • • Power. Point Slides Lecture Notes Exercises Case Studies
 CII Online Education • Based on CII Best Practices • Fully interactive web-based learning • Professional Development Hours (PDH) credits
 Continuing Education Courses Construction Industry Institute Continuing Education Courses are sessions built from a series of half and full-day courses presenting CII Research findings in an interactive classroom environment Participants may register for an individual course, multiple individual courses, or entire one-week session Each Individual Course covers a specific area of CII Research
 This is where you want to send your top talent. • Develop your next generation of industry leaders • Two-week, intensive, in-residence program at UT’s Executive Conference Center • Construction Industry Focus • Now in its fifth year January 9 -21, 2011 ATT Executive Education Center The University of Texas at Austin 41
 Changes for 2011 A better value in a difficult economy • Two-week course – reduced from three weeks – 33% reduction in time required away from office • $19, 900 registration fee – reduced from $23, 900 – 17% reduction in registration fee • Retains 87% of podium hours – 13% reduction in podium hours – reduction based on participant feedback 42
 CII Executive Leadership Program Alumni
 CII Class of 2011 Fill these spots with your rising stars!
 What Is the ROI? • Enhanced executive leadership capabilities • Strategic business skills • Collaborative relationships – between owners and contractors – with peers across the industry • Benchmarking on best practices • Executive level networking opportunities 45
 Past Participant Companies • Abbott • Aker Kværner • Alstom Power • Aramco Services • BE&K • Baker Concrete Construction • Bateman Engineering • Bowen Engineering • Burns & Mc. Donnell • CB&I • CCC Group • CDI • CH 2 M HILL • CSA Group • Du. Pont • Eli Lilly • Emerson Process Management • Flint Energy Services • Fluor • Foster Wheeler • General Services Administration • Hatch • Hill International • International Paper • Jacobs • Midwest Steel • NOVA Chemicals • Ontario Power Generation • Rohm and Haas • S&B Engineers & Constructors • Saudi Aramco • The Shaw Group • Smithsonian Institution • Southern Company • Tampa Electric • TXI • U. S. Army Corps of Engineers • Walbridge • Worley. Parsons
 January 9 -21, 2011 ATT Executive Education Center The University of Texas at Austin 47
 2010 CII Annual Conference August 3 -5, 2010 Grand Cypress Resort Orlando, Florida • Over 500 Top Industry Attendees • Presentations on: – New CII research – CII product implementation case studies • New CII Initiatives – Professional Development – Implementation – Benchmarking – Other • Notable Speakers
 Performance Improvement Workshop Fall Focused on: • CII Product Implementation • Best Practices Houston, Texas November 8 -10, 2010 • New Practices • Case Studies • Networking
 Benchmarking Conferences & Workshops • Essential for implementation of reliable benchmarking process. • Updates improvements in the online system • Explains new metrics & interactive reports • Delivers annual training needed to stay in tune with improvements Contact Frances De. Coux at (512) 232 -3000 or f. decoux@mail. utexas. edu • Ensures greatest benefit from this valuable CII resource. June 2 -3, 2010 Abbott Park (Chicago), IL Hosted by Abbott
 The Implementation Model Celebrate Success Measure Results Product Implementation Products Training Product Champions/Review Boards Implementation Plan and Goals Self Audit Corporate Implementation Champion Corporate Commitment CII Products CII Support Benefit/Cost Data
 CII Resources Research Products • CII Research Summaries • CII Implementation Resources • CII Research Reports CII Productions • Professional Development Continuum • CII Store • Education Modules • CII Online Education • CII Courses • Registered Education Providers • Executive Leadership Program CII Events • Annual Conference • Performance Improvement Workshops • Benchmarking Seminars/ Workshops • Web Seminars • Communities of Practice CII Mentoring • Implementation Champion Program • Experienced ISC members • CII Staff Implementation Tool Box
 Participation Opportunities • As User of CII Programs & Services – Professional Development Continuum – CII Store – Education Modules – CII Online Education – CII Courses – Registered Education Providers – Executive Leadership Program • As Contributor to CII Programs & Services – – CII Committees CII Research Teams Communities of Practice Best Practices Course • As Attendee or Presenter at CII Events – Annual Conference – Performance Improvement Workshops – Benchmarking Seminars/ Workshops – Web Seminars
 Value of Best Practices Theoretical Relationship Performance 0. 4 0. 3 0. 2 Better 0. 1 0 -0. 1 -0. 2 4 th Quartile Low 3 rd Quartile 2 nd Quartile Practice Use 1 st Quartile High
 Questions?
 Today’s Agenda • Introduce CII • CII-CMAA Alliance • Present High Owner Relevance CII Practices – – – – Zero Accidents Partnering Team Building Alignment Front End Planning For Start Up Project Delivery & Contract Strategies 56
 CII - CMAA Alliance Best Practices - Best Practitioners Mission Statement. Improve delivery of capital facilities in all settings by promoting the professional practice of Construction and Program Management in conjunction with the broadest possible application of recognized industry Best Practices. 57
 Why Best Practices- Best Practitioners • CII – Dedicated to organizational transformation. – Promotes a culture of high quality execution in contractor (architect/engineer companies, construction companies) & owner organizations. • CMAA – Emphasis on individual excellence. – Established Certified Construction Manager credential and its – Solid Standards of Practice. 58
 Benchmarks – Cost OWNER Best in Class= 6 x Better Cost Performance COST GROWTH CONTRACTOR Median (-3%) Best in Class Leads by 15% “Best in Class” (-19%) Median (0. 98) “Best in Class” (0. 83) BUDGET FACTOR
 Benchmarks – Schedule OWNER CONTRACTOR Best in Class Leads by 13% Best in Class Leads by 17% Median (+2%) “Best in Class” (-11%) Schedule Growth Median (1. 00) “Best in Class” (0. 83) Schedule Factor
 A word on semantics… CMAA Construction Manager = CII Project Manager CMAA Service Provider = CII Contractor Same Focus: Owner support from project conception through turnover of facilities 61
 Dec 09 CII Value & Satisfaction Survey Responses- Agree or Strongly Agree CII Professional Development Program Users • CII Professional Development Programs should be expanded to assist continuing improvement efforts- 77% • CII should expand distance learning opportunities-76% • CII should expand instructor led professional development opportunities- 68% • CII should expand support for professional accreditation programs- 66%
 October 2009 CII BOA- SPC Poll results Trend Category 2010 Outlook 2011 -2015 Outlook Change in Priorities Workforce & Human Capability 3 1 Increasing Project Delivery 2 5 Decreasing Corporate Strategy 2 4 Decreasing Technology & Innovation 4 3 Increasing Market & Demand Drivers 1 2 Decreasing Attention to Work Force Development Returns
 The Challenge Returns With Economic Recovery: • Aging workforce. • Growing backlogs. • Shortage of skilled professionals. • Need for a structured professional development program. 64
 Organizational Synergies • The two organizations will promote safer, higher quality, faster and more efficient construction • Will combine – CII’s research findings, professional development resources and published Best Practices with – CMAA’s Construction Management Standards of Practice (SOP) and the Certified Construction Manager (CCM) program administered by the Construction Manager Certification Institute (CMCI)), a subsidiary of CMAA. 65
 Current Alignment Activities • Dissemination of combined bodies of knowledge. • Reciprocal discounts. • Supporting each others’ events. • Joint review of CMAA’s CM “core competencies, ” as defined in the new SOP. 66
 Current Alignment Activities • Comparing those core competencies to associated CII Best Practices documents. • Coordinating events calendars. • Beginning to explore cooperative original research. 67
 What does it mean to CII & CMAA members? • Confidence in a CII endorsed professional certification process. • Recognition of continuing education credits earned through participation in programs and activities. • Greater dissemination of CII research findings extending the reach to your contractors, subcontractors, vendors. 68
 So what do I do now? • CII Members – Begin your CCM journey – Tap CMAA Professional Development Opportunities • CMAA Members – Learn about CII practices and Best Practices – Tap CII Professional Development Opportunities • Enjoy the discounts and reap the benefits! 69
 CII - CMAA Alliance Best Practices - Best Practitioners • Best Practices • Implemented through Best Practitioners
 Questions?
 Today’s Agenda • Introduce CII • CII-CMAA Alliance • Present High Owner Relevance CII Practices – – – – Zero Accidents Partnering Team Building Alignment Front End Planning For Start Up Project Delivery & Contract Strategies 72
 Where do CII Practices & Best Practices fit in the project cycle? Engineering Conceptual & Front End Planning Basic Detail Procurement Construction Startup & Commissioning Operations Everywhere!
 Opportunity for Influence Conceptual Analysis and R&D Rapidly Decreasing Influence Low Influence Commitment$$ Scope Definition Front End Planning Basic Project Production Construction Engineering Data and Authorization Engineering Complete Scoping and Procurement Project Life Cycle Project Expenditures Level of Influence Major Influence Turnover and Start-up
 CII Best Practices Project Planning Phase • Alignment Construction/Startup Phase • Planning for Startup • Partnering • Front End Planning • Team Building • Zero Accidents Techniques Design Phase • Constructability • Materials Management Project Life Cycle • Benchmarking & Metrics • Change Management • Disputes Prevention • Implementation of CII Research • Lessons Learned • Quality Management
 How good is your safety record? • What is: – Your Total Recordable Incident Rate (TRIR)? – Your goal for a TRIR? – Your Days Away, Restrictions and Transfers rate (DART)? – Your goal for a DART rate? 76
 Definition of Zero Accident Techniques that promote a culture that believes that • all accidents are preventable • establishes zero accidents as the only acceptable goal. Initial Application Engineering Conceptual & Front End Planning Basic Detail Procurement Construction Startup & Commissioning Operations
 Zero Accidents Techniques • EM-160 Making Zero Accidents A Reality • RS 160 -1 Safety Plus: Making Zero Accidents A Reality • SP 32 -2 Zero Injury Economics • RS 160 a-1 Making Zero Accidents A Reality: Focus on Shutdowns, Turnarounds, and Outages • IR 101 -2 Design for Construction Safety Toolbox, Version 2. 0 • RS 32 -1 Zero Injury Techniques • RS 216 -1 Targeted Safety Programs • RS 190 -1 The Owners’ Role in Construction Safety • RS 13 -1 Managing Subcontractor Safety • Video DVD-1 One Too Many
 Elements of Zero Accident Techniques address: • Owner’s influence • Role of safety professionals • Management actions • Award program effectiveness • Design considerations • Safety meetings • Written programs • Inspections and audits • Training • Other related issues
 Impact of Zero Accident Techniques on TRIROwners 1. 6 1. 45 TRIR 1. 2 0. 8 0. 57 High Use = 61% TRIR Reduction 0. 4 0. 0 High Use (N=35) VBP Survey Figure 24 Low Use (N=37)
 Impact of Zero Accident Technique on TRIRContractors 0. 8 0. 72 TRIR 0. 6 0. 4 0. 33 High Use = 54% TRIR Reduction 0. 2 0. 0 High Use (N=29) VBP Survey Figure 27 Low Use (N=7)
 Additional CII Implementation Resources • Education Modules EM 160 -21 • Continuing Education Course II • Online Education CT 07 • Registered Education Providers YES • Community of Practice YES • Web Seminars WS 11 -01 & 02
 Partnering • Project specific partnering – Project objectives focused; short term. • Strategic alliances – Enterprise objectives focused; long term Partnering Strategy For ABC Partners Optimum Application Engineering Conceptual & Front End Planning Basic Detail Procurement Construction Startup & Commissioning Operations
 Partnering Tool. Kit, IR 102 -2 • Proactive management process • Integrates & optimizes value-added services of each party to best achieve business objectives of all parties within the relationship. • Promotes use of common values and honorable business practices.
 The Partnering Process Phase 1 Owner’s Internal Alignment • Identify Business Drivers • Evaluate Partnering • Prepare and Align Phase 2 Partner Selection • Select Optimum Partner Phase 3 Phase 4 Partnering Relationship Alignment • Align Objectives • Develop Measures • Develop Reward System Project Alignment Phase 5 Work Process Alignment • Develop “Win / Win” Objectives • Establish Intraproject Goals • Reward Accomplish ment of Objectives • Establish Processes to Support Measures
 Benefits of Partnering • Efficiency improvements from working together. • Reduced costs for all from effective resource utilization. • Increased opportunity for innovation. • Promotes continuous improvement. • Improved profits (value) for all parties. • Attitude change from adversarial to cooperative, from self-centered to team-focused, from win/lose to win/win.
") Category Benchmarking Result Area Partnering vs. Traditional Construction Results Cost Total Project Cost (TPC) Construction Administration Marketing Engineering Value Engineering Claims (% of TPC) Profitability 10% reduction 24% reduction 50% reduction $10 per hour reduction 337% increase 87% reduction 25% increase Schedule Overall Project Schedule Changes Schedule Compliance 20% reduction 48% reduction Increased from 85% to 100% Safety Hours without lost time accidents Lost work days Number of doctor cases Safety rating 3 million vs. 48, 000 industry standard 4 vs. 6. 8 industry standard 74% reduction 5% of national average Quality Rework Change orders Direct work rate 50% reduction 80% reduction 42% increase Claims Number of claims Projects with claims 83% reduction 68% reduction Other Job satisfaction 30% improvement
Category Benchmarking Result Area Partnering vs. Traditional Construction Results Cost Total Project Cost (TPC) Construction Administration Marketing Engineering Value Engineering Claims (% of TPC) Profitability 10% reduction 24% reduction 50% reduction $10 per hour reduction 337% increase 87% reduction 25% increase Schedule Overall Project Schedule Changes Schedule Compliance 20% reduction 48% reduction Increased from 85% to 100% Safety Hours without lost time accidents Lost work days Number of doctor cases Safety rating 3 million vs. 48, 000 industry standard 4 vs. 6. 8 industry standard 74% reduction 5% of national average Quality Rework Change orders Direct work rate 50% reduction 80% reduction 42% increase Claims Number of claims Projects with claims 83% reduction 68% reduction Other Job satisfaction 30% improvement
 Impact of Partnering on Cost Growth- Owner 15% Cost Growth 10% 5% 2. 4% 0% -5% High Use = 9. 1 % Cost Improvement -6. 7% -10% -15% High Use (N=15) Low Use (N=75) Mean N SEM High Use -6. 73% 15 2. 78% Low Use 2. 44% 75 1. 62% VBP Survey Figure 19 P Sig. α=0. 1 0. 019 Y
 Additional CII Implementation Resources • Education Modules EM 102 -21 • Continuing Education Pending Interest • Online Education CT 16 -CT 19 • Registered Education Providers YES • Community of Practice YES
 Team Building? 92
 Team Building • Project-focused process with team: – Shared goals & interdependence, – Trust, commitment, accountability, – Collaborative problem-solving skills. Initial Application Engineering Conceptual & Front End Planning Basic Detail Procurement Construction Startup & Commissioning 93 Operations
 Team Building • Team Building: Improving Project Performance RS 37 -1 • Building the Project Team – Participant Handbook EM 37 -21 A 94
 Elements of Team Building: Culture - Leadership - Communication - Trust and Honesty Execution Processes - Stakeholders - PPP Process - Reward and Recog. Information - Priority between cost, schedule, and features Tools - Team Meetings - Teamwork and Team Building - Planning Tools 95 B a r r i e r s Alignment
 Benefits of Team Building : • Reducing adversarial relationships, developing trust and team spirit. • Improving cooperation, cohesiveness, and problem-solving skills. • Providing alignment of goals and expectations. • Identifying problems early. • Shortening schedule. • Lowering cost. • Improving safety record. • Reducing and managing changes. 96
 Impact of Team Building on Schedule Growth. Owner Schedule Growth 15% 10% 6. 0% 5% 0% -1. 0% High Use = 7. 0 % Schedule Improvement -5% -10% -15% High Use (N=26) Low Use (N=48) Mean N SEM High Use -0. 95% 26 3. 24% Low Use 5. 96% 48 2. 19% VBP Survey Figure 20 P Sig. α=0. 1 0. 074 Y
 CII Implementation Resources • Education Modules • Continuing Education Course I • Online Education Planned • Registered Education Providers YES • Community of Practice 98 EM 37 -21 Pending Interest
 Alignment • Projects participants working in harmony to develop and meet a uniformly defined and understood set of project objectives. Initial Application Engineering Conceptual & Front End Planning Basic Detail Procurement Construction Startup & Commissioning Operations
 Alignment • Alignment During Pre-Project Planning, IR 113 -3. • Project Objective Setting, RS 12 -1, Second Edition
 Elements of Alignment Top-to-Bottom Alignment Executive Business Project Business Planning Pre-Project Planning Project Execution Functional Facility Operation Project Life Cycle Alignment Cross-Organizational Alignment
 Alignment During Front End Planning 102
 Alignment of Project Objectives Objective Setting Phases Agreement Matrix
 Benefits of Alignment • Ensures that participants are working toward a common goal.
 Alignment Index Score*") Alignment Index vs. Performance Analysis (from recent Research Team 213 data) Alignment Index Score* Performance Cost Less than Median Greater than Median 3. 3% over budget 6. 5% below budget (N=30) Schedule 24. 5% behind schedule (N=33) Change orders 8. 2% of budget (N=26) *Alignment During Pre-Project Planning (Front End Planning) (N=34) 8. 4% behind schedule (N=35) 7. 6% of budget (N=27)
Alignment Index vs. Performance Analysis (from recent Research Team 213 data) Alignment Index Score* Performance Cost Less than Median Greater than Median 3. 3% over budget 6. 5% below budget (N=30) Schedule 24. 5% behind schedule (N=33) Change orders 8. 2% of budget (N=26) *Alignment During Pre-Project Planning (Front End Planning) (N=34) 8. 4% behind schedule (N=35) 7. 6% of budget (N=27)
 Impact of Alignment during FEP on Cost Growth. Owners 15% Cost Growth 10% 5. 4% 5% 0% High Use = 8. 7 % Cost Improvement -3. 3% -5% -10% -15% High Use (N=51) Low Use (N=45) Mean N SEM High Use -3. 30% 51 1. 58% Low Use 5. 39% 45 2. 19% VBP Survey Figure 18 P Sig. α=0. 1 0. 001 Y
 Additional CII Implementation Resources • Education Modules EM 113 -21 • Continuing Education Course I • Online Education CT 02 • Registered Education Providers YES • Community of Practice Pending Interest
 Questions?
 Definition of Front End Planning is also known as: • Conceptual planning • Front end loading • Pre-project planning • Programming/schematic design • Feasibility analysis • Early project planning Initial Application Engineering Conceptual & Front End Planning Basic Detail Procurement Construction Startup & Commissioning Operations
 Front End Planning Front-End Planning Process, IR 213 -3 • HTML product only available by download • Latest tools in sequence • Prompts timely use of tools • Includes electronic files of templates, checklists, and other tools
 Front End Planning Front-End Planning Process, IR 213 -2 • HTML product; download only • Provides latest tools in sequence • Prompts timely use of tools • Files of templates, checklists, other tools • Includes: – IR 113 -2, Project Definition Rating Index (PDRI) – Industrial Projects – IR 155 -2, PDRI – Buildings Projects – IR 113 -3, Alignment During Pre-Project Planning) – RS 213 -1 Front End Planning: Break the Rules, Pay the Price – RS 241 -1 Optimizing Construction Input in Front End Planning – IR 242 -2 Front End Planning in Renovation & Revamp Projects
 Front End Planning Process 0 Feasibility 1 Concept 2 Detailed Scope Initiate Phase Analyze Alternatives Preliminary Design/Eng. Filter Options Conceptual Scope and Estimates Preliminary Des. /Eng. Reviews PDRI 1 Evaluate and Select Best Alternatives PDRI 2 i Design and Construction Initiate Phase Generate Options 3 Feasibility Report Concept Phase Report PDRI 2 Finalize Scope Definition Cost & Schedule Control Estimates PDRI 3 Incorporates PDRI checkpoints with target scores 112 Project Definition Package Recognizes role of design in support of the process
 Planning Tools • PDRI: Project Definition Rating Index, Industrial Projects, Third Edition, IR 113 -2 • Comprehensive checklist with 70 scope definition elements. • Identifies level of scope definition, areas for improvement on industrial projects. Min score 70 Min recommended score 200 Max score 1000
 AL RI ST U ND -I RI I 1 R 31 PD 2
 Planning Tools PDRI, Project Definition Rating Index for Building Projects, Third Edition, IR 155 -2. • Comprehensive checklist with 64 scope definition elements. • Identifies level of scope definition, areas for improvement on building projects. Min score 71 Min recommended score 200 Max score 1000
 IR 113 -2 PDRI- Industrial IR 155 -2 PDRI- Buildings SECTION I A. Business Strategy B. Owner Philosophies C. Project Requirements SECTION I A. Manufacturing Objectives Criteria B. Business Objectives C. Basic Data Research & Development D. Project Scope E. Value Engineering SECTION II F. Site Information G. Process/ Mechanical H. Equipment Scope I. Civil, Structural & Architectural J. Infrastructure K. Instrument & Electrical SECTION III r ila L. Procurement Strategy im M. Deliverables t s a N. Project ewh Control P. Project Execution Plan om S t bu ! es SECTION II su is D. Site Information nt e E. Building Programming fer dif F. Building/Project Design Parameters s d sa res d G. Equipment m ite b su SECTION III H. Procurement Strategy J. Deliverables K. Project Control L. Project Execution Plan
 Tool • Assists in developing overall approach.") IR 242 -2 Shutdown/Turnaround Alignment Review (STAR) Tool • Assists in developing overall approach. • Enhances alignment among stakeholders. • Helps establish multiple project communications. • • Provides planning consistency around shutdown, turnaround, outage (STO) objectives. • Complements “PDRI” for Renovations/Revamps Tests planning alignment/preparedness of multiple STO tasks. • Helps identify inherent STO risks for early stage mitigation.
IR 242 -2 Shutdown/Turnaround Alignment Review (STAR) Tool • Assists in developing overall approach. • Enhances alignment among stakeholders. • Helps establish multiple project communications. • • Provides planning consistency around shutdown, turnaround, outage (STO) objectives. • Complements “PDRI” for Renovations/Revamps Tests planning alignment/preparedness of multiple STO tasks. • Helps identify inherent STO risks for early stage mitigation.
 Example STAR Timeline Feasibility 0 Concept 1 Detailed Scope 2 Design 3 Project 1 Feasibility 1 Concept 2 Project 2 Detailed Scope Timeline of communication between PM and STO leadership 0 Feasibility 1 Concept 2 = Communications of status and Input from PM/STO Leadership STAR Project n Detailed Scope 3 Design STAR 0 3 STO Design At this point, the STO Leadership can collectively evaluate results for all projects Actual timing for each application will be set by the Project/STO Leadership Team
 IR 242 -2 Identifies Risks
 IR 242 -2 - Provides Risk Mitigation Action Plan
 Cards Explores current available technologies") Additional IR 242 -2 Resource: Project Condition Investigation (PCI) Cards Explores current available technologies for front end planning investigation & risk reduction: • Underground Conditions • Integrity (Mechanical/Structural/Electrical) • Restricted Access • Spatial Relationships • Risk Identification • Environmental Constraints
Additional IR 242 -2 Resource: Project Condition Investigation (PCI) Cards Explores current available technologies for front end planning investigation & risk reduction: • Underground Conditions • Integrity (Mechanical/Structural/Electrical) • Restricted Access • Spatial Relationships • Risk Identification • Environmental Constraints
 IR 242 -2 Identifies Tools & Technologies For Risk Mitigation
 Recent CII Front End Planning Benefit Data from Research Team 213 • Sample of 609 projects, $37 billion • Results of good front end planning: § Cost: 10 percent less § Schedule: 7 percent shorter delivery § Changes: 5 percent fewer
 Impact of FEP on Cost Growth- Owners 15% Cost Growth 10% 6. 4% 5% 0% High Use = 8. 6 % Cost Improvement -2. 2% -5% -10% -15% High Use (N=59) Low Use (N=37) Mean N SEM High Use -2. 19% 59 1. 54% Low Use 6. 35% 37 2. 51% VBP Survey Figure 17 P Sig. α=0. 1 0. 030 Y
 Additional CII Implementation Resources • Education Modules See next slide • Continuing Education Course I • Online Education CT 09 -CT 13 • Registered Education Providers YES • Community of Practice Yes
 Front End Planning Education Modules • EM 213 -21 Front End Planning • EM 241 -21 Construction Input Assessment* • EM 242 -21 Front End Planning of Renovation & Revamp Projects* • Project Definition Rating Index (PDRI) – EM 113 -23 Industrial Projects – EM 155 -21 Buildings * To be available later in 2010 126
 Planning for Startup • Planning for the transitional phase between plant construction completion & commercial operations, including: – Systems turnover. – Check-out of systems. – Commissioning of systems. – Introduction of feedstocks. – Performance testing. Engineering Conceptual & Front End Planning Basic Detail Procurement Construction Initial Application Startup & Commissioning Operations
 Planning for Startup, IR 121 -2. • Contains Toolkit with 26 tools to help plan successful startup. • Details 45 activities that should be noted as part of planning for startup over eight typical phases of a project. • Includes Startup Planning Model.
 Su. PERTOOL 1 -A-2
 Su. PERTOOL 1 -A-2 Thorough Planning 100 90 80 70 Su. PER Score WORK IN THIS ZONE 60 50 AVOID THIS ZONE 40 30 20 10 No Planning 0 Definition, Concept & Feasibility Front-End Engineering Detailed Design Construction Project Phases Checkout, Commissionin g & Initial Operations
 Benefits of Planning for Startup • Provides common objectives & plan for: – – System turnover, checkout, commissioning & filling. Performance testing. Business unit & plant operations. Owner project management. • Involves key front-end stakeholders before design is fixed. – Project Management, Engineering, Construction – Plus Startup Manager, Plant Operations & Maintenance. • Increased focus on: – Cost elements of startup. – Estimate accuracy. – Meeting commercial operations date. • Timely & thorough identification of problems & issues during planning phase…before startup activities.
 Impact of Planning for Startup on Cost Growth. Owners 15% Cost Growth 10% 5. 7% 5% 0% -1. 7% High Use = 7. 4 % Cost Improvement -5% -10% -15% High Use (N=55) Low Use (N=22) Mean N SEM High Use -1. 72% 55 1. 52% Low Use 5. 72% 22 3. 85% VBP Survey Figure 22 P Sig. α=0. 1 0. 083 Y
 Impact of Planning for Startup on Schedule Growth- Owners Schedule Growth 20% 15% 10% 9. 0% 5% 1. 1% 0% High Use = 7. 9 % Schedule Improvement -5% -10% -15% High Use (N=48) Low Use (N=15) Mean N SEM High Use 1. 13% 48 2. 45% Low Use 9. 01% 15 1. 72% VBP Survey Figure 23 P Sig. α=0. 1 0. 011 Y
 Impact of Planning for Startup on Cost Growth. Contractors 20% Cost Growth 15% 10% 6. 9% 5% 0% High Use = 10. 3 % Cost Improvement -3. 4% -5% -10% -15% High Use (N=15) Low Use (N=9) Mean N SEM High Use -3. 40% 15 1. 93% Low Use 6. 94% 9 4. 76% VBP Survey Figure 26 P Sig. α=0. 1 0. 070 Y
 Additional CII Implementation Resources • Education Modules EM 121 -21 • Continuing Education Course I • Online Education CT 13 -CT 14 • Registered Education Providers YES • Community of Practice Pending Interest
 • A process to assist in selecting") Definition Project Delivery & Contract Strategy (PDCS) • A process to assist in selecting a contract delivery strategy to optimize project objectives. Initial Application Engineering Conceptual & Front End Planning Basic Detail Procurement Construction Startup & Commissioning Operations
Definition Project Delivery & Contract Strategy (PDCS) • A process to assist in selecting a contract delivery strategy to optimize project objectives. Initial Application Engineering Conceptual & Front End Planning Basic Detail Procurement Construction Startup & Commissioning Operations
 Owner’s Tool for Project Delivery and Contract Strategy") Project Delivery & Contract Strategy (PDCS) Owner’s Tool for Project Delivery and Contract Strategy (PDCS) Selection User’s Guide, IR 165 -2 • Excel tool enables structured & integrated procedure for developing project delivery & contract strategies. • Provides more project delivery & contracting strategy alternatives in decision-making process tailored to project needs. • Incorporates quantitative assessment of 12 PDCS alternatives • Harmonizes delivery systems with contract strategies & relates these to owner’s project objectives.
Project Delivery & Contract Strategy (PDCS) Owner’s Tool for Project Delivery and Contract Strategy (PDCS) Selection User’s Guide, IR 165 -2 • Excel tool enables structured & integrated procedure for developing project delivery & contract strategies. • Provides more project delivery & contracting strategy alternatives in decision-making process tailored to project needs. • Incorporates quantitative assessment of 12 PDCS alternatives • Harmonizes delivery systems with contract strategies & relates these to owner’s project objectives.
 PDCS Tool Considerations • Phase sequencing • Project team relationships • Compensation approach
 PDCS Tool Considerations. Phase sequencing
 PDCS Tool Considerations. Project Team Relationships
 PDCS Tool Considerations. Compensation Approach
 Tool Examines Effectiveness Value of Selected PDCS in Meeting Project Objectives Factor 1 Factor 2 Factor 3 Factor 4 Factor 5 Factor 6 Factor 7 Factor 8 Control cost growth Ensure lowest cost Delay or minimize expenditure rate Facilitate early cost estimates Reduce or transfer risks to contractor Control time growth Ensure shortest schedule Promote early procurement PDCS 01 80 90 100 0 80 20 0 0 PDCS 02 50 100 70 20 50 50 50 90 PDCS 03 80 70 90 10 60 20 10 0 PDCS 04 80 70 90 10 60 20 0 0 PDCS 05 50 60 60 20 20 50 40 90 PDCS 06 60 40 40 70 70 70 80 100 PDCS 07 90 80 10 90 90 90 100 PDCS 08 70 80 30 80 80 80 90 100 PDCS 09 0 0 50 20 10 0 90 80 PDCS 10 0 0 60 50 PDCS 11 100 80 0 100 100 100 PDCS 12 40 40 100 60 0 80 100
 PDCS Analysis Tab View
 Benefits of the PDCS Tool • Relates PDCS to project objectives and success parameters. • Provides decision support tool to facilitate selection of most suitable PDCS. • Expands knowledge base with well-defined, documented PDCS alternatives. • Provides rationale for selecting PDCS, based on quantification of alternatives. • Supports CII Alignment and Front End Planning Best Practices.
 Additional CII Implementation Resources • Education Modules EM 165 -21 • Continuing Education Course II • Online Education Pending Interest • Registered Education Providers YES • Community of Practice Pending Interest • Web Seminars Yes- 4 part series
 Key CII Education & Participation Resources • The Professional Development Continuum- path for construction project management professional development & resources aid. • CII Education Modules- recast CII original research into adult-learning courses for instructor-led training. • Online Education courses- based on CII Best Practices, use the Internet to deliver CII education. • CII Web Seminars- live events delivered on various topics of interest via the Internet. • Continuing Education Courses- present CII education modules in an interactive classroom environment at The University of Texas at Austin. • The CII Executive Leadership Program- partnership between CII and The University of Texas’ Mc. Combs School of Business to offer a world-class leadership program for senior executive candidates.
 Today’s Agenda • Introduce CII • CII-CMAA Alliance • Present High Owner Relevance CII Practices – – – – Zero Accidents Partnering Team Building Alignment Front End Planning For Start Up Project Delivery & Contract Strategies 147
 Questions?
 Thank you for your attention! Manuel A. Garcia Associate Director Construction Industry Institute 3925 W. Braker Lane (R 4500) Austin, TX 78759 -5316 (512) 232 1966 mgarcia@cii. utexas. edu
 Bonus! • Additional information on the Project Health Indicator
 Project Planning Phase Design/ Construction/ Startup Phases •") CII Practices (CII Best Practice Candidates) Project Planning Phase Design/ Construction/ Startup Phases • Attract and Maintain Skilled Workers • Craft Productivity Practices • Automated Identification • Design for Maintainability • Construction Input Assessment • Design for Safety • Effective Use of Global Engineering Workforce • Engineering Productivity Measurement • Environmental Remediation Management • Piping Design • Equitable Risk Allocation • International Project Risk Assessment Project Life • Cost & Schedule Control • Employee Incentives • Fully Int. & Auto. Project Processes (FIAPP) • Project Delivery and Contract Strategies • Information Integration • Project Security • Management of Education & Training • Project Teams • Managing Workers’ Compensation • Technology Implementation • Project Health Assessment • Value Management • Small Projects Execution • Leader Selection • Modularization/Preassembly • Organizational Work Structure • Work Process Simulation
CII Practices (CII Best Practice Candidates) Project Planning Phase Design/ Construction/ Startup Phases • Attract and Maintain Skilled Workers • Craft Productivity Practices • Automated Identification • Design for Maintainability • Construction Input Assessment • Design for Safety • Effective Use of Global Engineering Workforce • Engineering Productivity Measurement • Environmental Remediation Management • Piping Design • Equitable Risk Allocation • International Project Risk Assessment Project Life • Cost & Schedule Control • Employee Incentives • Fully Int. & Auto. Project Processes (FIAPP) • Project Delivery and Contract Strategies • Information Integration • Project Security • Management of Education & Training • Project Teams • Managing Workers’ Compensation • Technology Implementation • Project Health Assessment • Value Management • Small Projects Execution • Leader Selection • Modularization/Preassembly • Organizational Work Structure • Work Process Simulation
 Definition Project Health Assessment • Assessment of project health through leading indicators to prevent adverse safety, quality, schedule and cost results. Initial Application Engineering Conceptual & Front End Planning Basic Detail Procurement Construction Startup & Commissioning Operations
 Tool, IR 220 -2 • Addresses 43") Project Health Assessment Project Health Indicator (PHI) Tool, IR 220 -2 • Addresses 43 leading indicators of project trouble. • Begins where CII Project Definition Rating Index (PDRI) ends: after front-end planning. • Identifies & quantifies extent of each leading indicator throughout project execution. • Provides direction for corrective action. • Excel based; requires 30 -45 minutes to complete.
Project Health Assessment Project Health Indicator (PHI) Tool, IR 220 -2 • Addresses 43 leading indicators of project trouble. • Begins where CII Project Definition Rating Index (PDRI) ends: after front-end planning. • Identifies & quantifies extent of each leading indicator throughout project execution. • Provides direction for corrective action. • Excel based; requires 30 -45 minutes to complete.
 Samples of Leading Indicators ØHigh team turnover rate & instability. ØProject team losing confidence in schedule accuracy & validity. ØOwner and Contractor personnel are not properly aligned. ØPM lacking required level of experience and skills.
 Leading Indicator Input Example
 Outcome Example
 Project Practices Implementation Assessment
 Customization
 Using the PHI Tool Potential Uses v v Status Reporting Project Reviews Auditor Reviews Benchmarking / Training Gap identification
 Benefits of Project Health Assessment Tool § Early Warning – uses leading indicators rather than traditional lagging indicators. § Provides basis for proactive decisions. § Predicts risks & systemic process deficiencies by Project Outcome and Project Practice Area. § Alternate perspective to progress reporting: quantifies non quantifiable measures- “Gut Feeling. ” § Applicable to Owners & Contractors at any level, project size or market sector. § Usable throughout project execution, identifies risk areas & long term project system gaps. § Suggests potential CII sources for mitigation strategies. § Identifies project controls opportunities and areas for project& corporate focus.
 Additional CII Implementation Resources • Education Modules Pending Interest • Continuing Education Pending Interest • Online Education Pending Interest • Registered Education Providers Yes • Community of Practice Pending Interest
 Extra Bonus! • Additional information on CII Benchmarking & Metrics
 CII Best Practices Project Planning Phase • Alignment Construction/Startup Phase • Planning for Startup • Partnering • Front End Planning • Team Building • Zero Accidents Techniques Design Phase • Constructability • Materials Management • • • Project Life Cycle • Benchmarking & Metrics Change Management Disputes Prevention Implementation of CII Research Lessons Learned Quality Management
 Definition of Benchmarking and Metrics The systematic process of measuring performance against recognized leaders to determine best practices that lead to superior performance. Initial Application Engineering Conceptual & Front End Planning Basic Detail Procurement Construction Startup & Commissioning Operations
 Benchmarking Implementation Toolkit, IR BMM-2 • Introduces the CII Benchmarking & Metrics Program • “What you measure you improve”
 Contractors Domestic 839 (45%) 1, 514 (80%) 1, 882") CII Database International 368 (80%) Contractors Domestic 839 (45%) 1, 514 (80%) 1, 882 projects Worth > $98 Billion Large & Small Projects Combined Owners 1, 043 (55%)
CII Database International 368 (80%) Contractors Domestic 839 (45%) 1, 514 (80%) 1, 882 projects Worth > $98 Billion Large & Small Projects Combined Owners 1, 043 (55%)
 CII Standard Metrics Performance • Cost Performance • Schedule Performance • Safety Performance • Change Performance • Rework Performance • Construction Productivity • Engineering Productivity Practice Use • Front-End Planning • Alignment • Team Building • Partnering • Project Risk Management • Change Management • Constructability • Zero Accident Techniques • Planning for Startup • Proj. Delivery & Contract Systems • Benchmarking 167
 CII Benchmarking Process Three-step Process Online Questionnaire CII Benchmarking Database Data Mining and Reporting Engine 168
 Available Tools • Data Mining Capability
 Online Data Mining
 • Construction Productivity (1 Number)") Project-Level Productivity • Engineering Productivity (1 Number) • Construction Productivity (1 Number)
Project-Level Productivity • Engineering Productivity (1 Number) • Construction Productivity (1 Number)
 Piping Construction Productivity Results 172
 1 Q") Project-Level Productivity Example • 11% Improvement (2 nd to 1 st Quartile) 1 Q Good 2 Q 3 Q 4 Q Poor • 26% Improvement (4 th to 1 st Quartile) 173
Project-Level Productivity Example • 11% Improvement (2 nd to 1 st Quartile) 1 Q Good 2 Q 3 Q 4 Q Poor • 26% Improvement (4 th to 1 st Quartile) 173
 Industry Sector-Specific Metrics • Current – – – Pharmaceutical D/S Oil & Gas COAA (Contract) U/S Oil & Gas Healthcare Facilities • Future – (Nuclear) Power – Aviation Facilities
 Benchmarking Results Key Report
 Benefits of CII Benchmarking and Metrics • Builds a performance culture. • Highlights strengths and weakness. • Allows focus on improvement where needed without wasting scarce resources. • Avoids making mistakes in project implementation. • Organizational level benchmarking yields positive bottom line. • Provides understanding & focus on most effective practices for greater bottom-line impacts.
 CII Benchmarking is Compelling • Provides information not available elsewhere • Provides source of analysis to drive improvement – Integrates with other data sources – Industry-level analysis – Measurement of best practices • Provides multiple perspectives of performance • Quantifies Value • Confidential 177
 Cost Change Factor =") Performance Metrics Better (Cost Change Factor vs. Project Cost Growth) Cost Change Factor = Cost of All Changes/Final Cost of Project
Performance Metrics Better (Cost Change Factor vs. Project Cost Growth) Cost Change Factor = Cost of All Changes/Final Cost of Project
 CII Benchmarking Safety Results 12 Sharp Reduction In Recordable Injuries 10 TRIR 8 Quartile 4 6 Quartile 3 4 Quartile 2 Quartile 1 2 0 1996 -2002 (n=400) 2003 -2008 (n=284) Owner Zero Recordable Injuries In Quartiles 1 & 2 1996 -2002 (n=341) 2003 -2008 (n=147) Contractor
 Proven Results From Benchmarking Efforts Pharmaceutical and Biotechnology Owners Benchmarking Program Cost Performance (6% Less) Schedule Performance (26% Less) 180
 Member Database CII Database Project") Automated Data Entry • Benchmark ALL your projects (unlimited) Member Database CII Database Project Data & Performance Results
Automated Data Entry • Benchmark ALL your projects (unlimited) Member Database CII Database Project Data & Performance Results
 Jacobs Performance Management System Data Sources Data Entry Internal BM CII BM Member Database CII Database Project Data & Performance Results 182
 CII Implementation Resources Benchmarking Metrics Committee Dr. Stephen Mulva Associate Director stephen. mulva@mail. utexas. edu Dr. Jason Dai Research Engineer jiukun. dai@engr. utexas. edu Hong Zhao Sytems Analyst hong. zhao@engr. utexas. edu
, Tier 2 Questionnaire") CII Next. Gen Benchmarking System • Tier 1 (80% less questions), Tier 2 Questionnaire • Internal (Business Unit, Product Line) Benchmarks • Instant Feedback with Monthly Quartile Updates • Automated Data Entry (XML) • Worldwide University-Based Performance Assessment Labs (PAL’s) • CII Summer Intern Program 184
CII Next. Gen Benchmarking System • Tier 1 (80% less questions), Tier 2 Questionnaire • Internal (Business Unit, Product Line) Benchmarks • Instant Feedback with Monthly Quartile Updates • Automated Data Entry (XML) • Worldwide University-Based Performance Assessment Labs (PAL’s) • CII Summer Intern Program 184
 185") Dashboard – Donut Chart View (Your Company) 185
Dashboard – Donut Chart View (Your Company) 185
 Thank you for your attention! Manuel A. Garcia Associate Director Construction Industry Institute 3925 W. Braker Lane (R 4500) Austin, TX 78759 -5316 (512) 232 1966 mgarcia@cii. utexas. edu