9b994633aa9ab0378373a89d73367d83.ppt
- Количество слайдов: 77

 Chapter 8 - An Introduction to Asset Pricing Models
 Chapter 8 - An Introduction to Asset Pricing Models
 Chapter 8 - An Introduction to Asset Pricing Models
 Chapter 8 - An Introduction to Asset Pricing Models
 Chapter 8 - An Introduction to Asset Pricing Models
 Chapter 8 - An Introduction to Asset Pricing Models


 Because the returns for the risk free asset are certain, Consequently, the covariance of the risk-free asset with any risky asset or portfolio will always equal zero. Similarly the correlation between any risky asset and the risk-free asset would be zero.
 This is a linear relationship
 Substituting the risk-free asset for Security 1, and the risky asset for Security 2, this formula would become Since we know that the variance of the risk-free asset is zero and the correlation between the risk-free asset and any risky asset i is zero we can adjust the formula
 the standard deviation is Therefore, the standard deviation of a portfolio that combines the risk-free asset with risky assets is the linear proportion of the standard deviation of the risky asset portfolio.

 Exhibit 8. 1 M C RFR A B D

 orr B ing nd Le RFR M o ing w ML C Exhibit 8. 2


 Risk Total Risk Systematic Risk") Standard Deviation of Return Exhibit 8. 3 Unsystematic (diversifiable) Risk Total Risk Systematic Risk Standard Deviation of the Market Portfolio (systematic risk) Number of Stocks in the Portfolio
Standard Deviation of Return Exhibit 8. 3 Unsystematic (diversifiable) Risk Total Risk Systematic Risk Standard Deviation of the Market Portfolio (systematic risk) Number of Stocks in the Portfolio


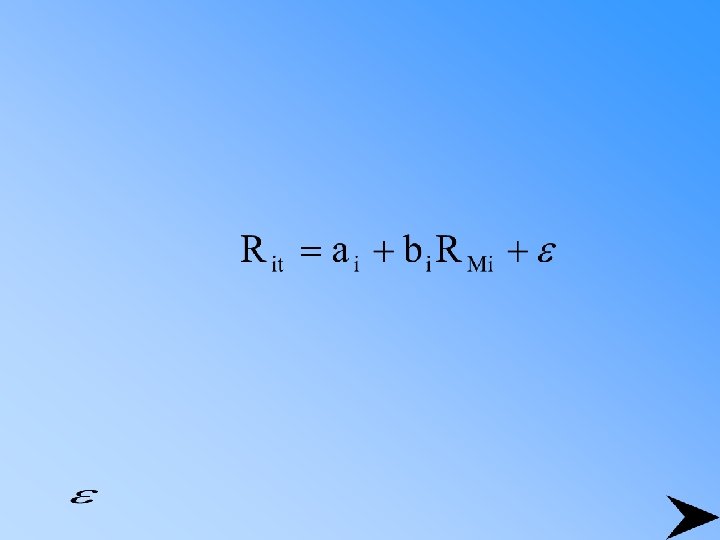
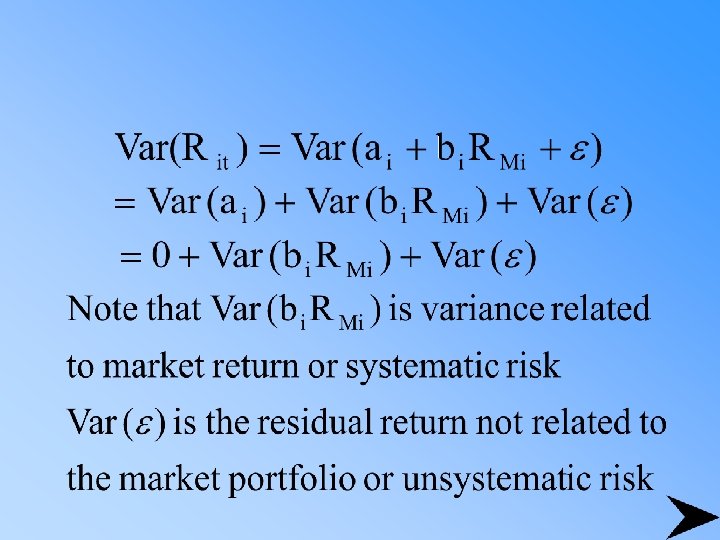


 Exhibit 8. 5 SML RFR
 We then define as beta
 Exhibit 8. 6 SML Negative Beta RFR
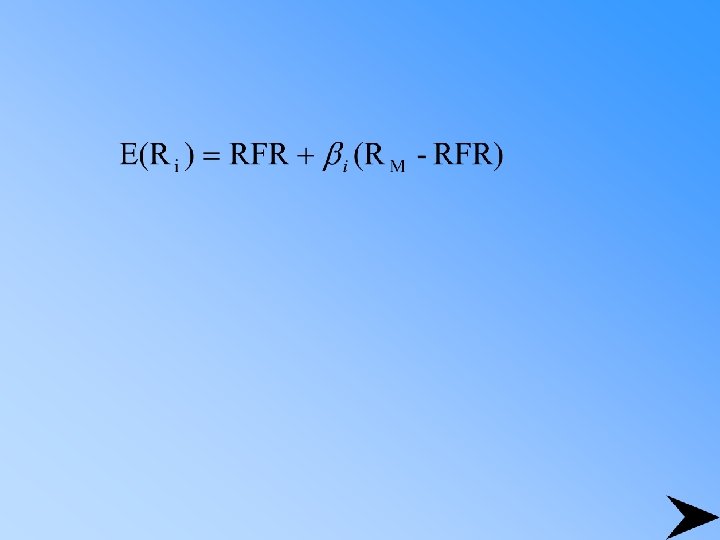
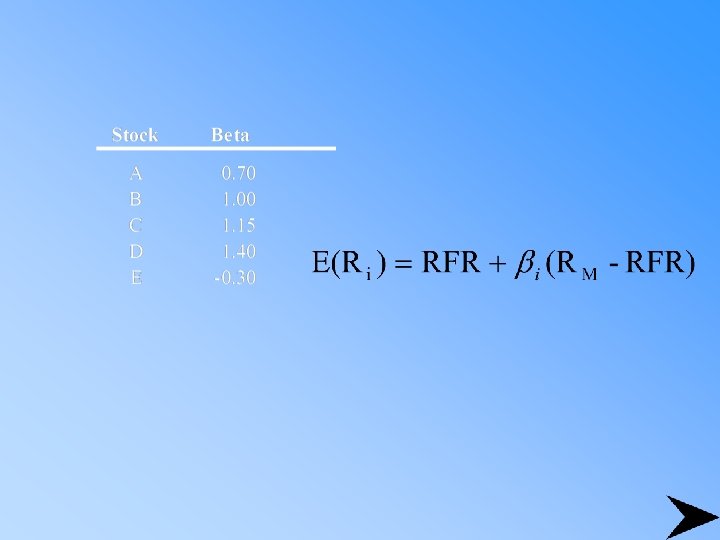


 Exhibit 8. 7
 Exhibit 8. 8
 Exhibit 8. 9 C E SML A B D

 The characteristic line is the regression line of the best fit through a scatter plot of rates of return Exhibit 8. 10