

30bc062882e70928e459aefaa76b75fe.ppt
- Количество слайдов: 60
 Chapter 4 Supercritical Fluids Extraction From Solids-II
 Course of the extraction process Remaining extract in feed Accumulated extract in sc solvent Composition of extract changes with conditions of extraction and time
 Theobromine Caffeine
 Decaffeination of green coffee beans Lack and Seidlitz 1993
 Decaffeination of green coffee beans Lack and Seidlitz 1993
 Flow scheme of decaffeination plant Schoeller-Bleckmann design Lack and Seidlitz 1993
 Comparison of extraction behaviour Zwiefelhofer 1990
 Composition of liquid CO 2 hop extract Gardner 1993
 Fat extraction from cocoa 1: Liquor, 40 MPa, 80 o. C, 5 h 2: Liquor, 40 MPa, 50 o. C, 5 h 3: Nibs, 40 MPa, 80 o. C, 5 h 4: Nibs, 40 MPa, 50 o. C, 5 h 5: Shells, 30 MPa, 80 o. C, 6 h Rossi et al. , 1989
 Standard design Extractor Heat exchanger Precipitator Cycle gas compressor
 Total number of pressure vessels for SFE Gehrig 1998
 Economy of scale: CO 2 -extraction from solids
 Extraction of Buriti Franca, Reber, Meireles, Machado, Brunner, J. Supercritical Fluids 1998
 Extraction of Buriti Carotene Franca, Reber, Meireles, Machado, Brunner, J. Supercritical Fluids 1998
 Arachidonic acid from fermentation Arachidonic acid as methylester extracted from dried filter cake g. AAE / gcake g CO 2 / g cake
 Extraction of meat products Effect of varying pressure on the accumulated yield of lipid( left ) and water (right) extracted with supercritical CO 2 at 50 o. C R. R. Chao, 1996
 Extraction of beef tallow Cumulative weight of beef tallow extracted by CO 2 varying the pressure and temperature R. R. Chao et al. , 1993
 Extraction of beef tallow Cholesterol concentration in extract sc. CO 2 R. R. Chao et al. , 1993 Lipid and cholesterol extract from beef tallow. CO 2 and CO 2 - ethanol
 Extraction of oil from chips Percent oil removed as a function of volume of CO 2. Feed: Type I: unsalted, Type II: x salted. Extraction P = 408 +/- 6. 8 bar, T = 55 +/- 1 o. C. Separation: P 2 bar; T = 30 +/-3 o. C. S. Vijayan et al. , 1994 Brunner XVII CBCTA - Fortaleza 2000 19
 Extraction of mustard seed oils 300 bar, 40 o. C total amount oil water myrosinase activity Taniguchi et al. 1987
 Extraction of oil from peanuts CO 2 25 o. C Goodrum 1996
 93 183") Extraction of theobromine from cocoa seed shells 50 kg. CO 2/(kg. Fh) 93 183 304 Simon 1990
Extraction of theobromine from cocoa seed shells 50 kg. CO 2/(kg. Fh) 93 183 304 Simon 1990
 Cleaning of Soil Course of an extraction of hydrocarbon contaminants rom soil with supercritical water.
 SCWO of extracted organic waste from soil Temperature Loading Residence O 2 excess Degree of time conversion U __________________________________ [°C] [ghc/LH 2 O] [s] [mol O 2/ mohc-mhc)/ mhc mol O 2, min] __________________________________ 290 6. 7 135 1. 68 0. 963 0. 7 107 26 3. 0 68 6. 99 0. 9376 330 0. 999998 385 Reaction results at 25 MPa, 88 cm 3 reactor
![Vergleich TOC nach Extraktionen Unterschiedliche Behandlungsmethoden des CND- Bodens: TOC [g C/kg TS] Wasser](https://present5.com/presentation/30bc062882e70928e459aefaa76b75fe/image-26.jpg "Vergleich TOC nach Extraktionen Unterschiedliche Behandlungsmethoden des CND- Bodens: TOC [g C/kg TS] Wasser") Vergleich TOC nach Extraktionen Unterschiedliche Behandlungsmethoden des CND- Bodens: TOC [g C/kg TS] Wasser ist org. Lösemitteln überlegen
Vergleich TOC nach Extraktionen Unterschiedliche Behandlungsmethoden des CND- Bodens: TOC [g C/kg TS] Wasser ist org. Lösemitteln überlegen
 Kontaminationsverteilung als Schicht am Rand als Kohlenwasserstoffpartikel in den Poren adsorbiert im Innern gelöst
 Festbettextraktionsanlage
 Kontinuierlicher Rohrreaktor c a b d g f e Flow sheme of continuous extaction apparatus: Fließbild der kombinierten Anlage: a Vorlagebehälter mit Rührwerk, b Pufferautoklav, c Wirbelbettheizer -Vorwärmer- d Extraktionsstrecke, e Elektrolysezelle im Schutzbehälter, f Doppelrohrwärmetauscher, g Sammelgefäß, h Gasanalysegerät, i evakuierter Glasbehälter a magnetic stirrer, b membrane pump, c feed vessel, d buffer vessel, e pump, f preheater (28 ml), g extraction pipe (38 ml), h cooler, i flask, j CO 2 -meter, k evacuated glas vessel.
 Kontamination (Schluff) kann mit Wasser vollständig gereinigt werden.") Lösungsmittelvergleich Realgealterte (20 Jahre) Kontamination (Schluff) kann mit Wasser vollständig gereinigt werden.
Lösungsmittelvergleich Realgealterte (20 Jahre) Kontamination (Schluff) kann mit Wasser vollständig gereinigt werden.
 Transportmechanismen • Porendiffusion aus Mikro- in Mesoporen • Diffusion im Porenfluid oder Lösungsmittel • Stofftransport durch Strömungsgrenzschicht • konvektiver Stofftransport mit Lösungsmittelstrom
 Modellierung Extraktion Kontamination am Feststoff Auflösung als Reaktion 1. Ordnung Partikelporen Fluidphase Strömungsform durch e, b berücksichtigen
 Modellierungsergebnisse • Suspension als Strähne/Einzelkorn betrachtet • Dodecan bildet Bezug
 Simulation der Extraktion P = 24 MPa T = 381 - 389°C P = 24 MPa T = 361 - 381°C Modellierungsparameter zur Simulation geeignet
 Biologische Abbaubarkeit Beurteilung der biologischen Abbaubarkeit mittels akkumulierten Sauerstoffverbrauchs von Belebtschlamm Bruchteil von CSB° wird erreicht
 Vergleich mit Essigsäure P = 25 MPa Extraktionsvermögen liegt im Bereich niedrigerer Temperaturen in Abhängigkeit von der Verweilzeit im Bereich von Essigsäure Zugabe von Essigsäure zur Einstellung des p. H-Wertes
 Langes Spülen bewirkt Reinigung Trotz relativ hoher Verweilzeit Reinigung nicht") Extraktion der KWSt. (Mischkontamination) Langes Spülen bewirkt Reinigung Trotz relativ hoher Verweilzeit Reinigung nicht vollständig, trotz nahe-/ überkritischen Bedingungen Bezug: 60. 000 mg/kg (40. 000 mg/kg)
Extraktion der KWSt. (Mischkontamination) Langes Spülen bewirkt Reinigung Trotz relativ hoher Verweilzeit Reinigung nicht vollständig, trotz nahe-/ überkritischen Bedingungen Bezug: 60. 000 mg/kg (40. 000 mg/kg)
 Lowering p. H by dissolution of CO 2 in H 2 O Calculated p. H-value of water for carbon dioxide saturated solutions at a pressure of 25 MPa. Equilibrium data from Wiebe (1941), Takenouchi (1964)
 Solubilities of real hydrocarbon contaminations in water Water in lubricating oil Ethylbenzene Dimethylcyclohexane Real weathered extracted contamination Nowak 1995
 Phase equilibrium: Hydrocarbons in carbon dioxide G. M. Schneider
 Solubility of n-decane in water
 CO 2 - H 2 O Toews et al. , 1995 Abgeschätzter p. H-Wert für Kohlensäure, 1. Dissoziationsstufe
 Biopolymers: Acid catalysis The solubility of carbon dioxide in liquid water
 CO 2 - H 2 O Takenouchi und Kennedy, 1964 Löslichkeiten von CO 2 in Wasser
 CO 2 - H 2 O Wiebe und Gaddy, 1940, Wiebe, 1941 Gleichgewichtslöslichkeiten von CO 2 in Wasser
 Remediation II Incentives: Unrestricted use of site Quantities: Site: 100 m x 100 m 2 m depth Remove risk for environment (water, air, persons, . . . ? 20 000 m 3 40 000 t
 Degree of extraction, % Soil extraction with carbon dioxide Artificially contaminated Real contamination, weathered Solvent ratio kg CO 2 / kg soil
 Soil extraction Degree of extraction, % Comparison of CO 2 and H 2 O Solvent ratio kg CO 2 / kg soil
 Vergleich mit Essigsäure P = 25 MPa Extraktionsvermögen liegt im Bereich niedrigerer Temperaturen in Abhängigkeit von der Verweilzeit im Bereich von Essigsäure Zugabe von Essigsäure zur Einstellung des p. H-Wertes
 Soil Remediation Method
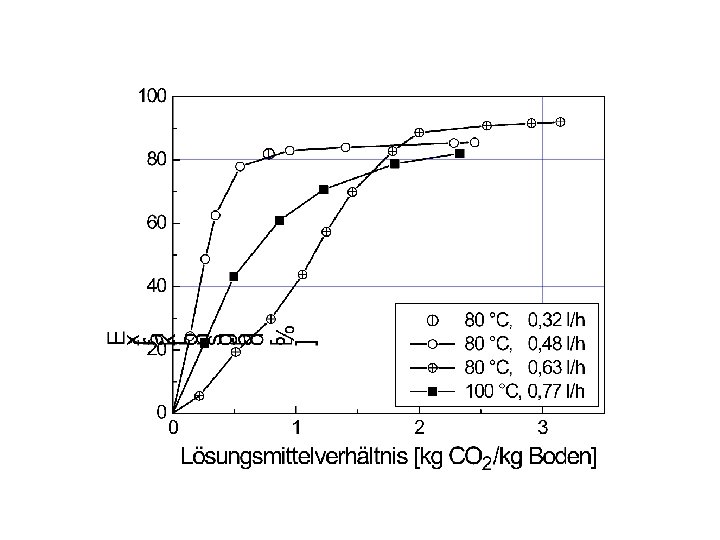
 Figure 10: Flow sheme of continuous extaction apparatus: Fließbild der kombinierten Anlage: a Vorlagebehälter mit Rührwerk, b Pufferautoklav, c Wirbelbettheizer -Vorwärmer- d Extraktionsstrecke, e Elektrolysezelle im Schutzbehälter, f Doppelrohrwärmetauscher, g Sammelgefäß, h Gasanalysegerät, i evakuierter Glasbehälter a magnetic stirrer, b feed vessel, c membrane pump, d buffer vessel, e , f preheater (28 ml), g extraction pipe (38 ml), h cooler, i flask, j CO 2 meter, k evacuated glas vessel.
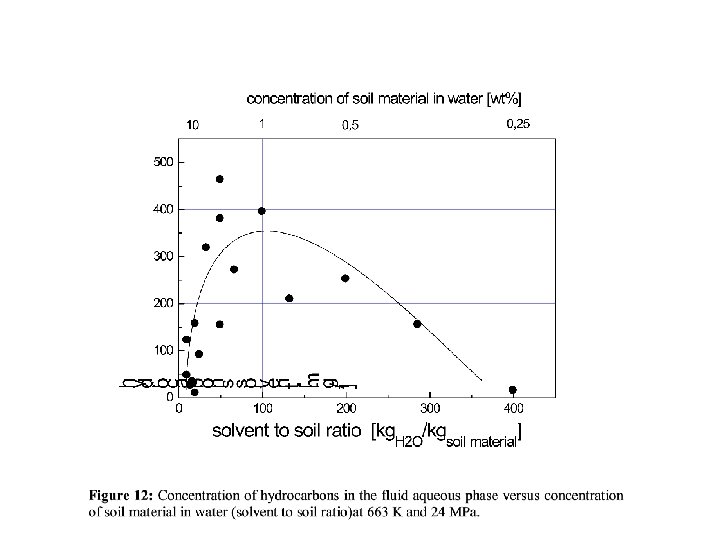
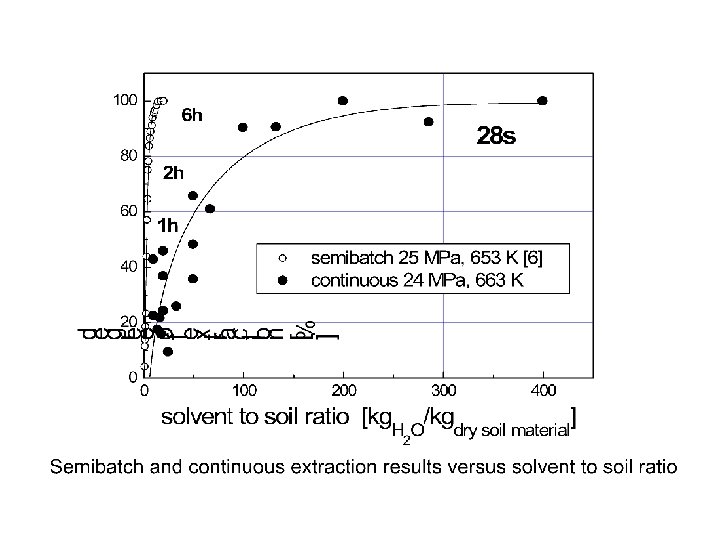
 Figure 13: Degree of extraction in dependence on the amount of soil material in the solvent (solvent to soil ratio). This diagram corresponds to the left branch of Fig. 12, i. e. up to solvent to soil ratios of 100. T = 663 K, P = 24 MPa, residence time: 28 s.
 Figure 17: Degree of extraction for antimony. P = 25 MPa, material “GKSS”.
 Soil Remediation Modelling