

29f9d8941a05f04f0664c1eda7b26761.ppt
- Количество слайдов: 82
 Chapter 4 C, N, S, P and Water cycle in Ecosystems 生态系统的C、N、S、P 和H 2 O循环 阮宏华 南 京 林 业大 学
 提高生物生产力 n N、P、K 等是生长的限制因子
 Environmental Problems 环境问题 n n n Global warming 全球变暖 n CO 2、CH 4、N 2 O Acid deposition 酸沉降 n NO 3、SO 4 Eutrophication 富营养化 n N、P
 Flux 通量 Reservoirs 儲存庫
 n Living organisms as a group contain the six major nutrients in the proportions: H 2 O : O 2: C: N: P: S= 3000: 1500: 16: 2: 1
 Carbon Cycling 1. Carbon cycle is of central interest to biogeochemist • Living tissue is primarily composed of carbon. • The fixation of C by plants through geologic time accounts for O 2 in our present atmosphere, through oxidation and reduction, the cycles of other elements are closely tied to the global cycles of C and O 2. • Carbon is associated with global warming through the greenhouse effect. (Schlesinger, 1991)
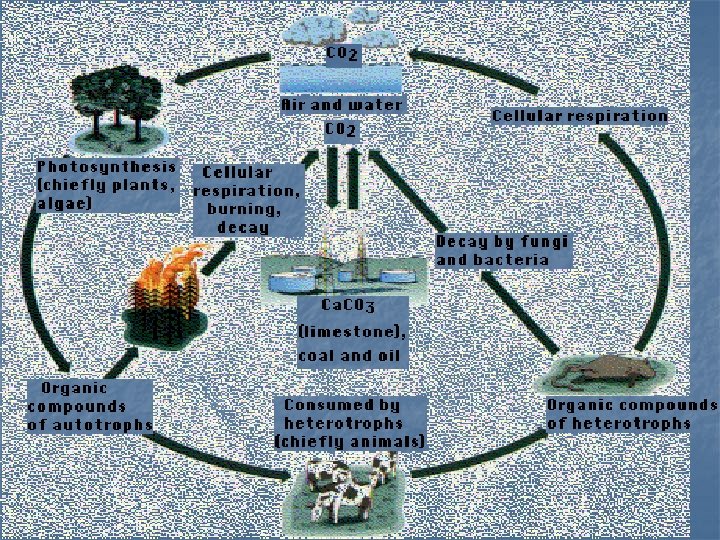
 2. Carbon with mainly gaseous Cycles Atmosphere CO 2 Photosynthesis processes Decomposition
 Carbon cycles 碳循環 Internal cycling
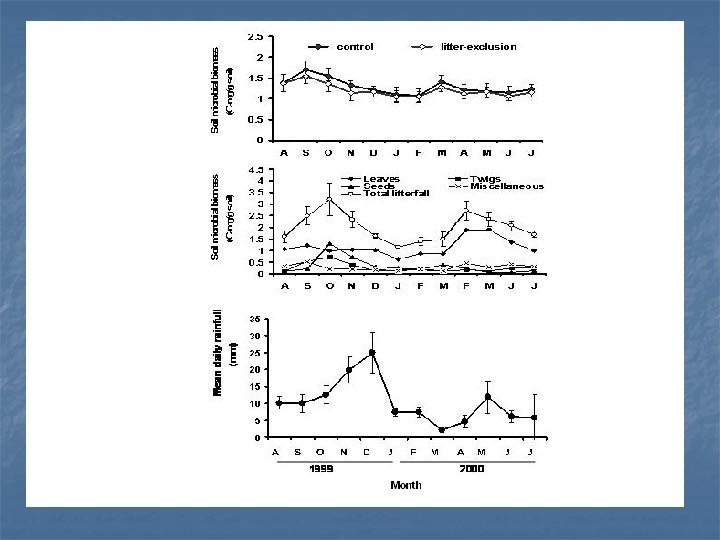
 Climate factors 2) Litter quality 3) Biota") Decomposition rate is controlling by : 1) Climate factors 2) Litter quality 3) Biota
Decomposition rate is controlling by : 1) Climate factors 2) Litter quality 3) Biota
 Litter -exclusion reduced significantly leaf litter decomposition for both upland riparian site, but more profound in upland site Soil fauna play a very important role in litter decomposition
 CARBON CYCLE
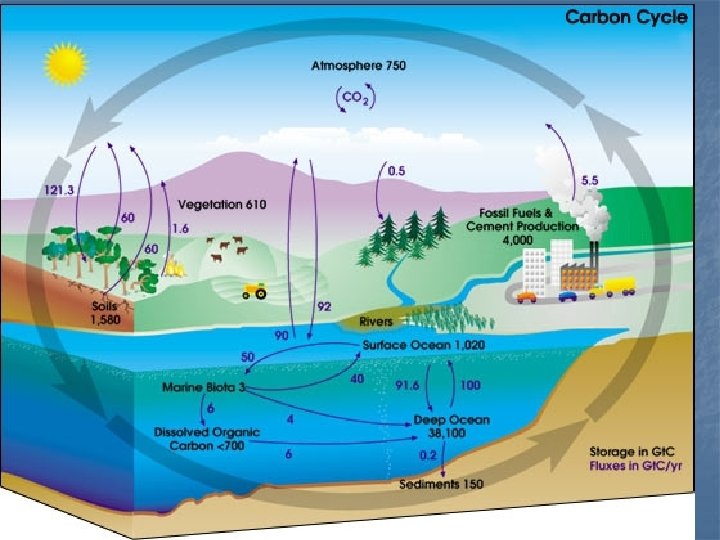
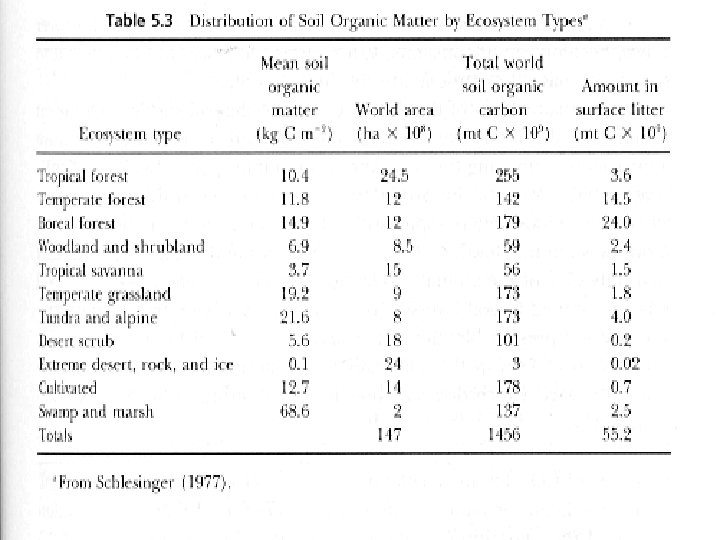
. Small changes in soil C") n 3. Soil C is of largest pool (Gigatons). Small changes in soil C may yield large fluctuation on atmospheric carbon. Fossil fuel Oxidation Atmosphere 720 Diffusion Ocean 38, 000 Photosynthesis Decomposition Respiration Biomass 560 Litter Decomposition Respiration Soil 1, 200 -1, 600
n 3. Soil C is of largest pool (Gigatons). Small changes in soil C may yield large fluctuation on atmospheric carbon. Fossil fuel Oxidation Atmosphere 720 Diffusion Ocean 38, 000 Photosynthesis Decomposition Respiration Biomass 560 Litter Decomposition Respiration Soil 1, 200 -1, 600
 4. Our current understanding of the C cycle is incomplete. At least, 1 -2 billion tons of C are lost from our accounting each year (IPCC, 1995) Net emission = Net change in the carbon pools ( 10 15 g C/yr. ) Fossil fuel 5± 0. 5 Land use + changes 1. 6± 1. 0 Atmosphere Unknown Oceanic = increase + uptake + sink 3. 3± 0. 2 1. 3± 1. 5 2. 0± 0. 8 ? The unknown sink C is not ocean (Kern, 1992) and is likely within the terrestrial ecosystem(Tans et al. , 1990
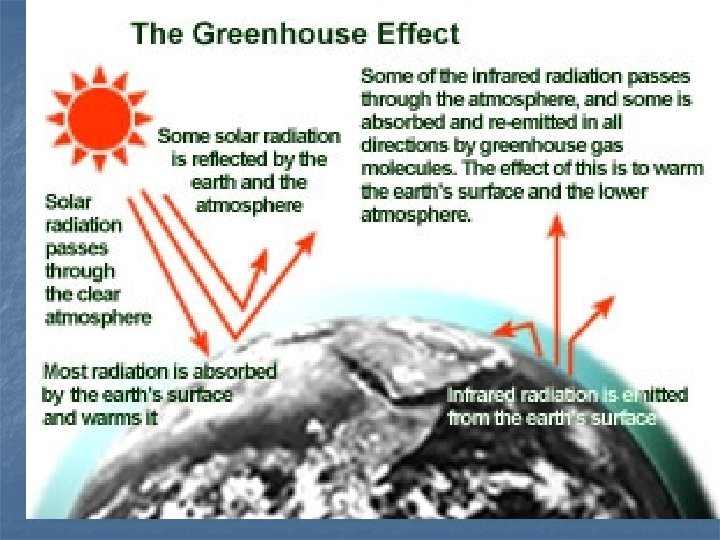
 4. CO 2 associated with greenhouse effect
 Global Carbon Cycle n n n Photosynthesis n CO 2 + H 2 O > (CH 2 O) + O 2 Decomposition n (CH 2 O) + O 2 > CO 2 + H 2 O n (CH 2 O) + H 2 O > CO 2 + 4 H+ + 4 e. Carbonated oceans n CO 2 + H 2 O > HCO 3 - + H+ Carbonation n HCO 3 - + Ca 2+ > Ca. CO 3 + H+ Methanogenesis n CO 2 H 2 O + 8 H+ + 8 e- > CH 4 + 2 H 2 O n CH 3 COO- + H+ > CO 2 + CH 4
 Global Carbon Cycle n Pools n n n n Atmosphere 750 x 10^15 g Ocean water 38, 000 x 10^15 g Plant biomass 560 x 10^15 g Soil organic matter and soil biomass 1, 500 x 10^15 g Total active pool: 40, 000 x 10^15 Organic sediments 1. 56 x 10^22 g Inorganic sediments 6. 5 x 10^22 g
 Global Carbon Cycle n Fluxes n n n n Terrestrial GPP 120 x 10^15 g/y Ocean GPP 92 x 10^15 g/y Terrestrial Rp 60 x 10^15 g/y Terrestrial Rd 60 x 10^15 g/y Deforestation 0. 9 x 10^15 g/y Anthropogenic 6 x 10^15 g/y Ocean R 90 x 10^15 g/y River flow 0. 8 x 10^15 g/y
 Global Carbon Cycle n Turnover Time/Residence time Atmosphere: 750/152 = 4. 9 years n Plant biomass: 560/60 = 9. 3 years n Soil organic C: 1500/60 = 25 years n Surface ocean: 1020/90 = 11. 3 years n Entire ocean: 3800/90 = 422 n
 Stream gage near El Verde Research Station, Luquillo Experimental Forest TLER site, Puerto Rico (Photo: Charles A. Simenstad).
 Catchments
 n Weir used to measure stream discharge continuously. Coweeta Hydrological Laboratory researchers have guaged streamflows from 31 drainages within the 2, 185 -hectacre Coweeta basin for varying lengths of time (photographer unknown).
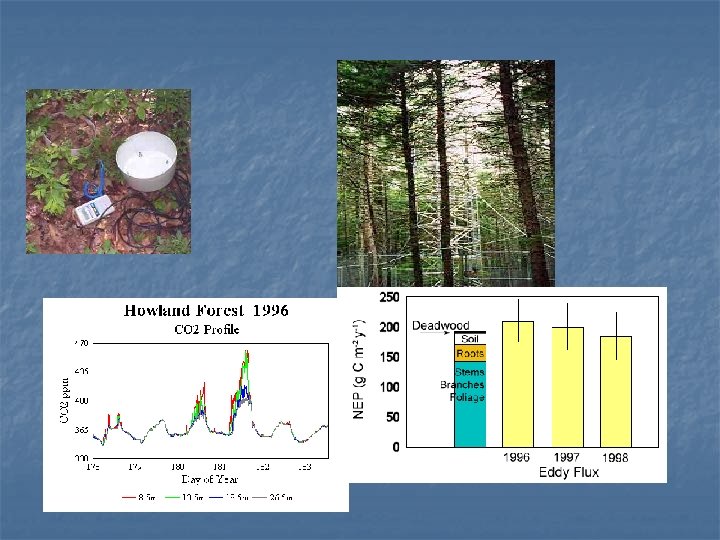
 n Automated sampler system used to measure soil and tree stem carbon flux
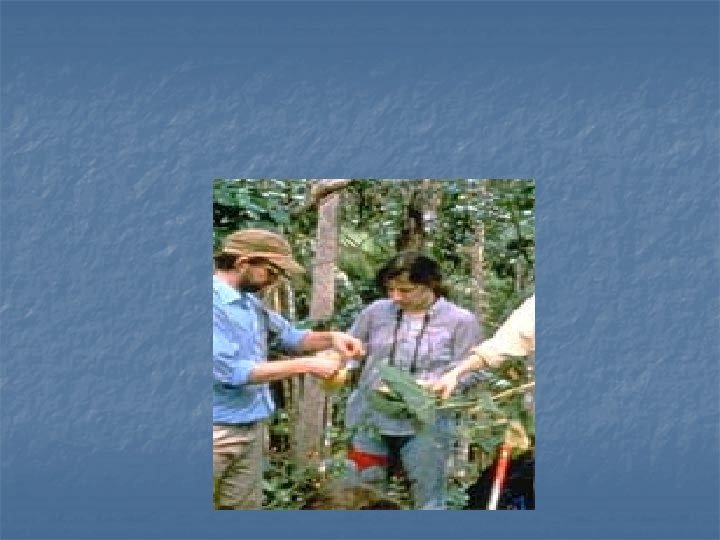
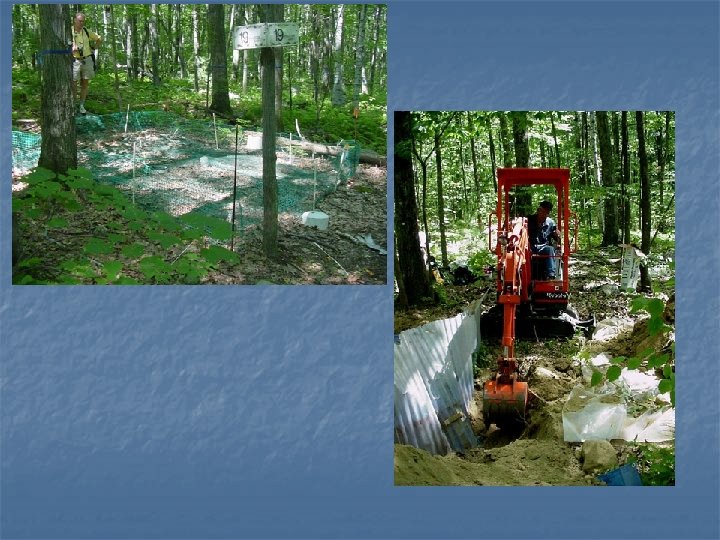
 n Litter exclusion study, Watershed 55, Coweeta Hydrologic Laboratory LTER Site. A long-term, whole-stream experiment at Coweetal LTER site. This study involves excluding all litter inputs to a 70 -m stream, as well as removing all sticks and logs rom the stream. Plastic piping was added in summer 2000 to simulate the structural role of wood (results TBD). So far, results show that animals living in this stream depend on organic inputs from the forest. After several years of leaf exclusion, animals were almost completely absent from the stream. This study also shows that the absense of organic matter affects many ecosystem processes including dissolved organic carbon transport, sediment retention, dissolved nutrient retention, microbial processes, and stream metabolism. The instrument is a conductivity meter. Here, grad students Matt Mc. Tammany and Chelsea Crenshaw monitor the flow of phosphorus into the stream while Dr. Jack Webster draws samples.
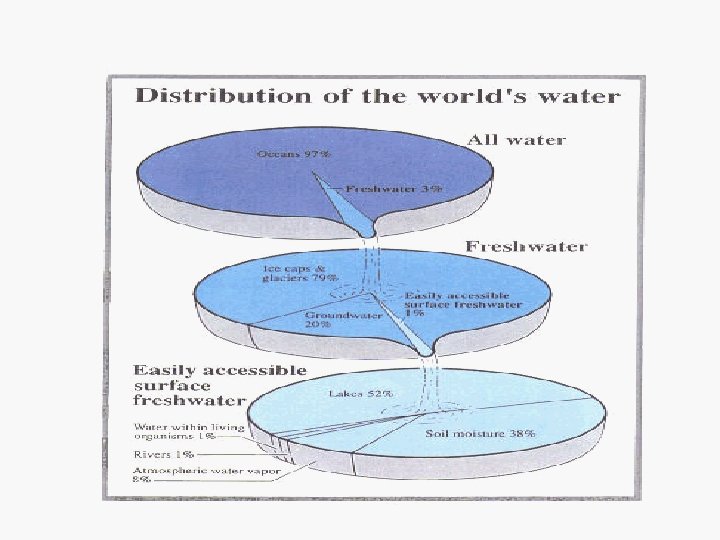
 Water cycles
 水分大循环: 在陆地与海洋间的循环. 水分小循环: 在植被与陆地间的循环.
 oxygen cycles n 來源 n n n 儲存庫 n n H 2 O H 2 + O 2 光合作用 大氣 (石油之存在表示曾累積 O 2,約為現 今的 15倍 ) H 2 O, CO 2 氧化物:Ca. CO 3, HNO 3, HSO 4, Fe 2 O 3 消耗 n 呼吸作用
 Ozone dynamics n n n 具雙重作用的氣體 n 在 stratosphere平流層,阻擋 UV n O 2 O + O 2 O 3 n 在 troposphere對流層,為污染物 與人造及自然產物反應減少臭氧 n CFC Cl. O, 分解 O 3 n CH 4, NO 2 (denitrification, fertilizer) 對流層反應 n photochemical smog: N 2 O + O CH 3 CHO + peroxacetylnitrate (PAN) + C 2 H 5 CHO n O 3 氣孔 葉銹斑,光合速率下降,葉 片養分下降,易受蟲害 n PAN 影響植物代謝、生長
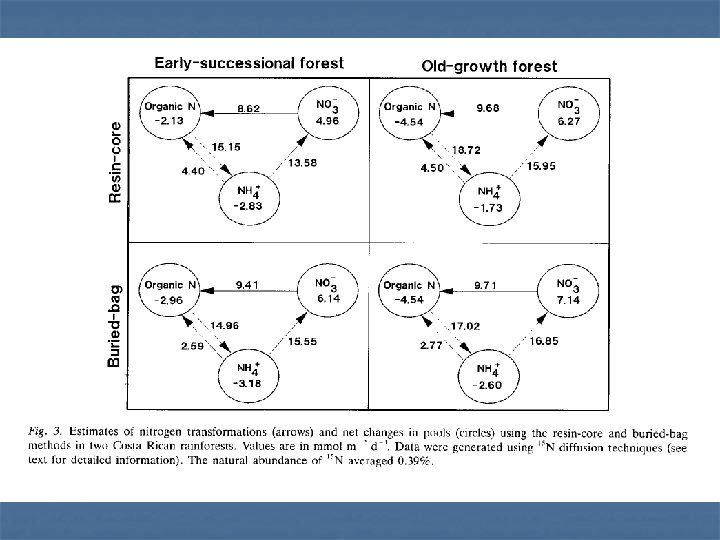
 Nitrogen cycle
 NH 3 植物吸收") Nitrogen cycles n Fixation n Ammonification n n 死的有機質 (amino acids) NH 3 植物吸收 Nitrification n High energy fixation (8. 9 Kg/ha: 2/3 NH 3, 1/3 HNO 3) Biological fixation (N 2 NH 3, 100 -200 Kg/ha, 90%) n 耗能,固定 1 g N需要 10 g glucose n 共生根瘤菌、自生好氧菌、藍綠細菌、地衣 n 農業用 200種,自然界 12000種 NH 3 HNO 2 (nitrite) HNO 3 (nitrate) Nitrosomonas, Nitrobactor Denitrification n HNO 3 N 2 by fungi and Pseudomonas
Nitrogen cycles n Fixation n Ammonification n n 死的有機質 (amino acids) NH 3 植物吸收 Nitrification n High energy fixation (8. 9 Kg/ha: 2/3 NH 3, 1/3 HNO 3) Biological fixation (N 2 NH 3, 100 -200 Kg/ha, 90%) n 耗能,固定 1 g N需要 10 g glucose n 共生根瘤菌、自生好氧菌、藍綠細菌、地衣 n 農業用 200種,自然界 12000種 NH 3 HNO 2 (nitrite) HNO 3 (nitrate) Nitrosomonas, Nitrobactor Denitrification n HNO 3 N 2 by fungi and Pseudomonas
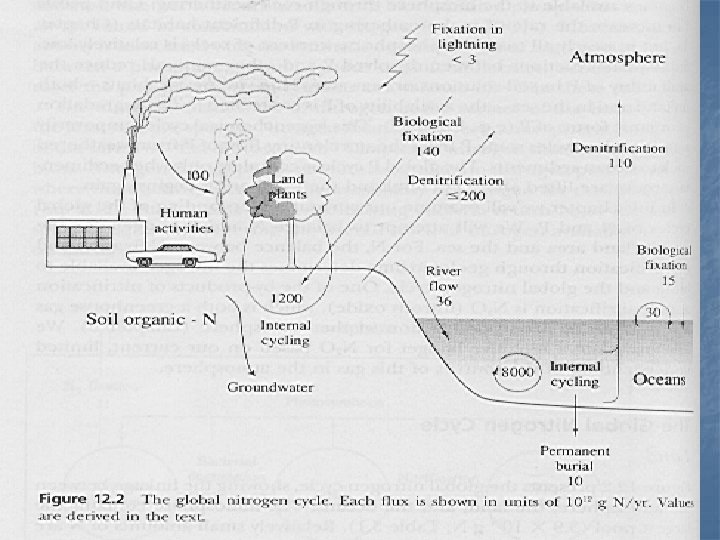
 Nitrogen n Pools Atmosphere 2. 9 x 10^21 g n Land biomass 3. 5 x 10^15 n SOM 95 -140 x 10^15 n Ocean biomass 530 x 10^15 n Ocean inorganic 640 x 10^15 n Ocean sediments 2 x 10^21 n
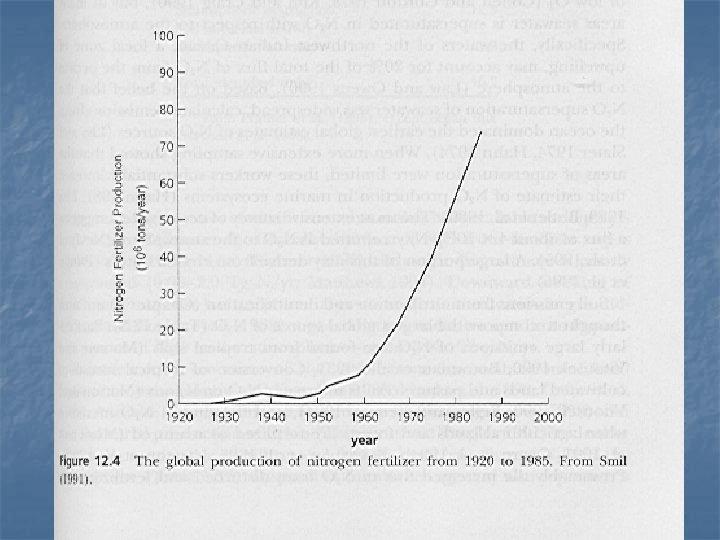
 Nitrogen n Fluxes n Input to land n n Output to atmosphere n n n N fixation through lightening 0. 8 x 10^12 g/yr Biological N fixation 140 x 10^12 Fertilizer 100 x 10^12 Denitrification from land 200 x 10^12 Denitrification from ocean 110 x 10^12 Input to ocean n River 36 x 10^12 Lightening 2. 2 x 10^12 Biological fixation 15 x 10^12
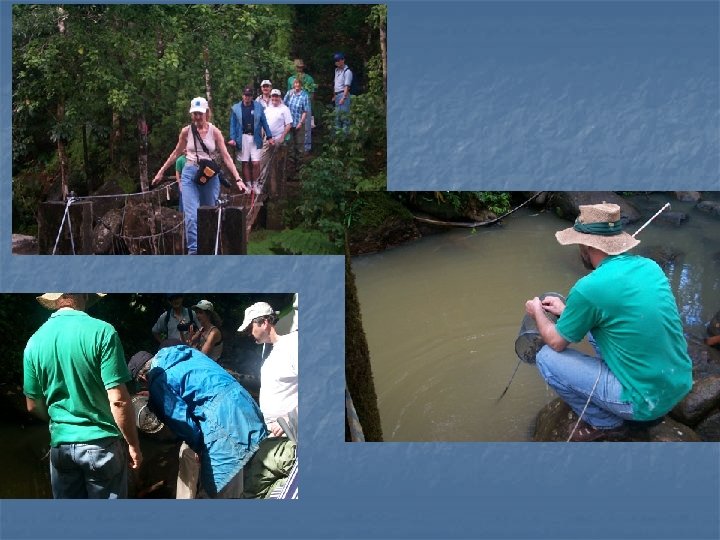
 n This experiment examines the mechanisms by which Nitrate is retained in headwater streams. We have sites at Coweeta Hydrologic Laboratory, Oak Ridge national Lab and in Northern New Mexico. These sites provide a gradient in in-stream (autochthonous) production, terrestrial litter (allochthonous) supply, shading, and annual hydrology. At each site we have two streams that differ with respect to the extent of groundwater -surface water interaction. To quantify nitrate retention we use 15 N-NO 3 (reactive tracer) + Na. Cl (conservative tracer) releases and measure the loss of nitrate relative to chloride over distance downstream. This permits us to calculate mean uptake lengths (distance traveled before biotic uptake by benthic microbes) and nitrate uptake rates (mg N/m 2/day). We also sample specific biotic compoartment of the benthos before and following the release to examine which or=ganisms are respoinsible for the initial uptake of NO 3. These include algae associated with rocks (periphyton), bryphytes, terrestrial roots, and bacteria and fungi associated with wood, leaves, and fine organic particles (FPOM). In conjunction with our nitrate experiments we measure bulk metabolic activity in the stream using an upstream - downstream oxygen mass balance approach so that we can assess the relationship between carbon and nitrogen dynamics. In order to determine the extent to which subsurface habitats (e. g. the hyporheic zone) contribute to respiration rates, we also incubate surficial benthic sediments (~3 cm deep) in closed recirculating metabolism chambers. By difference, we can then calculate the contribution of subsurface habitats. These photographs depict the metabolism chambers. The large blue tubs provide a flow though water bath to maintain consistent temperature in the chambers (the things that are in the tubs). Internal oxygen and temperature are continuously monitiored using data sondes (the tall things sticking out of the chambers) and the data is logged using a CR 10 x datalogger. Please let me know if this is an adequate description of our project. One thing they may be helpful in hindsight is a general statement regarding the projects intent. Briefly, we hypothesize that headwater streams are important sites in regulating nitrate retention across landscapes because they are a) streams are transport systems so retention processes, or lack there of, in these systems may be disproportionately important compared to other ecosystems, b) much of a stream networks length is in its headwaters, c) high surface area : volume ratios increase the ability of biological processes to influence nutrient concentrations, d) headwaters streams have been documented to support both aerobic and a variety of anaerobic processes (including denitrification).
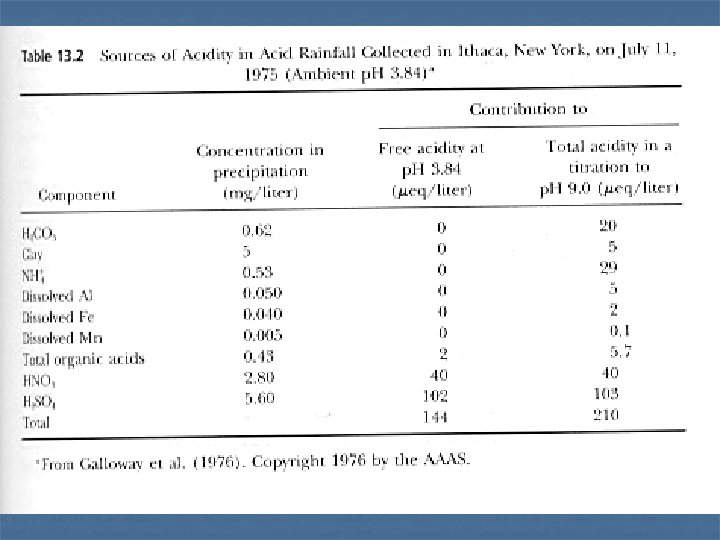
 Acid deposition酸沉降
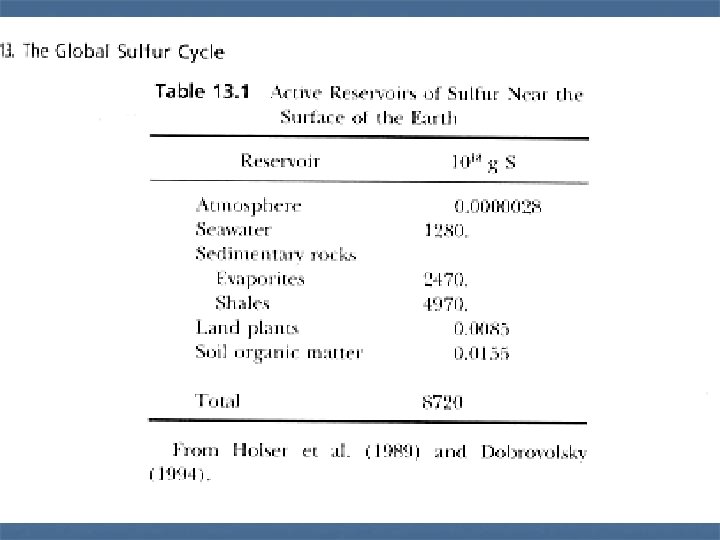
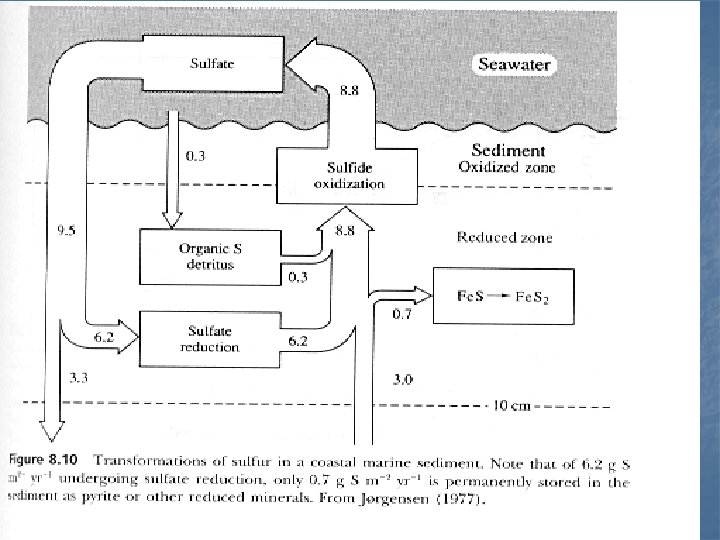
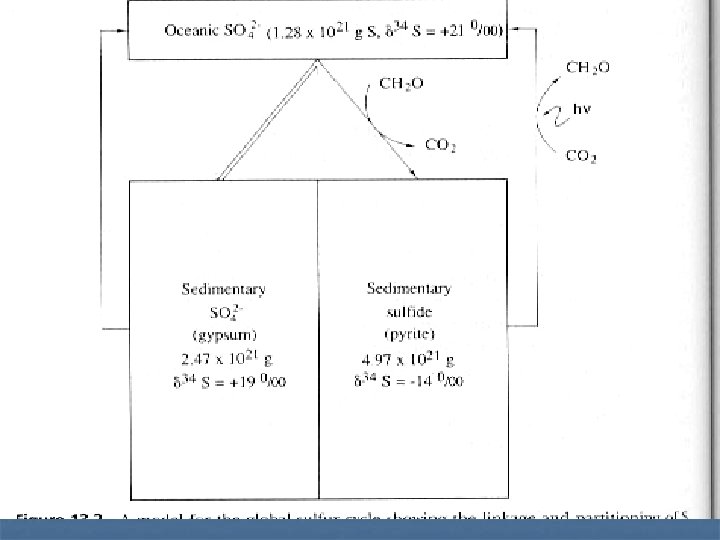
 Sulfur cycle
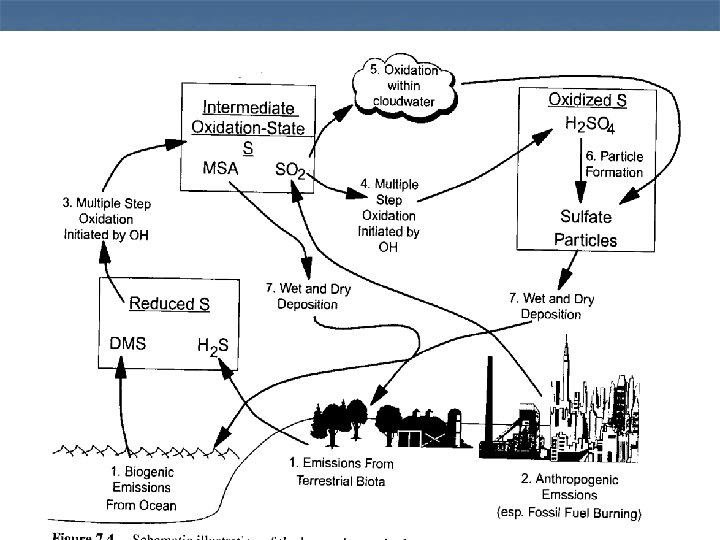
 Sulfur n Key biogeochemical reactions SO 42 - + “CH 2 O” + H > H 2 S + CO 2 +H 2 O n H 2 S + O 2 > SO 42 - + H n SO 42 - + Fe 2 O 3 (hematite) + “CH 2 O” + H > Fe. S 2(pyrite) + CO 2 + H 2 O n Fe. S 2 + H 2 O + O 2 > Fe 2 O 3 + SO 42 - + H n Ca + SO 42 - + H 2 O >< Ca SO 42 H 2 O(gypsum) n
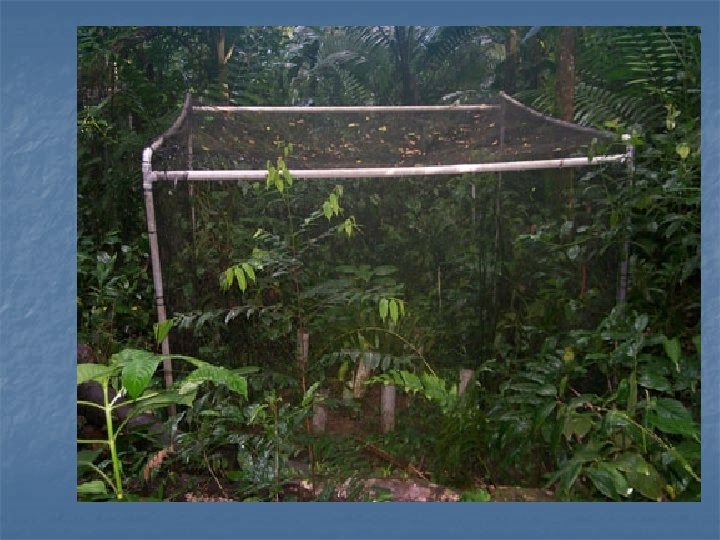
 n Precipitation collection equipment to analyze volume, chemistry and biogeochemstry cycling at Watershed 7, Coweeta Hydrologic Laboratory LTER Site.
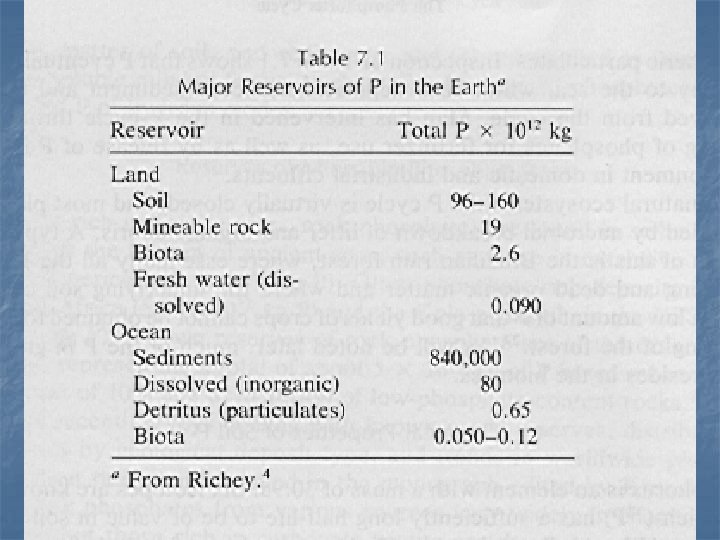
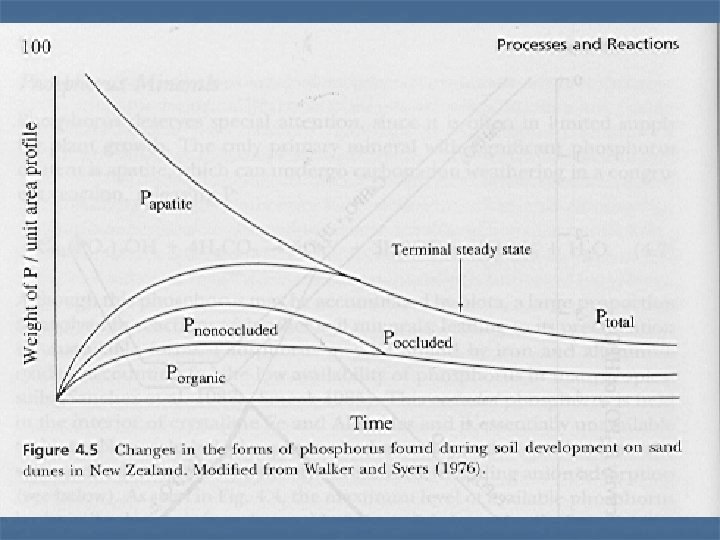
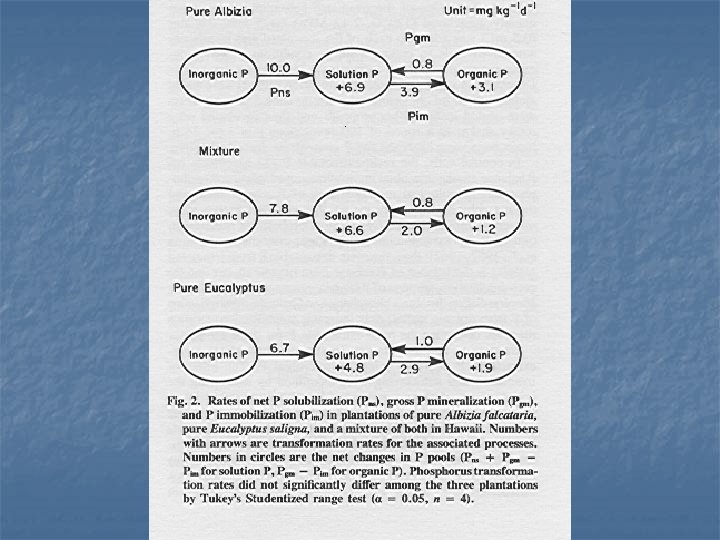
 phosphorus cycle
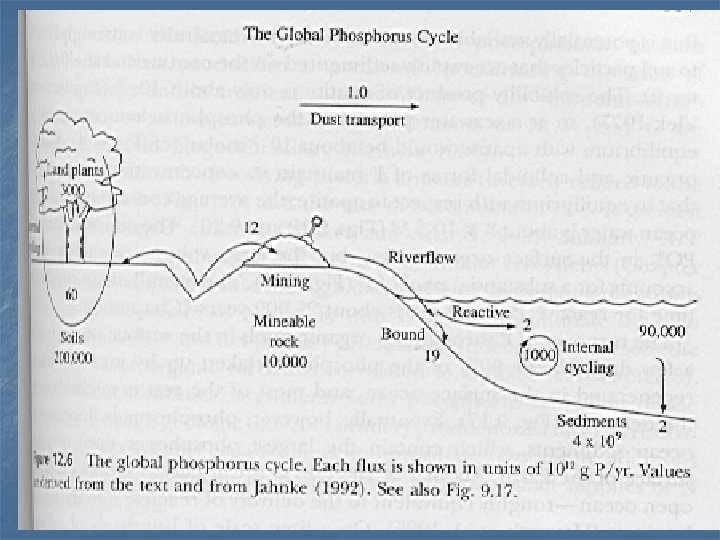
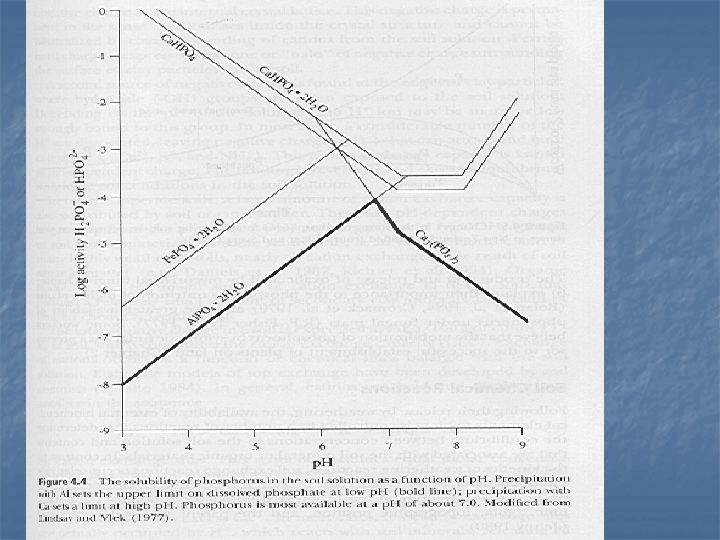
3 OH + H 2 CO 3 >") Phosphorus n Weathering n n Ca(PO 4)3 OH + H 2 CO 3 > Ca + HPO 4 +HCO 3 + H 2 O Precipitation Al(OH)3 + PO 4 > Al. PO 4 + OH n Fe(OH)3 + PO 4 > Fe. PO 4 + OH n Ca + PO 4 > Ca 3(PO 4)2 n
Phosphorus n Weathering n n Ca(PO 4)3 OH + H 2 CO 3 > Ca + HPO 4 +HCO 3 + H 2 O Precipitation Al(OH)3 + PO 4 > Al. PO 4 + OH n Fe(OH)3 + PO 4 > Fe. PO 4 + OH n Ca + PO 4 > Ca 3(PO 4)2 n
 Environmental problems n Global warming n n Acid deposition n CO 2 CH 4 N 2 O NO 3 SO 4 Eutrophication n n N P
 Thank you for your attention See you next time

 3. Characters of Nutrient cycling of Forest Ecosystem Why forests are able to grow on soils of extremely low fertility ? 1) 2) Self-fertilized (自肥) action Biogeochemical efficiency of deciduous forest is higher than that of coniferous forest.
 Input Throughfall Stemfall Stream Runoff Weathering output
 Nutrient compartment in Forest Ecosystems n n n n Trees Under story Forest floor Soil Mineral and bedrock Dry and wet deposition (rainfall, stemfall, throughfall) Stream water
 Biogeochemical efficiency A Oak Forest: Absorbtion 314 Kg/y/ha Return 241 Kg/y/ha Retention 72 Kg/y/ha Biogeochemical efficiency= return/absorption=. 76
 Biogeochemical efficiency= return/absorption=. 38 A Chinese fir forest Absorbtion 220 Kg/y/ha Return 136 Retention Kg/y/ha 85 Kg/y/ha
 Most amounts of nutrient in Forest ecosystems is in soil 4)") n n 3) Most amounts of nutrient in Forest ecosystems is in soil 4) Most amount of nutrients of tree is in leaves
n n 3) Most amounts of nutrient in Forest ecosystems is in soil 4) Most amount of nutrients of tree is in leaves
 Soil 155681 (98%) Trees 2476") Nutrient Accumulation and distribution in an oak forest (kg/ha) Soil 155681 (98%) Trees 2476 (1. 56%) Floor 293 Shrubs (. 19%) 77 (0. 05% ) Herbs 17 (0. 01%)
Nutrient Accumulation and distribution in an oak forest (kg/ha) Soil 155681 (98%) Trees 2476 (1. 56%) Floor 293 Shrubs (. 19%) 77 (0. 05% ) Herbs 17 (0. 01%)
 Nutrient distribution
 Nutrient re-translocation") 5) Nutrient re-translocation
5) Nutrient re-translocation
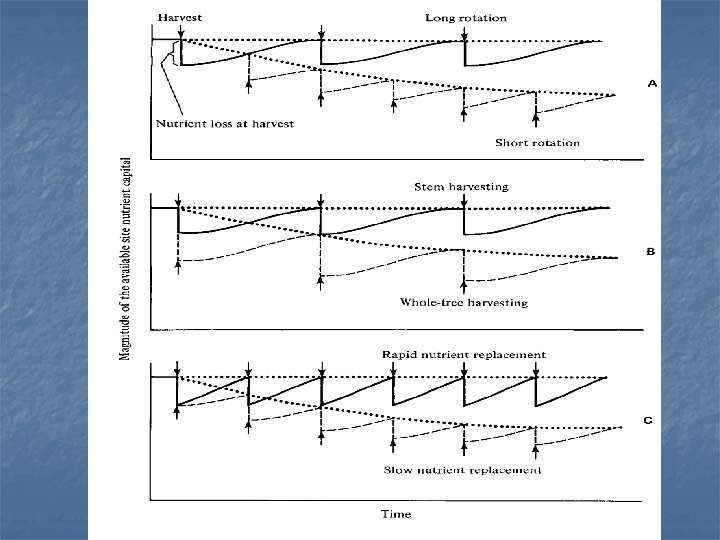
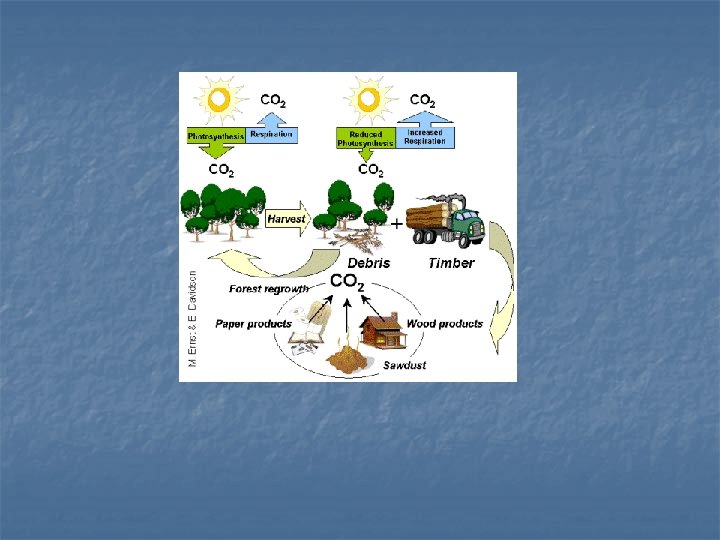
 4. Effect of Forest Management on Forest Biogeochemistry ----- Clearcut harvesting and postharvest slashburning. n 1) Nutrients Losses in Harvested Materials wasteful harvesting? Complete-tree harvesting? short rotation?
 Increased Availability of nutrients: The Assart Effect Clearcutting accelerates the mineralization of") n 2) Increased Availability of nutrients: The Assart Effect Clearcutting accelerates the mineralization of forest floor and soil materials
n 2) Increased Availability of nutrients: The Assart Effect Clearcutting accelerates the mineralization of forest floor and soil materials
 leaching losses accompanying clearcutting The assart effect results from increase in the") n 3) leaching losses accompanying clearcutting The assart effect results from increase in the available of nutrients.
n 3) leaching losses accompanying clearcutting The assart effect results from increase in the available of nutrients.
 Highest productivity 2) Complex Structure") 5. The Characters of Forest Ecosystem n n 1) Highest productivity 2) Complex Structure and components, animals, microbes, plants n 3) Long-life n 4) Most of terrestrial ecosystem are forest n 5) Posses much more space Big Crown and huge root systems
5. The Characters of Forest Ecosystem n n 1) Highest productivity 2) Complex Structure and components, animals, microbes, plants n 3) Long-life n 4) Most of terrestrial ecosystem are forest n 5) Posses much more space Big Crown and huge root systems
 Definitions n Biogeochemistry n n n The study of pool size and fluxes of elements Pool: The reservoir of elements Flux: An exchange between two reservoirs Turnover time: Pool/output Biogeochemical cycles n n The flow of elements from abiotic to biotic components in a cyclic path Gaseous cycles: The main reservoirs of nutrients are the atmosphere and the oceans Sedimentary cycles: The main reservoir is the soil, rocks, and minerals Both cycles are tied to the water cycle
 Objectives n n Understand oxygen, carbon, and nitrogen cycles Outline phosphorus and sulfur cycle Describe environmental pollutants Understand the causes and consequences of global changes