
chapter: 13 > > Krugman/Wells Economics ©


- Размер: 1.4 Mегабайта
- Количество слайдов: 31
Описание презентации chapter: 13 > > Krugman/Wells Economics © по слайдам
chapter: 13 > > Krugman/Wells Economics © 2009 Worth Publishers. Perfect Competition and The Supply Curve
WHAT YOU WILL LEARN IN THIS CHAPTER What a perfectly competitive market is and the characteristics of a perfectly competitive industry How a price-taking producer determines its profit-maximizing quantity of output How to assess whether or not a producer is profitable and why an unprofitable producer may continue to operate in the short run Why industries behave differently in the short run and the long run What determines the industry supply curve in both the short run and the long run
Perfect Competition A price-taking producer is a producer whose actions have no effect on the market price of the good it sells. A price-taking consumer is a consumer whose actions have no effect on the market price of the good he or she buys. A perfectly competitive market is a market in which all market participants are price-takers. A perfectly competitive industry is an industry in which producers are price-takers.
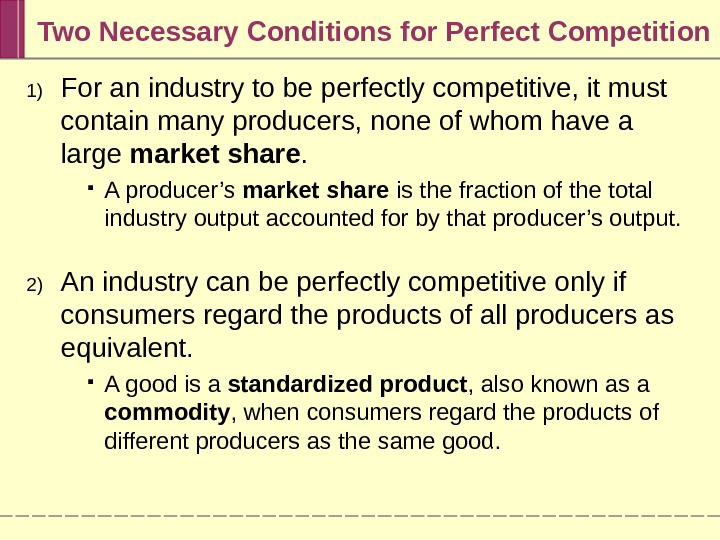
Two Necessary Conditions for Perfect Competition 1) For an industry to be perfectly competitive, it must contain many producers, none of whom have a large market share. A producer’s market share is the fraction of the total industry output accounted for by that producer’s output. 2) An industry can be perfectly competitive only if consumers regard the products of all producers as equivalent. A good is a standardized product , also known as a commodity , when consumers regard the products of different producers as the same good.
Free Entry and Exit There is free entry and exit into and from an industry when new producers can easily enter into or leave that industry. Free entry and exit ensure: that the number of producers in an industry can adjust to changing market conditions, and, that producers in an industry cannot artificially keep other firms out.
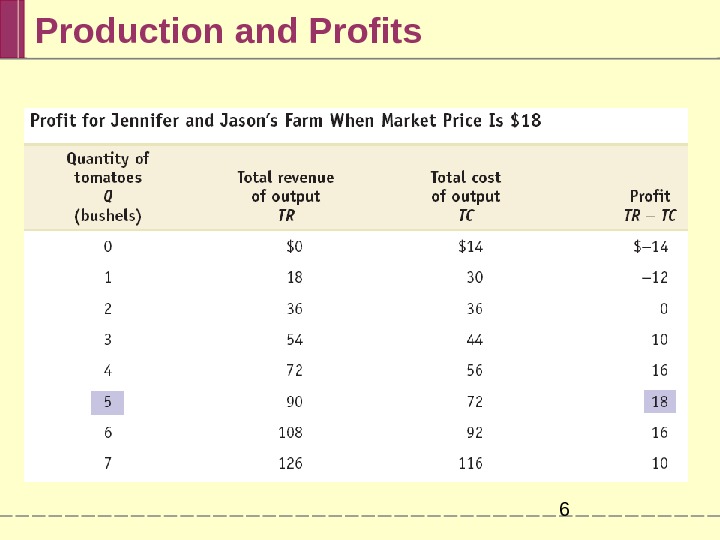
Production and Profits
Using Marginal Analysis to Choose the Profit-Maximizing Quantity of Output Marginal revenue is the change in total revenue generated by an additional unit of output. MR = ∆TR/∆Q
The Optimal Output Rule The optimal output rule says that profit is maximized by producing the quantity of output at which the marginal cost of the last unit produced is equal to its marginal revenue.
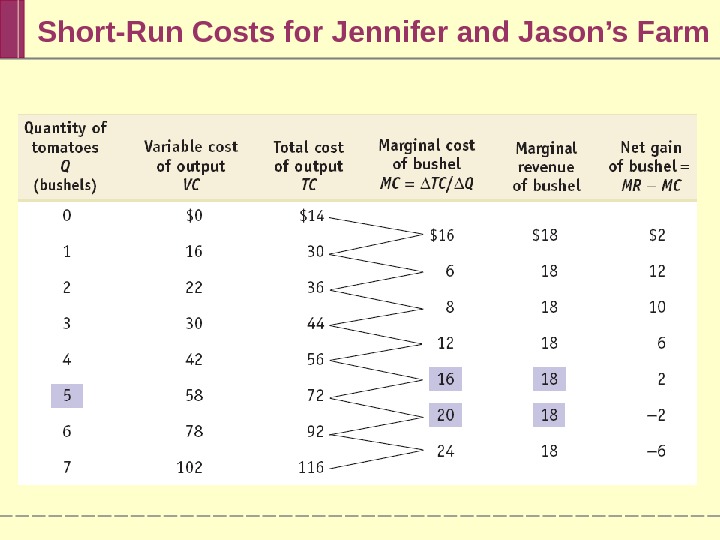
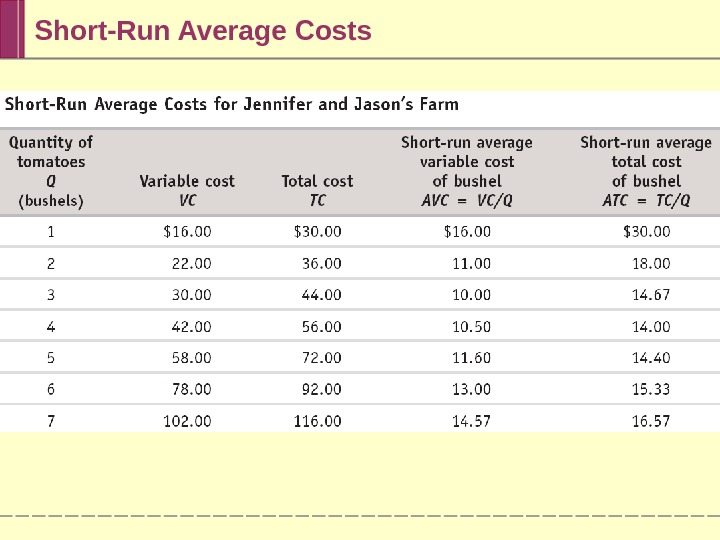
Short-Run Costs for Jennifer and Jason’s Farm
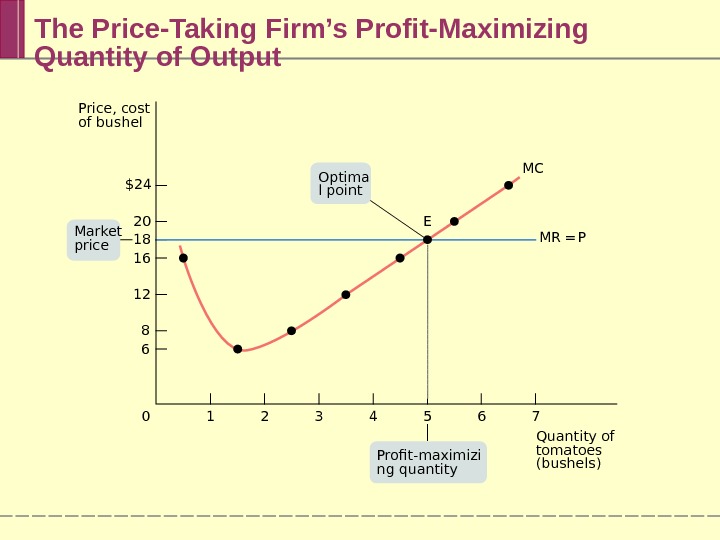
Marginal Analysis Leads to Profit-Maximizing Quantity of Output The price-taking firm’s optimal output rule says that a price-taking firm’s profit is maximized by producing the quantity of output at which the marginal cost of the last unit produced is equal to the market price. The marginal revenue curve shows how marginal revenue varies as output varies.
The Price-Taking Firm’s Profit-Maximizing Quantity of Output 76543210$24 20 18 16 12 8 6 Price, cost of bushel Quantity of tomatoes (bushels)MC MR = PE Profit-maximizi ng quantity. Optima l point Market price
When Is Production Profitable? If TR > TC , the firm is profitable. If TR = TC , the firm breaks even. If TR < TC , the firm incurs a loss.
Short-Run Average Costs
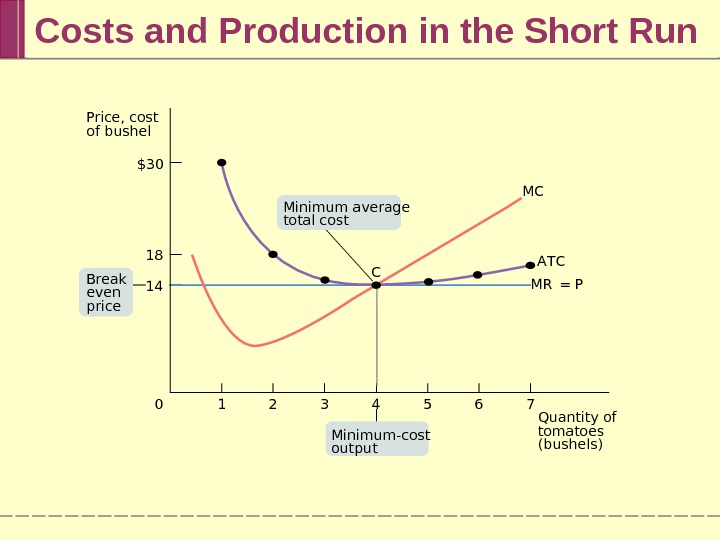
Costs and Production in the Short Run 76543210$30 18 14 MC A T C MR = PC Break even price Minimum-cost output. Price, cost of bushel Quantity of tomatoes (bushels)Minimum average total cost
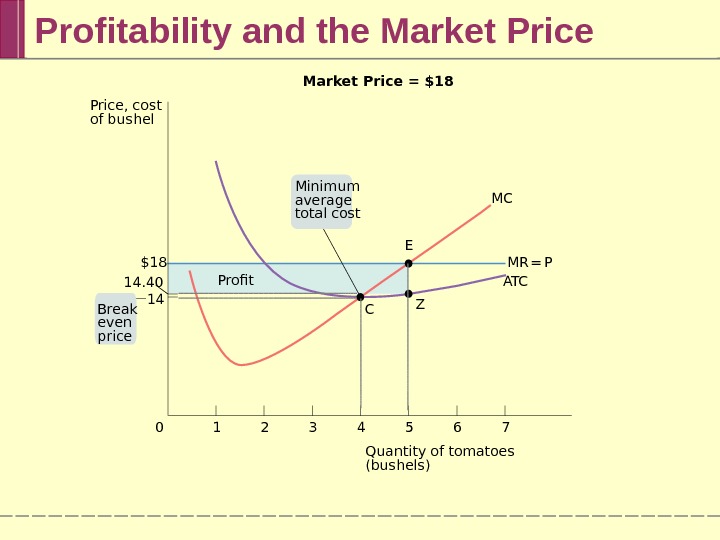
Profitability and the Market Price 76543210 MC Profit A T CMR = P C ZEMarket Price = $18 1414. 40 $18 Price, cost of bushel Quantity of tomatoes (bushels)Minimum average total cost Break even price
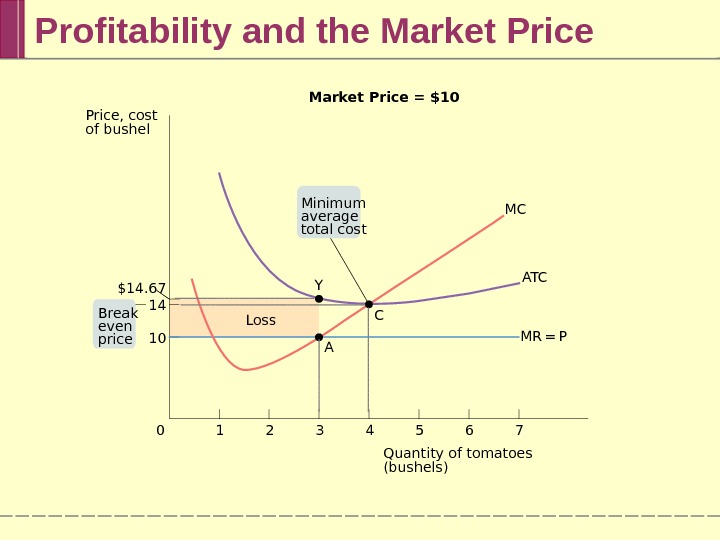
Profitability and the Market Price 76543210 MC Loss A T C MR = PC AYMarket Price = $10 14 10$14. 67 Price, cost of bushel Quantity of tomatoes (bushels)Minimum average total cost Break even price
Profit, Break-Even or Loss The break-even price of a price-taking firm is the market price at which it earns zero profits. Whenever market price exceeds minimum average total cost, the producer is profitable. Whenever the market price equals minimum average total cost, the producer breaks even. Whenever market price is less than minimum average total cost, the producer is unprofitable.
The Short-Run Individual Supply Curve 76543 3. 5210$18 16 14 12 10 MC A T C A VC C B A E Minimum average variable cost. Short-ru n individua l supply curve Shut-dow n price Price, cost of bushel Quantity of tomatoes (bushels)
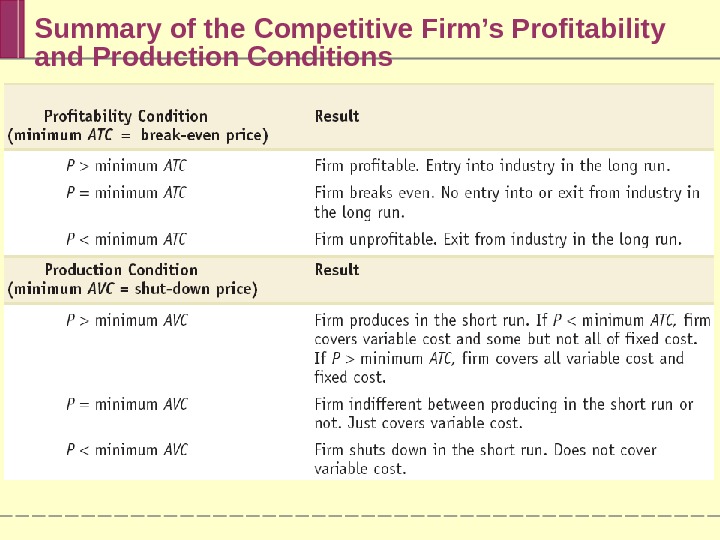
Summary of the Competitive Firm’s Profitability and Production Conditions
Industry Supply Curve The industry supply curve shows the relationship between the price of a good and the total output of the industry as a whole. The short-run industry supply curve shows how the quantity supplied by an industry depends on the market price given a fixed number of producers. There is a short-run market equilibrium when the quantity supplied equals the quantity demanded, taking the number of producers as given.
The Long-Run Industry Supply Curve A market is in long-run market equilibrium when the quantity supplied equals the quantity demanded, given that sufficient time has elapsed for entry into and exit from the industry to occur.
The Short-Run Market Equilibrium 7006005004003002000$26 22 18 14 10 DShort-run industry supply curve, S E MKT Shut-dow n price Price, cost of bushel Quantity of tomatoes (bushels)Market price
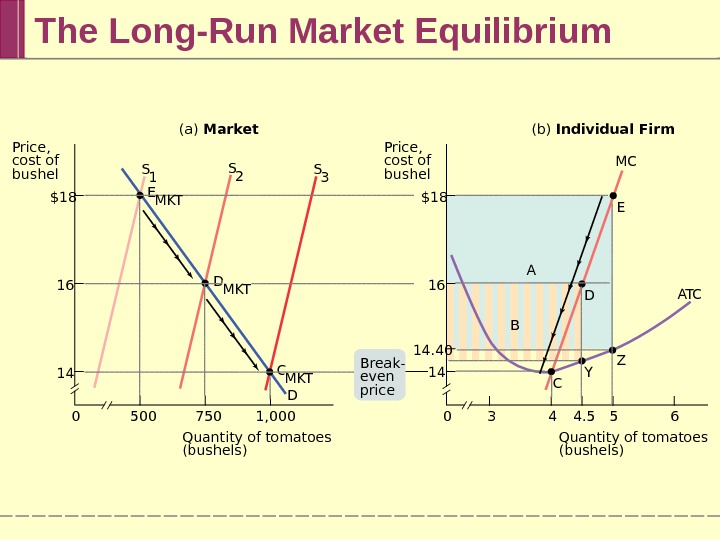
The Long-Run Market Equilibrium Quantity of tomatoes (bushels) 654 4. 530$18 16 14 1, 0007505000$18 16 14 D E C D Y ZMC A T CA B(a) Market (b) Individual Firm 14. 40 E D C MKTS 1 S 3 S 2 Price, cost of bushel Quantity of tomatoes (bushels) Price, cost of bushel Break- even price. MKTMKT
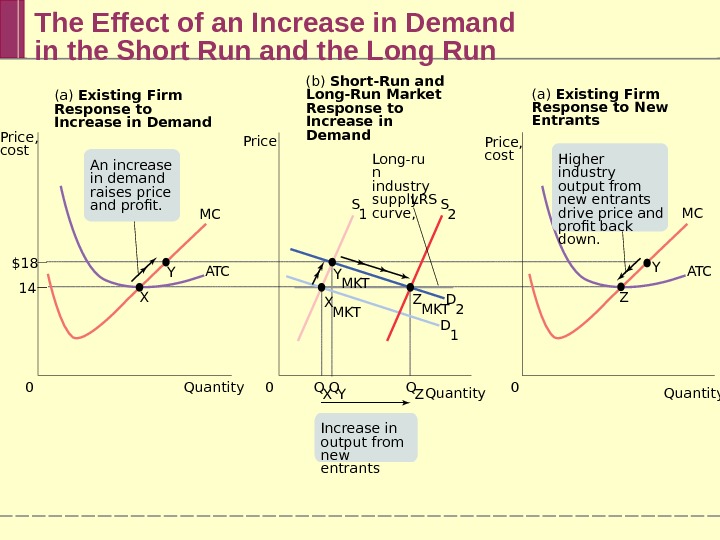
The Effect of an Increase in Demand in the Short Run and the Long Run MC A T C X Y 0 0 0$18 14 Quantity MC A T C Z YPrice S 1 D 1 D 2 S 2 Y MKT X MKT Z MKT LRS Q X Q Y Q Z(a) Existing Firm Response to Increase in Demand (b) Short-Run and Long-Run Market Response to Increase in Demand (a) Existing Firm Response to New Entrants Price, cost Increase in output from new entrants. An increase in demand raises price and profit. Long-ru n industry supply curve, Higher industry output from new entrants drive price and profit back down. Quantity
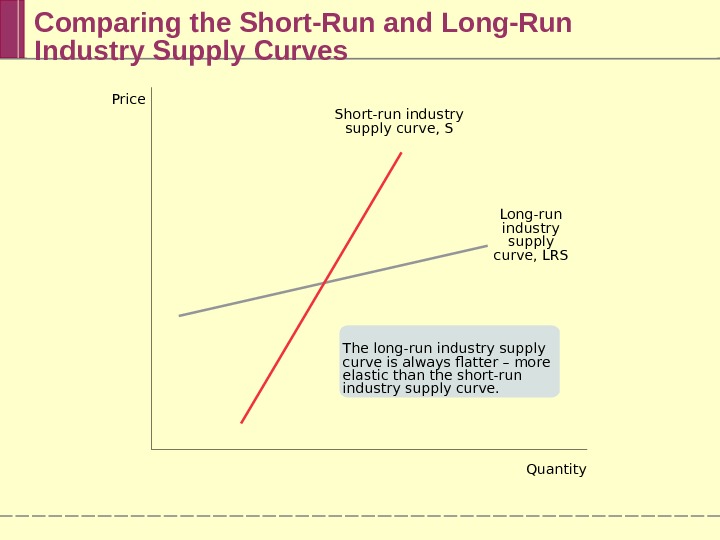
Comparing the Short-Run and Long-Run Industry Supply Curves The long-run industry supply curve is always flatter – more elastic than the short-run industry supply curve. Short-run industry supply curve, S Long-run industry supply curve, LRSPrice Quantity
Conclusions Three conclusions about the cost of production and efficiency in the long-run equilibrium of a perfectly competitive industry: In a perfectly competitive industry in equilibrium, the value of marginal cost is the same for all firms. In a perfectly competitive industry with free entry and exit, each firm will have zero economic profits in long-run equilibrium. The long-run market equilibrium of a perfectly competitive industry is efficient: no mutually beneficial transactions go unexploited.
SUMMARY 1. In a perfectly competitive market all producers are price-taking producers and all consumers are price — taking consumers. 2. There are two necessary conditions for a perfectly c ompetitive industry: there are many producers, none of whom have a large market share, and the industry produces a standardized product or commodity. A third condition is often satisfied as well: free entry and exit into and from the industry.
SUMMARY 3. A producer chooses output according to the optimal output rule : produce the quantity at which marginal revenue equals marginal cost. For a price-taking firm, marginal revenue is equal to price and its marginal revenue curve is a horizontal line at the market price. It chooses output according to the price-taking firm’s optimal output rule : produce the quantity at which price equals marginal cost. 4. A firm is profitable if total revenue exceeds total cost or, equivalently, if the market price exceeds its break-even price —minimum average total cost.
SUMMARY 5. Fixed cost is irrelevant to the firm’s optimal short-run production decision, which depends on its shut-down price —its minimum average variable cost—and the market price. When the market price is equal to or exceeds the shut-down price, the firm produces the output quantity where marginal cost equals the market price. When the market price falls below the shut-down price, the firm ceases production in the short run. This generates the firm’s short-run individual supply curve. 6. Fixed cost matters over time. If the market price is below minimum average total cost for an extended period of time, firms will exit the industry in the long run. If above, existing firms are profitable and new firms will enter the industry in the long run.
SUMMARY 7. The industry supply curve depends on the time period. The short-run industry supply curve is the industry supply curve given that the number of firms is fixed. The short-run market equilibrium is given by the intersection of the short-run industry supply curve and the demand curve. 8. The long-run industry supply curve is the industry supply curve given sufficient time for entry into and exit from the industry. In the long-run market equilibrium — given by the intersection of the long-run industry supply curve and the demand curve—no producer has an incentive to enter or exit. The long-run industry supply curve is often horizontal. It may slope upward if there is limited supply of an input. I t is always more elastic than the short-run industry supply curve.
SUMMARY 9. In the long-run market equilibrium of a competitive industry, profit maximization leads each firm to produce at the same marginal cost, which is equal to market price. Free entry and exit means that each firm earns zero economic profit—producing the output corresponding to its minimum average total cost. So the total cost of production of an industry’s output is minimized. The outcome is efficient because every consumer with a willingness to pay greater than or equal to marginal cost gets the good.