

cf2fade06e904105ded15dfdc81a00ee.ppt
- Количество слайдов: 46
 Catastrophe Modelling GIRO 1999
 Catastrophe Modelling What did we do? n Why did we do it? n What this workshop will cover. n
 What did we do? Discussed QUANTIFICATION of Catastrophe impacts n From a practical point of view n Questions rather than answers n Limitations of CAT models n London Market rather than domestic n Not aimed at Aggregate Cat XL n
 Why did we do it? Most members of WP had little Catastrophe experience n Aimed at those with little experience see issues faced by other actuaries n Areas for further actuarial input n Stimulate discussion rather than provide answers n
 This workshop Aimed at entry-level to this subject n Earthquake n Reinsurer’s perspective n DIY model - components and problems n Is understanding models a mandatory issue in the US? n
 Quantification Pricing: expectation, effect of reinsurance, ROE, . . n Exposure: PML aggregate, zonation, . . n Reinsurance: vertical, horizontal, cost, allocation of cost to underwriters, . . n Capital: amount required, allocation, DFA, . . n Reserving: especially soon after event n
 Examples of classes affected Property Risk XL n Direct & Facultative Excess n Workers Compensation n Personal Accident n Marine n
 1995/6 California PML returns PML Gross to Net
 Overview of CAT model Event : Damage : Insurance : Generates a stochastic set of events quantified in terms of objective measures. Converts physical measures into damage as % of total value. Converts damage to property into amount recoverable from the insurance e. g. windspeeds
 Why aren’t CAT models the complete answer? Non-primary business n Non-property classes n Non-standard property n Contract terms n Not all territories n Expense/access n
 Example 1: Facultative Excess Pricing n Per occurrence coverage Warehouse Factory Office Building
 Fac Excess rating: non-Cat Get the EML for each building n for each of the 3 buildings determine a suitable rate to be applied to the EML n Apply suitable First Loss curve (FLC) to allocate base premium to excess layer. n Sum of rates for each. n Adjust for contagion, etc. . n
 Fac excess rating : Cat Get TSI for each n apply Cat rate on TSI to each n sum TSI and sum Cat premiums n use Cat FLC to allocate Cat premiums to the excess layer n
 Fac excess rating - problems there are no “market” Cat FLCs: underwriters use the non-Cat FLC n The “correct” Cat FLC to use may vary depending on the location/zone n Ludwig’s Hugo curve was single event how do we allow for all possible events? n The “correct” Cat FLC may also vary by other factors such as occupancy, age, . . n
 Why can’t a CAT model be used to solve this problem? CAT models are not generally designed to cope with large deductibles n Lack of availability in many territories n
 Example 2: PML aggregate of Risk XL Want to assess the PML exposure to various Cat. s n Say three layers in program: n 5 M xs 10 M, 5 R/Is, 20 M event limit n 10 M xs 10 M, 2 R/Is, 20 M event limit n 30 M xs 20 M, 1 R/I, 30 M event limit n
 Why is this important? Need to make sure that buy enough vertical and horizontal reinsurance n If too high then you’ll be wasting money buying too much reinsurance at too much cost n Make sure that underwriters are writing within their authority n
 Typical data n EML profile and territorial split
 Problems Territorial by premium% n Territories are large n How to allow for aggregate deductibles, event limits, reinstatements. n Want TSI profile not EML profile n Per occurrence coverage n Coverage erosion by attrition, other Cats n XL on XL n
 How could PML be calculated? Estimate a TSI risk profile by suitable Cat zones. n Apply a suitable PML Severity distribution to determine the expected PML loss to each layer n Allow for event limits to each Cat zone n Make allowance for attrition, second event, aggregate deductibles etc. n
 Why can’t a CAT model be used to solve this problem? CAT models do not use exposure data in the form of a risk profile n Need to allow for underlying deductibles n CAT models work in the aggregate, not at the per risk level n
 Explicit Modelling Better understanding of CAT models if we try to build one ourselves n Ability to vary the assumptions to test the sensitivity n Able to slice the predicted experience in more useful ways n Useful for non-standard risks n
 A simple earthquake model Event module ¬ Return Periods Richter, Mercalli, PGA ® Attenuation n Damage module n Insurance module n
 Magnitude, Intensity, PGA Magnitude : Richter, single number for an event, eg RM 7. 3 n Intensity: Mercalli, different values for an event, eg MM VIII n PGA: Peak Ground Acceleration: measure of seismic shaking at a site n How are these related? n Duration and frequencies also important - Arias Intensity n
 Return Periods Guttenberg-Richter: a. 10 -b. M n See Matthewson’s CAS paper for details n For PML need to estimate magnitude for given return period eg 200 years n Lack of historical data? n Add 1 to RM scale means 32 X energy released, 10 X shaking intensity n Location: specific or zone? n
 Return periods - problems Lack of historical data n extrapolation from G-R function n Historical data may need to be converted from MM to RM n Conversion of RM to epicentral PGA n
 General level of seismicity
 Attenuation Shows how the intensity decreases with distance from rupture n Usual form : n Ln(PGA) = a +b. Ln(R +C(M)) n R = hypocentral distance n R approx =-1, though wide variation by underlying geology n Also local soil conditions important n
 Attenuation-problems Depends on rupture depth - which is difficult to obtain n Seismologists understand attenuation from deep ruptures better than shallow n Affected by factors such as mountain ranges, rivers n
 Kobe 1995 attenuation
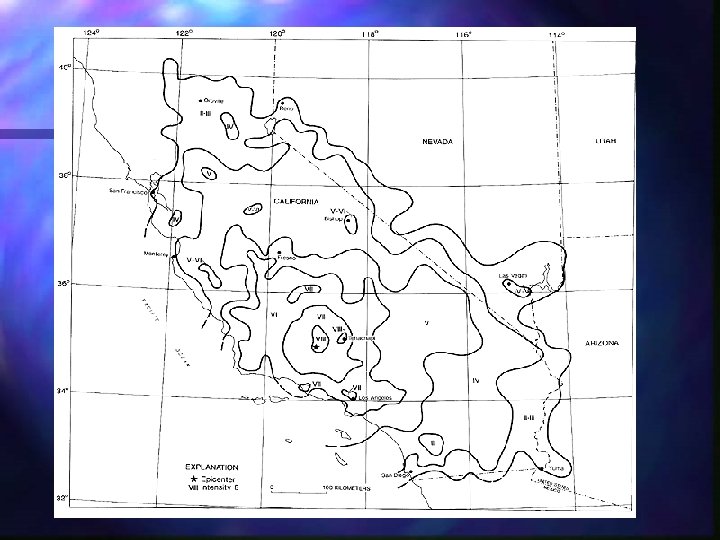
 Isoseismals Use the attenuation function to obtain PGA at distance from rupture n Use table to convert from PGA to MM n Could miss this step if damage function based on PGA n Not circular due to length of rupture n
 Isoseismals - problems PGA continuous, MM discrete n PGA doesn’t include duration of shaking, but MM does implicitly, so not exact correlation n PGA not well correlated to damage n
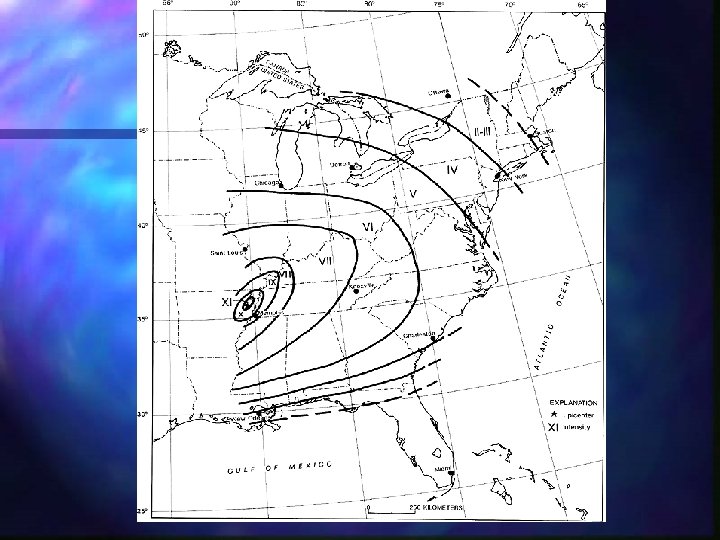
 Examples of isoseismal maps
 Damage function Used to convert MM at location into repair cost as % of total value n Engineers’ measures of damage not directly useful as don’t show repair cost as % of value n Vary by a range of factors such as age, height, construction, occupancy, … n Vary for Buildings, contents, BI n ATC-13 is the source report n
") Damage vs Intensity (NHRC)
Damage vs Intensity (NHRC)
") Damage vs Magnitude (NHRC)
Damage vs Magnitude (NHRC)
 Damage - problems ATC-13 or similar may not be appropriate for all territories n Conversion from ATC-13 categories to other classification systems n Not available for unusual risks n Not available for other classes n FFQ, inundation, liquifaction, landslide, . . n Business interruption n
 Damage - problems Do the damage % refer to amounts above a notional insurance deductible? n Demand surge inflation? Eg cost of bricks, carpenters, etc. . n MM is a discrete scale, but damage is continuous n Fraud, loss adjustment, . . . n
 Variation of Damage Similar, adjacent properties will not suffer same % damage n Pounding, design, construction, occupancy, time of day, day of week, preparedness, FFQ, …. n Some authors suggest lognormal n
 Example distribution for MM X event
 FGU loss cost Convert the isoseismal map into an “isodamage” map n Estimate the exposure in each of the band of the isoseismal. n Multiply to get the amount of damage n Per-risk, by risk profile band, or in aggregate, depending on use n
 FGU loss cost - problems Where is the epicentre? n Where is the exposure relative to the epicentre? n How do you allow for those exposures which suffer no damage? n
 PML estimation using model Work out/estimate location of exposure in a zone. n Assume that PML event occurs at greatest concentration of exposure? n Estimate MM at given PML return period n
 Summary CAT models don’t yet provide all the answers n Useful to know roughly how they work n Useful to understand the limitations of their components n We can make simple models ourselves n Useful to be able to calibrate in-house against external models n