

81d68efe477f3269fbd5abb2f68c57f8.ppt
- Количество слайдов: 59
 Cardiovascular Disease from the Canadian and International Perspectives Canadian Heart Health Strategic –Action Plan Dr. Sonia Anand MD, Ph. D Professor of Medicine Mc. Master University
 Overview • • • Global Burden of CVD Canadian Burden of CVD Ethnic Variations in Risk factors Association between Risk factors and CVD Strategies for Prevention Call for Action
 CHANGE IN THE RANK ORDER OF DISEASE BURDEN FOR 10 LEADING CAUSES, WORLD, 1990 -2020 (DALYS) 1. Lower resp infection 2. Diarrh diseases 3. Perinatal 4, Major depression 5. Coronary heart dis 6. Stroke 7. TB 8. Measles 9. Traffic accidents 10. Cong anomalies 1990 2020 1 Coronary heart disease 2. Major depression 3. Traffic accidents 4. Stroke 5. COPD 6. Lower resp infections 7. TB 8. War 9. Diarrhoeal disease 10. HIV
 from Cardiovascular Disease Millions of Deaths Worldwide Deaths from Cardiovascular Causes Reddy K. N Engl J Med 2004; 350: 2438 -2440
 Diabetes Care 2004: 1047") Numbers with DM (Diagnosed) Diabetes Care 2004: 1047
Numbers with DM (Diagnosed) Diabetes Care 2004: 1047
 Per 100, 000 Age-standardized mortality rates of CVD and Cancer in Canada CVD= IHD, CBVD, DM, ATH Statistics Canada
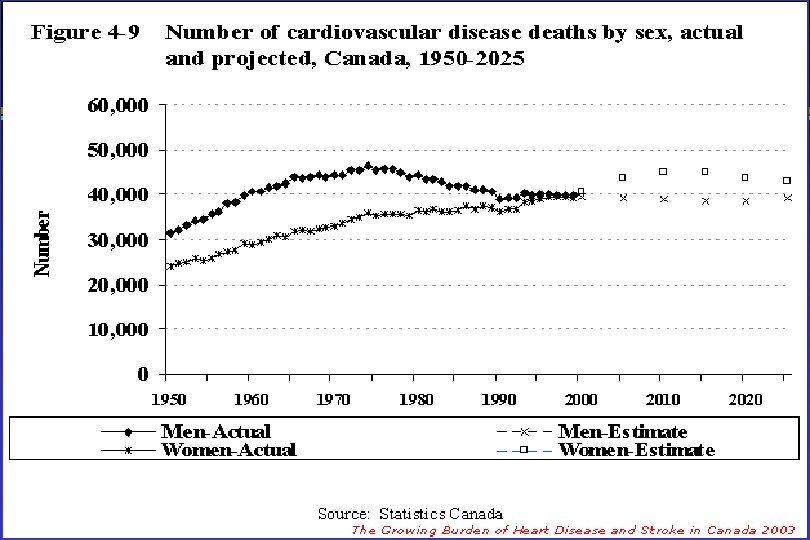
 Canada’s Modifiable Risk Factors Risk Factor Proportion of the Population Aged 20 -59 Years (%) Tobacco Smoking (Daily) 25. 7 Physical Inactivity 55. 5 Overweight (BMI > 25. 0) 47. 5 Less than Recommended Consumption of Fruits and Vegetables 64. 7 High Blood Pressure 8. 3 Diabetes* 2. 7 Source: Statistics Canada, Canadian Community Health Survey The Growing Burden of Heart Disease and Stroke in Canada 2003
 Comparing Ethnic Groups
 Sheth et al,") Mortality for CHD and Cancer Age 35 – 74 (1979 -1993) Sheth et al, CMAJ 1999
Mortality for CHD and Cancer Age 35 – 74 (1979 -1993) Sheth et al, CMAJ 1999
 Aboriginal Immigrants 24% 74% • 922, 000 Chinese • 723, 000 South Asians
 SHARE: Study of Health Assessment and Risk in Ethnic Groups Random Sample - Europeans, South Asians, Chinese, Aboriginal Environmental Risk Markers Factors Subclinical Clinical • Lipids • Lifestyle Disease Events • Coagulation • Nutrition • Carotid • Psychosocial • CAD • Glucose • Ankle Arm BP • Cultural • Stroke • BP • LVH • PVD • Antioxidants • Micro Alb. Genetic • Homocysteine Factors Anand S et al Can J Cardiol 1998
 Percent Distribution By Province of Registered Indian Population in Canada
/1. 0") Overweight and Abdominal Fat % BMI ≥ 30; WHR > 0. 85 (female)/1. 0 (male) Age and sex Adjusted Anand et al SHARE Lancet 2000/1
Overweight and Abdominal Fat % BMI ≥ 30; WHR > 0. 85 (female)/1. 0 (male) Age and sex Adjusted Anand et al SHARE Lancet 2000/1
 ↑ Glucose: Dysglycemia 11 Anand et al SHARE
 Relationship of Glucose Factor to BMI in Non-white ethnic groups BMI=21 BMI = 30 Razak et al Circ 2005
 CVD Prevalence comparing Ethnic Groups in Canada Age and Sex Adjusted Anand et al SHARE
 SHARE- Nutrition South Asians N Age Chinese Euro AP 173 167 185 92 46. 3 45. 8 47. 7 51. 6 Calories/Day % Vegetarian 1911 1898 2072 2242* 18. 8* 2. 1 0. 6 1. 2 Total Fat g/day 59. 1 70. 3* 61. 8 69. 8 Saturated Fat g/day 19. 6 17. 3* 21. 6 25. 7 Carbohydrates g/day 298. 8* 240. 7 269. 5 256. 7 Sugar g/day 11. 2* 6. 9 8. 9 6. 7 Protein g/day 70. 1* 100. 5* 78. 0 82. 1 Anand et al SHARE
 4. 8") SHARE- Fat Intake South Asians Chinese Euro Fried Foods (# serv. /week) 4. 8 3. 9 5. 0 Total Fat g/day 59. 1 70. 3* 61. 8 Saturated Fat g/day 19. 6 17. 3* 21. 6 Trans Fats (g) 0. 34 0. 27 0. 56*
SHARE- Fat Intake South Asians Chinese Euro Fried Foods (# serv. /week) 4. 8 3. 9 5. 0 Total Fat g/day 59. 1 70. 3* 61. 8 Saturated Fat g/day 19. 6 17. 3* 21. 6 Trans Fats (g) 0. 34 0. 27 0. 56*
 1. 1 6. 3*") SHARE- Fish South Chinese Euro Asian Fish (# serv. /week) 1. 1 6. 3* 1. 6 Omega-3 FA 0. 13 0. 76 0. 04 Omega-6 FA 0. 37 0. 42 0. 31
SHARE- Fish South Chinese Euro Asian Fish (# serv. /week) 1. 1 6. 3* 1. 6 Omega-3 FA 0. 13 0. 76 0. 04 Omega-6 FA 0. 37 0. 42 0. 31
 Risk of CVD and Social Disadvantage Aboriginal and South Asian ♂ Aboriginal and South Asian ♀ Chinese ♂/ ♀ Anand, S. S et al. Int. J. Epidemiol. 2006 35: 1239 -1245; doi: 10. 1093/ije/dyl 163
 Changes in Risk Factors with Migration
 EVOLUTION OF RISK FACTORS IN URBAN MIGRANTS • ¯ Activity • Diabetes • Calories • Dyslipidemia • Cultural Stressors • Hypertension CVD
 Controls: Matched to cases by") INTERHEART: Design Cases: First Acute Myocardial Infarction (n=15, 152) Controls: Matched to cases by age (+/-5 yr and sex) at each site (n=14, 820) Data collected from 262 sites in 52 countries Coordinated by the Population Health Research Institute, Mc. Master University, Canada Ounpuu S et al Am Heart J 2001
INTERHEART: Design Cases: First Acute Myocardial Infarction (n=15, 152) Controls: Matched to cases by age (+/-5 yr and sex) at each site (n=14, 820) Data collected from 262 sites in 52 countries Coordinated by the Population Health Research Institute, Mc. Master University, Canada Ounpuu S et al Am Heart J 2001
 Risk Factor Frequency Varies Are the same risk factors important in all ethnic groups, age groups, and women and men?
 Controls: Matched to cases by") INTERHEART: Design Cases: First Acute Myocardial Infarction (n=15, 152) Controls: Matched to cases by age (+/-5 yr and sex) at each site (n=14, 820) Data collected from 262 sites in 52 countries Coordinated by the Population Health Research Institute, Mc. Master University, Canada Ounpuu S et al Am Heart J 2001
INTERHEART: Design Cases: First Acute Myocardial Infarction (n=15, 152) Controls: Matched to cases by age (+/-5 yr and sex) at each site (n=14, 820) Data collected from 262 sites in 52 countries Coordinated by the Population Health Research Institute, Mc. Master University, Canada Ounpuu S et al Am Heart J 2001
 INTERHEART: > 27, 000 Cases and Controls Kuwait Russia Australia Croatia Czech Rep Malaysia Seychelles Bahrain Egypt Mexico Singapore Bangladesh Benin Germany Mozambique S Africa Greece Spain Botswana Guatemala Nepal New Zealand Brazil Hungary Netherlands Sultanate of Oman Cameroon India Nigeria Sweden Canada Iran Pakistan Thailand Chile Israel Philippines UAE Poland UK Portugal USA Qatar Zimbabwe Argentina China/Hong Kong Italy Japan Colombia Kenya Sri Lanka
 INTERHEART Global Case-Control Study: Nine Modifiable Risk Factors • Smoking • Elevated Lipids: ↑ Apo. B/Apo A ratio • Diabetes • Hypertension • >27, 000 subjects • 52 Countries • 6000 women • > 12, 000 > age 60 yrs • Abdominal Obesity: ↑ Waist to Hip Ratio • Physical Activity: > 4 hrs/week • Alcohol: ≥ 3 drinks/week • Fruit and Vegetable Consumption: Daily • Psychosocial Stress: Work/home stress, depression, financial stress, locus of control
 Risk of MI associated with Risk Factors in the Overall Population Risk factor % Cont % Cases OR (99% CI) PAR (99% CI) adj for all Apo. B/Apo. A-1 (5 v 1) Curr smoking Abd Obesity (3 v 1) Hypertension Diabetes Psychosocial 20. 0 26. 8 33. 3 21. 9 7. 5 - 33. 5 45. 2 46. 3 39. 0 18. 4 - 3. 25 (2. 81, 3. 76) 2. 87 (2. 58, 3. 19) 1. 62 (1. 45, 1. 80) 1. 91 (1. 74, 2. 10) 2. 37 (2. 07, 2. 71) 2. 67 (2. 21, 3. 22) 49. 2 (43. 8, 54. 5) 35. 7 (32. 5, 39. 1) 20. 1 (15. 3, 26. 0) 17. 9 (15. 7, 20. 4) 9. 9 (8. 5, 11. 5) 32. 5 (25. 1, 40. 8) Veg & fruits daily 42. 4 35. 8 0. 70 (0. 62, 0. 79) 13. 7 (9. 9, 18. 6) Exercise 19. 3 14. 3 0. 86 (0. 76, 0. 97) 12. 2 (5. 5, 25. 1) Alcohol Intake 24. 5 24. 0 0. 91 (0. 82, 1. 02) 6. 7 (2. 0, 20. 2) 333. 7 (230. 2, 483. 9) 90. 4 (88. 1, 92. 4) All combined (extremes)
 Risk Factors for Acute MI in the Overall Population Risk factor Apo. B/Apo. A-1(5 v 1) Current smoking Psychosocial Abd Obesity (3 v 1) Hypertension No Veg & fruits Low Physical Activity Diabetes No Alcohol Combined % Cont % Cases 20. 0 33. 5 26. 8 45. 2 33. 3 46. 3 21. 9 39. 0 42. 4 35. 8 19. 3 14. 3 7. 5 18. 5 24. 0 - PAR (99% CI) 49. 2 (43. 8, 54. 5) 35. 7, (32. 5, 39. 1) 32. 5 (25. 1, 40. 8) 20. 1 (15. 3, 26. 0) 17. 9 (15. 7, 20. 4) 13. 7 (9. 9, 18. 6) 12. 2 (5. 5, 25. 1) 9. 9 (8. 5, 11. 5) 6. 7 (2. 0, 20. 2) 90. 4 (88. 1, 92. 4) Over 90% of AMI are predicted by these nine risk factors Lancet 2004
 4 2 1 Deciles: 1") INTERHEART: Apolipoprotein B/A-1 and MI 8 OR (99% CI) 4 2 1 Deciles: 1 2 3 4 5 6 7 8 9 10 Cont 1210 1206 1208 1207 1210 1209 1207 1208 1209 Cases 435 496 610 720 790 893 1063 1196 1366 1757 Median 0. 43 0. 53 0. 60 0. 66 0. 72 0. 78 0. 85 0. 93 1. 04 1. 28
INTERHEART: Apolipoprotein B/A-1 and MI 8 OR (99% CI) 4 2 1 Deciles: 1 2 3 4 5 6 7 8 9 10 Cont 1210 1206 1208 1207 1210 1209 1207 1208 1209 Cases 435 496 610 720 790 893 1063 1196 1366 1757 Median 0. 43 0. 53 0. 60 0. 66 0. 72 0. 78 0. 85 0. 93 1. 04 1. 28
 8 4 2 1 Never 1") INTERHEART: Smoking and MI 16 OR (99% CI) 8 4 2 1 Never 1 -5 6 -10 11 -15 16 -20 21 -25 26 -30 31 -40 41+ Cont 7489 727 1031 446 1058 96 230 168 56 Cases 4223 469 1021 623 1832 254 538 459 218 OR 1. 38 2. 10 2. 99 3. 83 5. 80 5. 26 6. 34 9. 16
INTERHEART: Smoking and MI 16 OR (99% CI) 8 4 2 1 Never 1 -5 6 -10 11 -15 16 -20 21 -25 26 -30 31 -40 41+ Cont 7489 727 1031 446 1058 96 230 168 56 Cases 4223 469 1021 623 1832 254 538 459 218 OR 1. 38 2. 10 2. 99 3. 83 5. 80 5. 26 6. 34 9. 16
 Independent risk of MI associated with 2 markers of obesity BMI WHR - adjusted for age, sex, smoking, region …+ WHR … + BMI
 INTERHEART DIETARY ANALYSIS • Methods – 6, 530 cases and 10, 792 controls – 19 items food groups questionnaire • Dietary Patterns: – Prudent diet: raw and cooked vegetables, legumes and fruits – Oriental diet: tofu, soy sauce and green leafy vegetables – Western diet: dairy, fried foods and meats (high in saturated fats)
 Dietary Intake Varies by Ethnicity Dietary Patterns: – Prudent diet: raw and cooked vegetables, legumes and fruits – Oriental diet: tofu, soy sauce and green leafy vegetables – Western diet: dairy, fried foods and meats (high in saturated fats) Iqbal et al 2006
 INTERHEART: Relative Risk of MI by Dietary Type ↑ 29% ↓ 24% Adjustment factors Age, sex, region, BMI, WHR, physical activity, alcohol intake, smoking, apo. B/apo. A 1, psycho-social factors, and education Iqbal R et al 2006
 Risk factors the same, Frequency Varies Risk factors for MI are the same for all ethnic groups, young and old, and women and men.
 Association between Risk factors and CHD is similar btwn ethnic groups Determinants Environment Diet Quality Physical activity Stress Air Pollution Risk Factors Consistent btwn ethnic groups Dyslipidemia Dysglycemia Adiposity Blood Pressure Smoking Genetic Factors Disease Psychosocial Stress Physical Inactivity ETOH CHD
 Prevention and Treatment of Risk Factors/CVD
 Frequency of INTERHEART RISK Factors in Cases and Controls Number of Subjects Number of Interheart Risk Factors
 Risk Factors are Ubiquitous in the Population – We are all at Risk • 80% of Canadians have 1 Risk Factor • 30% of Canadians have 2 Risk Factors • 11% have 3 or more Risk Factors Source: Statistics Canada, Canadian Community Health Survey
 INTERHEART: Decreased Risk of AMI with Avoidance of Smoking; Daily Fruits/Veg, Reg Phys Activity & Alcohol 0. 35 0. 70 0. 86 0. 91 0. 24 0. 21 0. 19 OR (99% CI) 1. 0 All the “right” things reduce odds of AMI by 80% 0. 5 0. 25 0. 125 no smk Frt/Veg Exer Alc Nosmk+fvg +Exer +Alc
 RCT Evidence that Altering Risk Factors Lowers CHD Risk Factor Abnormal Lipids Smoking ↑Blood Pressure Diabetes Abdominal Obesity Physical Activity Fruits and vegetable Alcohol Depression RCT Evidence Strong Alternative Evidence Yes No Yes (36 % RR) Yes Accumulating Yes Some Yes Yes No Yes (20% RR) No Yes Iestra et al Circulation 2005
 How can we prevent the majority of premature CHD? Can we prevent 90% of MI in young and middle age NOW? NO Can we prevent >90% of MI in young and middle age in the foreseeable future? YES

 Prevention of Cardiovascular Disease Individual Approach GOAL Type of Strategy Determinants of Risk Behaviours in a Population Individuals with Risk Factors for CVD Individuals with CVD Interventions with a Socio-Economic & Political Focus Interventions with a Preventive Focus Interventions with a Clinical Focus • Taxing Tobacco Examples • Subsidizing healthy foods • Promote Physical Activity by improving Built Environment Identifying & treating ↑ Cholesterol or Hypertension Smoking cessation • Lipid Lowering • Aspirin • Beta blockers • ACE-inhibitors • Appropriate revascularization
 TREATMENT, 95% of Resources High- Risk Treatment Intervention Approaches Policy and Environmental Change Behavior Change Risk Factor Detection and Control Emergency Care or Acute Case Management Rehabilitation or Long-term Case Management End-of-Life Care PREVENTION, 5% of Resources
 Greatest Gains in Preventing CVD: Population Approach Optimal Distribution Present Distribution % of Population High Risk 10 Year Cardiovascular Disease Risk
 Swimming Upstream En erg y. S Simple Lifestyle Intervention av ing De vic ood es Fast F To ba cco Ad v ert isin g
 A Societal Pathophysiologic Pathway for COR HT DIS RURAL LIFESTYLE Proximal Determinants of Behaviour • urban structure & mechanization • Food & Tobacco policy • Cultural attitudes • Social/Education • Global influences URBAN LIFESTYLE - • Consumption Obesity of energy rich and food other risk • Sedentariness factors (in usual daily activities) • Psychosocial factors Modifying influences: • Healthcare • Genes • Knowledge & Attitudes Clinical Events ++ Yusuf et al. Circ 2001
 Prevention of Cardiovascular Disease: Population Approach GOAL Type of Strategy Determinants of Risk Behaviours in a Population Individuals with Risk Factors for CVD Individuals with CVD Interventions with a Socio-Economic & Political Focus Interventions with a Preventive Focus Interventions with a Clinical Focus • Identifying & treating ↑ Cholesterol or Hypertension • Lipid Lowering • Aspirin • Beta blockers • ACE-inhibitors • Appropriate revascularization • Taxing Tobacco Examples • Subsidizing healthy foods • Promote Physical Activity by improving Built Environment • Smoking cessation
 Intervening on the causes of CV risk factors
 % % %") Change in commuting patterns in the US (from 1980 to 2000) % % % % Commuting in America III - A Pisarski, American Highway Users Alliance: Census Bureau
Change in commuting patterns in the US (from 1980 to 2000) % % % % Commuting in America III - A Pisarski, American Highway Users Alliance: Census Bureau
") Leading risk factors for disease burden in 2000 by development category (% total DALYS) Developed Countries Tobacco – 12. 2% Blood pressure – 10. 9% Alcohol -9. 2% Cholesterol – 7. 6% Overweight – 7. 4% Low Fruit and Vegetable Intake – 3. 9% Physical Inactivity – 3. 3% Illicit Drugs – 1. 8% Unsafe Sex – 0. 8% Developing Countries Underweight – 14. 9% Unsafe Sex – 10. 2 Unsafe Water, Hygiene – 5. 5% Indoor Smoke – 3. 6% Zinc Deficiency – 3. 2% Iron Deficiency – 3. 1% Vitamin A Deficiency – 3. 0% Blood Pressure – 2. 5% Tobacco – 2. 0%
Leading risk factors for disease burden in 2000 by development category (% total DALYS) Developed Countries Tobacco – 12. 2% Blood pressure – 10. 9% Alcohol -9. 2% Cholesterol – 7. 6% Overweight – 7. 4% Low Fruit and Vegetable Intake – 3. 9% Physical Inactivity – 3. 3% Illicit Drugs – 1. 8% Unsafe Sex – 0. 8% Developing Countries Underweight – 14. 9% Unsafe Sex – 10. 2 Unsafe Water, Hygiene – 5. 5% Indoor Smoke – 3. 6% Zinc Deficiency – 3. 2% Iron Deficiency – 3. 1% Vitamin A Deficiency – 3. 0% Blood Pressure – 2. 5% Tobacco – 2. 0%
 Finland’s Decline in CHD Mortality over 20 years ↓ Dairy Product, ↑ Vegetables, ↓ Salt, ↓Animal fats National Strategy BMJ. 1994 Jul 2; 309(6946): 23 -7
 Decline in Risk Factors in men in Finland Men aged 35 – 63 BMJ. 1994 Jul 2; 309(6946): 23 -7
 How can we prevent 90% of MI by 2030? 1. Some “causal” risk factors that are modifiable [such as HDL (Apo. A), abdominal obesity, hip size, diabetes] need to be changed and demonstrated to reduce CHD 2. LARGE reductions in multiple risk factors are needed 3. Practically ALL adults in Urbanized Societies have abnormalities of at least one risk factor. • Treat all? (e. g. Polypill) • Prevent the development of risk factors (Societal interventions - i. e. tobacco policy, community re-design, food supply)
 Canadian Landscape • Need for Public Health Programs to unite against CV Risk Factors (which overlap with Cancer RF’s) • Partnerships at multiple policy levels (National, Provincial, Regional) • Need for Target setting and Evaluation of Progress Robinson et al 2007