ff88e63ef286daf3570c7008bcac14b1.ppt
- Количество слайдов: 25


Capital Budgeting and Financial Planning Course Instructor: M. Jibran Sheikh Contact info: jibransheikh@comsats. edu. pk

Country Risk Premiums • Historical risk premiums are almost impossible to estimate with any precision in markets with limited history - this is true not just of emerging markets but also of many Western European markets. • For such markets, we can estimate a modified historical premium beginning with the U. S. premium as the base: – Relative Equity Market approach: The country risk premium is based upon the volatility of the market in question relative to U. S market. Country risk premium = Risk Premium. US* Country Equity / US Equity – Country Bond approach: In this approach, the country risk premium is based upon the default spread of the bond issued by the country. Country risk premium = Risk Premium. US+ Country bond default spread – Combined approach: In this approach, the country risk premium incorporates both the country bond spread and equity market volatility.

Estimating Firm Exposure to Country Risk • Different companies should be exposed to different degrees to country risk. For instance, a Brazilian firm that generates the bulk of its revenues in the United States should be less exposed to country risk in Brazil than one that generates all its business within Brazil. • The factor “l”(Lambda) measures the relative exposure of a firm to country risk. One simplistic solution would be to do the following: l = % of revenues domesticallyfirm/ % of revenues domesticallyavg firm For instance, if a firm gets 35% of its revenues domestically while the average firm in that market gets 70% of its revenues domestically l = 35%/ 70 % = 0. 5 • There are two implications – A company’s risk exposure is determined by where it does business and not by where it is located – Firms might be able to actively manage their country risk exposures

Country equity risk premium in the estimation of the cost of equity for a Project located in a developing market • Using the CAPM to estimate the cost of equity is problematic in developing countries because beta does not adequately capture country risk. • To reflect the increased risk associated with investing in a developing country, a country risk premium is added to the market risk premium when using the CAPM. • The general risk of the developing country is reflected in its sovereign yield spread. • Sovereign yield spread is the difference in yields between the developing country's government bonds (denominated in the developed market's currency) and developed country’s Treasury bonds of a similar maturity.

Country equity risk premium in the estimation of the cost of equity for a Project located in a developing market • To estimate an equity risk premium for the country, adjust the sovereign yield spread by the ratio of volatility between the country's equity market and its government bond market (for bonds denominated in the developed market's currency). • A more volatile equity market increases the country risk premium, other things equal. • The revised CAPM equation is stated as: Where: CRP = country risk premium ke = RF + β[E(Rm)-RF+CRP]

Calculating CRP = sovereign yield spread x Annualized standard deviation of equity index of developing country Annualized standard deviation of sovereign bond market (denominated in developed country’s currency) Where: Sovereign yield spread = difference between the yields of government bonds in the developing country and Treasury bonds of similar maturities of developed country

CRP: Example Robert Rodriguez, an analyst with Omni Corporation, is estimating a country risk premium to include in his estimate of the cost of equity for a project Omni is starting in Venezuela. Rodriguez has compiled the following information for his analysis: • Venezuelan U. S. dollar-denominated 10 -year government bond yield = 8. 6% • 10 -year U. S. Treasury bond yield = 4. 8% • Annualized standard deviation of Venezuelan stock index = 32% • Annualized standard deviation of Venezuelan U. S. dollardenominated 10 -year government bond = 22% • Project beta = 1. 25 • Expected market return = 10. 4% • Risk-free rate = 4. 2% Calculate the country risk premium and the cost of equity for Omni’s Venezuelan project.

Solution CRP = sovereign yield spread x Annualized standard deviation of equity index of developing country Annualized standard deviation of sovereign bond market (denominated in developed country’s currency) CRP = (0. 086 -0. 048)(0. 32/0. 22) = 0. 038(0. 32/0. 22) = 0. 0553 = 5. 53% Cost of equity: ke = RF + β[E(Rm)-RF+CRP] = 0. 042 + 1. 25[0. 104 - 0. 042 + 0. 0553] = 0. 042 + 1. 25 [0. 1173] = 0. 1886 or 18. 86%

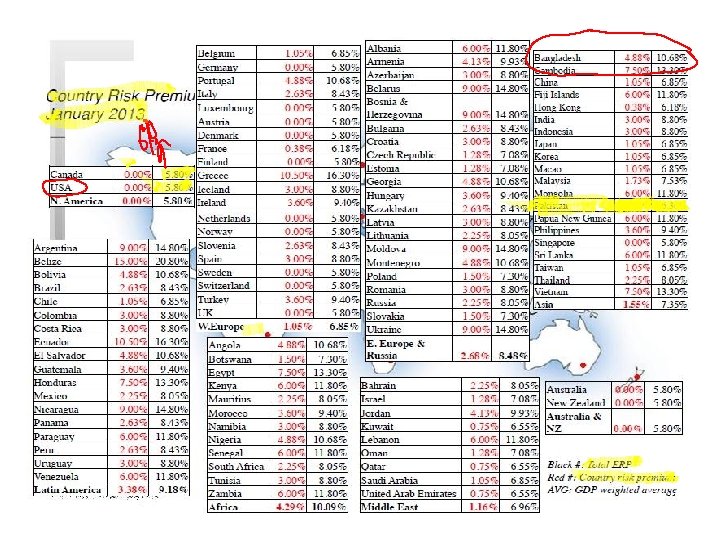
Country Risk Premiums January 2012 Canada United States of America Argentina Belize Bolivia Brazil Chile Colombia Costa Rica Ecuador El Salvador Guatemala Honduras Mexico Nicaragua Panama Paraguay Peru Uruguay Venezuela 6. 00% 15. 00% 12. 00% 8. 63% 7. 05% 9. 00% 18. 75% 10. 13% 9. 60% 13. 50% 8. 25% 15. 00% 9. 00% 12. 00% 9. 60% 12. 00% Austria [1] Belgium [1] Cyprus [1] Denmark Finland [1] France [1] Germany [1] Greece [1] Iceland Ireland [1] Italy [1] Malta [1] Netherlands [1] Norway Portugal [1] Spain [1] Sweden Switzerland United Kingdom Angola Botswana Egypt Mauritius Morocco Namibia South Africa Tunisia 6. 00% 7. 05% 9. 00% 6. 00% 9. 60% 7. 50% 6. 00% 10. 13% 7. 28% 6. 00% 10. 88% 7. 50% 13. 50% 8. 63% 9. 60% 9. 00% 7. 73% 9. 00% Albania Armenia Azerbaijan Belarus Bosnia and Herzegovina Bulgaria Croatia Czech Republic Estonia Georgia Hungary Kazakhstan Latvia Lithuania Moldova Montenegro Poland Romania Russia Slovakia Slovenia [1] Ukraine 12. 00% 10. 13% 9. 60% 15. 00% 13. 50% 8. 63% 9. 00% 7. 28% 10. 88% 9. 60% 8. 63% 9. 00% 8. 25% 15. 00% 10. 88% 7. 50% 9. 00% 8. 25% 7. 28% 13. 50% Bahrain 8. 25% Israel 7. 28% Jordan 10. 13% Kuwait 6. 75% Lebanon 12. 00% Oman 7. 28% Qatar 6. 75% Saudi Arabia 7. 05% Senegal 12. 00% United Arab Emirates 6. 75% Bangladesh Cambodia China Fiji Islands Hong Kong India Indonesia Japan Korea Macao Malaysia Mongolia Pakistan Papua New Guinea Philippines Singapore Sri Lanka Taiwan Thailand Turkey Vietnam Australia New Zealand 10. 88% 13. 50% 7. 05% 12. 00% 6. 38% 9. 00% 9. 60% 7. 05% 7. 28% 7. 05% 7. 73% 12. 00% 15. 00% 12. 00% 10. 13% 6. 00% 12. 00% 7. 05% 8. 25% 10. 13% 12. 00% 6. 00%

Look at a country’s bond rating and default spreads • Ratings agencies assign ratings to countries that reflect their assessment of the default risk of these countries. These ratings reflect the political and economic stability of these countries and thus provide a useful measure of country risk. – In May 2009, the local currency rating, from Moody’s, for Brazil was Ba 1. In May 2009, Brazil had dollar denominated 10 -year Bonds, trading at an interest rate of 6%. The US treasury bond rate that day was 3. 5%, yielding a default spread of 2. 50% for Brazil. – India has a rating of Ba 2 from Moody’s but has no dollar denominated bonds. The typical default spread for Ba 2 rated sovereign bonds is 3%. • Many analysts add this default spread to the US risk premium to come up with a risk premium for a country. This would yield a risk premium of 6. 38% for Brazil and 6. 88% for India, if we use 3. 88% as the premium for the US.

Updated Default Spreads – January 2012 Rating 1 year Aaa/AAA 0. 35% Aa 1/AA+ 0. 45% Aa 2/AA 0. 50% Aa 3/AA 0. 60% A 1/A+ 0. 65% A 2/A 0. 80% A 3/A 0. 95% Baa 1/BBB+ 1. 20% Baa 2/BBB 1. 30% Baa 3/BBB- 2. 00% Ba 1/BB+ 4. 00% Ba 2/BB 4. 50% Ba 3/BB 4. 75% B 1/B+ 5. 75% B 2/B 6. 25% B 3/B 6. 50% Caa/CCC 7. 25% CC 8. 00% C 9. 00% D 10. 00% 5 year 0. 70% 0. 75% 0. 80% 0. 85% 0. 90% 1. 05% 1. 25% 1. 70% 2. 05% 2. 80% 4. 00% 5. 50% 5. 75% 6. 75% 7. 75% 9. 00% 9. 25% 9. 50% 10. 00% 12. 00% 10 year 0. 65% 0. 80% 0. 95% 1. 05% 1. 15% 1. 20% 1. 45% 2. 00% 2. 30% 3. 10% 3. 75% 4. 50% 4. 75% 5. 50% 6. 75% 8. 75% 9. 50% 10. 50% 12. 00% 30 year 0. 85% 1. 10% 1. 15% 1. 20% 1. 30% 1. 40% 1. 65% 2. 20% 2. 50% 3. 25% 3. 75% 4. 75% 5. 25% 5. 50% 6. 00% 6. 25% 8. 25% 9. 50% 10. 50% 12. 00%

Beyond the default spread • • While default risk spreads and equity risk premiums are highly correlated, one would expect equity spreads to be higher than debt spreads. In fact, one simple way to adjust the default spread for the additional risk in the equity market is to multiply it by the relative volatility (standard deviation of equities/ standard deviation of government bond) Risk Premium for Brazil in early 2009 – – – Standard Deviation in Bovespa (Equity) = 34% Standard Deviation in Brazil $ denominated Bond = 21. 5% Default spread on $ denominated Bond = 2. 5% Country Risk Premium (CRP) for Brazil = 2. 5% (34%/21. 5%) = 3. 95% Total Risk Premium for Brazil = US risk premium (in ‘ 09) + CRP for Brazil = 3. 88% + 3. 95% = 7. 83% Recall the CRP formula in earlier slides

Estimating the Cost of Debt • The cost of debt is the rate at which you can borrow at currently, It will reflect not only your default risk but also the level of interest rates in the market. • The cost of debt is not the rate at which you borrowed money historically. That is why you cannot use the book cost of debt in the cost of capital calculation. • The two most widely used approaches to estimating cost of debt are: – Looking up the yield to maturity on a straight bond outstanding from the firm. The limitation of this approach is that very few firms have long term straight bonds that are liquid and widely traded – Looking up the rating for the firm and estimating a default spread based upon the rating. While this approach is more robust, different bonds from the same firm can have different ratings. You have to use a median rating for the firm

Estimating the Cost of Debt Using Synthetic Rating • While ratings seem like useful tools for coming up with the cost of debt, there can be problems: – A firm may have no publicly traded debt. – A firm can have multiple ratings. You need a rating across all of a firm’s debt, not just its safest. – While many companies have bonds outstanding, corporate bonds often have special features attached to them and are not liquid, making it difficult to use the yield to maturity as the cost of debt. – A firm’s bonds can be structured in such a way that they can be safer than the rest of the firm’s debt - they can be more senior or secured than the other debt of the firm. • The alternative is to estimate a synthetic rating for your firm and determine the cost of debt based upon that rating.

Estimating Synthetic Ratings • The rating for a firm can be estimated using the financial characteristics of the firm. In its simplest form, the rating can be estimated from the interest coverage ratio Cov. Ratio > 8. 50 6. 50 - 8. 50 5. 50 - 6. 50 4. 25 - 5. 50 3. 00 - 4. 25 2. 50 - 3. 00 2. 00 - 2. 50 1. 75 - 2. 00 1. 50 - 1. 75 1. 25 - 1. 50 0. 80 - 1. 25 0. 65 - 0. 80 0. 20 - 0. 65 < 0. 20 Est. Bond Rating AAA AA A+ A A– BBB BB B+ B B– CCC CC C D

Estimating Synthetic Ratings • Interest Coverage Ratio = EBIT / Interest Expenses • Consider two firms, Company Y and Company Z • For Company Y EBIT = $161 MM Interest Expense = $48 MM Interest Coverage Ratio = • For Company Z EBIT = $55, 467 MM Interest Expense = $4, 028 MM Interest Coverage Ratio =

Estimating Synthetic Ratings • Interest Coverage Ratio = EBIT / Interest Expenses • Consider two firms, Company Y and Company Z • For Company Y EBIT = $161 MM Interest Expense = $48 MM Interest Coverage Ratio = 161/48 = 3. 33 • For Company Z EBIT = $55, 467 MM Interest Expense = $4, 028 MM Interest Coverage Ratio = 55, 467/ 4028= 13. 77

Estimating Synthetic Ratings • The rating for a firm can be estimated using the financial characteristics of the firm. In its simplest form, the rating can be estimated from the interest coverage ratio Cov. Ratio Company Z > 8. 50 6. 50 - 8. 50 5. 50 - 6. 50 4. 25 - 5. 50 Company Y 3. 00 - 4. 25 2. 50 - 3. 00 2. 00 - 2. 50 1. 75 - 2. 00 1. 50 - 1. 75 1. 25 - 1. 50 0. 80 - 1. 25 0. 65 - 0. 80 0. 20 - 0. 65 < 0. 20 Est. Bond Rating AAA AA A+ A A– BBB BB B+ B B– CCC CC C D

Estimating Synthetic Ratings • The rating for a firm can be estimated using the financial characteristics of the firm. In its simplest form, the rating can be estimated from the interest coverage ratio Cov. Ratio Company Z > 8. 50 6. 50 - 8. 50 5. 50 - 6. 50 4. 25 - 5. 50 Company Y 3. 00 - 4. 25 2. 50 - 3. 00 2. 00 - 2. 50 1. 75 - 2. 00 1. 50 - 1. 75 1. 25 - 1. 50 0. 80 - 1. 25 0. 65 - 0. 80 0. 20 - 0. 65 < 0. 20 Est. Bond Rating AAA AA A+ A A– BBB BB B+ B B– CCC CC C D Spread 0. 50% 0. 65% 0. 85% 1. 00% 1. 10% 1. 60% 3. 35% 3. 75% 5. 00% 5. 25% 8. 00% 10. 00% 12. 00% 15. 00%

Estimating Synthetic Ratings • Assuming the appropriate Risk Free Rate is 4. 71%. . . – Company Y’s Cost of Debt is 5. 81% (4. 71% + 1. 10%) – Company Z’s Cost of Debt is 5. 21% (4. 71% + 0. 50%) Cov. Ratio Est. Bond Rating Spread AAA 0. 50% Company Z > 8. 50 6. 50 - 8. 50 AA 0. 65% 5. 50 - 6. 50 A+ 0. 85% 4. 25 - 5. 50 A 1. 00% A– 1. 10% Company Y 3. 00 - 4. 25 2. 50 - 3. 00 BBB 1. 60% 2. 00 - 2. 50 BB 3. 35% 1. 75 - 2. 00 B+ 3. 75% 1. 50 - 1. 75 B 5. 00% 1. 25 - 1. 50 B– 5. 25% 0. 80 - 1. 25 CCC 8. 00% 0. 65 - 0. 80 CC 10. 00% 0. 20 - 0. 65 C 12. 00% < 0. 20 D 15. 00%

Historic Spreads The Default Spread is the amount above the Risk Free Rate at the applicable time. Ratio > 8. 50 6. 50 - 8. 50 5. 50 - 6. 50 4. 25 - 5. 50 3. 00 - 4. 25 2. 50 - 3. 00 2. 00 - 2. 50 1. 75 - 2. 00 1. 50 - 1. 75 1. 25 - 1. 50 0. 80 - 1. 25 0. 65 - 0. 80 0. 20 - 0. 65 < 0. 20 Est. Rating AAA AA A+ A 1. 00% A– BBB BB B+ B 3. 25% B – CCC CC C 7. 50% D Spread(1/99) 0. 20% 0. 50% 0. 80% 1. 25% 1. 50% 2. 00% 2. 50% 6. 50% 4. 25% 5. 00% 6. 00% 12. 70% 10. 00% Spread(1/01) 0. 75% 1. 00% 1. 50% 2. 00% 2. 25% 3. 50% 4. 75% 8. 00% 10. 00% 11. 50% 15. 00%

Cost of Debt computations • When estimating the cost of debt for an emerging market company, you have to decide whether to add the country default spread to the company default spread when estimating the cost of debt. • Companies in countries with low bond ratings and high default risk might bear the burden of country default risk – For example, if Company Y is in such a country and the Country Default Risk is estimated as 5. 25%, the rating estimated of A- yields a cost of debt as follows: = US T. Bond rate + Country default spread + Company Default Spread = 4. 71% + 5. 25% + 1. 10% = 11. 06%

Estimating A U. S. $ Cost of Capital for a Foreign Firm • Equity Mature Market Premium Country Risk Premium for Argentina – Cost of Equity = 4. 71% + 0. 71 (4. 5% +10. 53%) = 15. 38% – Market Value of Equity = 995 million (94. 40%) • Debt – Cost of debt = 4. 71% + 5. 25% (Country default) +1. 10% (Company default) = 11. 06% – Market Value of Debt = 59 Mil (5. 60%) • Cost of Capital = 15. 38 % (. 9440) + 11. 06% (1 -. 3345) (. 0560)) = 15. 38 % (. 9440) + 7. 36% (. 0560) = 15. 70 %

What About Large Multinationals? • For smaller, less well known firms, it is safer to assume that firms cannot borrow at a rate lower than the countries in which they are incorporated. For larger firms, you could make the argument that firms can borrow at lower rates. In practical terms, you could ignore the country default spread or add only a fraction of that spread.
ff88e63ef286daf3570c7008bcac14b1.ppt