fc12415284f00565dc50aca8c7d30067.ppt
- Количество слайдов: 152


Canadian Business Trust Betty Ho Stephen Wasmuth Greg Logan Stella Li
 on October")
Canadian Business Trust Agenda: Ø Introduction Ø Event (pre-October 31 st 2006) on October 31 st

Business Trusts to be Analyzed § Stephen – Inter Pipeline Fund § Greg – Yellow pages Income Fund § Stella – Boston Pizza Royalty Fund

Introduction of Income Trust A legal entity traded on securities exchange like stocks ending with the. UN symbol l Hold income-producing assets l Debt or Equity instruments l Royalty Interests l Real Properties l Monthly or quarterly distribution (6%-30% annually) in the form of interest, royalty or lease payments l Payout to investors on a tax-efficient basis l Also known as Income Funds, Unit Trusts, Investment Trusts l
 1986 -1997 Energy")
History of Income Trusts 1985 First business trust conversion(Enermark Income Fund) 1986 -1997 Energy trusts and REIT trusts 1998 -2000 Trust was neglected 2001 Income trust rediscovered 2002 S&P and TSX commenced 3 Trust Indices 2003 -2004 Establishment of limited liability 2005 -2006 S&P announces inclusion of trusts in S&P/TSX Composite Index

History of Income Trusts Graph from TSX website

History of Income Trusts Chart taken from globeinvestor

Types of Income Trust 1. Business Trusts 2. REITs 3. Resource Trusts 4. Utility Trusts Proportion of trusts per type based on Total number of trusts = 247

Characteristics of an Business Income Trust l Mature business cycle l Require limited capital maintenance l Stable cash flows (cash/trust units) l Companies with basic sets of transactions, year after year

Businesses that are Income Trusts

Typical Investors of Income Trust Large investor groups (Canadian Pension Plan /Ontario Teachers Pension Plan) l Individual investors l Those who want stable cash flow l Retirees or baby boomers preparing for retirement l

How Does it Operate? Unitholders provide funds to the trust. The trust uses these funds to invest in income generating assets. The asset pays a return to the trust. Trust Unitholders receive cash distributions and return on capital Corporation Figure taken from www. fin. ge. ca

Reasons to Invest in Income Trusts l Potential higher yield than bonds l The flow-through tax-efficient structure generally gives higher distributions than dividends l It provides income distribution and potential gain in value l When interest rates are low

Reasons to Convert to Income Trust l Reduction in corporate tax l Raise capital while retaining control l Deleveraging l Management discipline l More efficiency in cash flow allocation l Elimination of “adverse investment incentives” l An announce of intention to convert can increase share price

Reasons to convert to Income Trust

Risks for Investors l Lack of Diversification l Surrendering growth opportunity l No guarantees in distributions or return on capital l Sustainable tax benefits is not certain l Limited liability l Volatility

Risks for Converting Companies l Slow down in growth opportunity l Interest rate movements l Compatibility with business industry l Companies may need to retain some capital
 l Canadian Securities Administrators (CSA)")
Governance of Business Trusts l Declarations of trust (DOTs) l Canadian Securities Administrators (CSA) l Policy l Interim 41 -201 and annual MD&A l Ontario’s Securities Act l Internal audit committee

Declaration of Trust l Defined: An agreement between the trustees of the trust l Type of business l Operation of trust l Rights of unitholders l Rules and provisions

National Policy 41 – 201 Income Trusts and Other Indirect Offerings l Purpose: to indicate how existing regulations apply to non-corporate issuers l Provides guidance and recommendations on disclosure, accountability and liability for insider trading l Vendor liability l Stability ratings l Prospectus disclosure

Disclosure and Prospectus Requirements l l l l Required – Public companies/sole holder of majority of units Source of funding (current and future) Specific risk l Impact of risk l Approaches to diminish risk Goodwill calculation Executive compensation Restrictive financial covenant Done on a timely basis

Taxation of Income Trust - Basics Resident Unitholders Non-resident Unitholders Tax-exempt Unitholders Income from trust = $39 Tax (38%) = $14. 82 Income from trust = $22 Tax (15%) = $3. 30 Income from trust = $39 Tax (0%) = $0 Trust Income from corp. = $100 Tax (45%) = $0 Corporation Business income = $100 Tax (35%) = $0

Taxation of Income Trust Corporate Structure Income Trust $35. 00 NIL Taxable Canadian $5. 70 $14. 82 Non-resident $2. 15 $3. 30 Tax-exempt N/A $42. 85 $18. 12 Entity level Investor level Total tax Example from www. fin. gc. ca

Taxation of Income Trust Income Tax Act under Mutual Funds retained in trusts are taxed heavily l Federal tax = 29% l Provincial tax = 45% average (on federal tax payable) l Ex. if earnings were $100, federal tax=$29; provincial tax is 45% x $29=$13. 05 l Funds retained in companies are taxed at corporates l Trust can payout higher than their income in the form of dividends l

Issues l Loss in tax revenue l Growth in Canada l Others

Canadian Business Trust Issues – Loss in tax revenue Estimated loss in revenue of $300 million l Government action l Increase tax on trust l Limit amount of trust investment in pension funds l Increase Dividend Tax Credit l l Market response Lost of $23 billion l Recovered l l Jack Mintz of University of Toronto vs. CAIF

Canadian Business Trust Issues – Growth in Canada l “Trust misallocate capital, the savings of Canadians and that capital is the primary source of our economic growth” ~Peter Godsoe, former chairman and CEO of Bank of Nova Scotia l Canada’s l No competitiveness at danger retained earning for capital expenditures (plant/equipment/technology)

Canadian Business Trust Issues – others l l Disclosures and Accounting methods l 85% of business trust have accounting issues l CSA reports l Trust funding distributions through L/T credit facilities and reserves Management must match distribution l Yield are matched to competitors l Not according to corporate model Lack of flexibility in management l Good? l Debt covenants are not required to be disclosed High yields are comparable to junk bonds l “Canadian junk trust market”

“Tax Fairness Plan” l Distribution Tax l Decrease in Corporate Income Tax of 0. 5% in 2011 l Increase in Age credit amount by $1000 l Permission for income splitting for pensioners starting 2007
 When trust is resident")
“Tax Fairness Plan” – Distribution Tax “Specific Investment Flow-Through” (SIFT) When trust is resident of Canada l Trust units are of OR have investments in a stock exchange or other public market l When the trust holds one or more “non-portfolio properties” l Ø l Canadian Corporation, Resource properties, Timber Resource properties and Real properties, investments (2 conditions) Non-portfolio earnings Business income in Canada l Income or capital gains from “non-portfolio properties” l Not dividends received l No more deduction allowed l

“Tax Fairness Plan” – Distribution Tax Table 6: SIFT Tax Rates: Distributed Non-Portfolio Earnings, 2007 -2011 (percent) 2007 2008 2009 2010 2011 Basic rate (federal) 21. 0 20. 5 20. 0 19. 0 18. 5 Additional rate (in lieu of provincial tax) 13. 0 Total 34. 0 33. 5 33. 0 32. 0 31. 5 Table from www. fin. bc. ca **Those amount that is not distributed will be taxed at the ordinary federal and provincial rate.

“Tax Fairness Plan” Decrease of Corporate Income Tax rate. Table 3: Federal Corporate Income Tax Rates, 2007 -2011 (percent) 2007 2008 2009 2010 2011 General corporate income tax rate 21. 0 20. 5 20. 0 19. 0 Proposed rates 21. 0 20. 5 20. 0 19. 0 18. 5 Table from www. fin. bc. ca

“Tax Fairness Plan” Increase of Age credit l Only significant for 65 years or older l Increase of phase out rate l Help low to middle class seniors

“Tax Fairness Plan” Pension income splitting l Allow those that qualify for pension income tax credit to transfer this credit to spouse
 l This applies")
“Tax Fairness Plan” l New Income Trusts (after Oct 31, 2006) l This applies on 2007 taxation year l Existing l This Income Trusts applies on 2011 taxation year

“Tax Fairness Plan” Table 2: Simplified Comparison of Investor Tax Rates in 2011 New System Current System Investor FTE Large (Non. Corporation Portfolio (Dividend) Earnings) FTE (Income) Large Corporation (Dividend) Taxable Canadian (*) 46% 45. 5% Canadian tax -exempt 0% 32% 31. 5% Taxable U. S. investor (**) 15% 42% 41. 5% Table from www. fin. bc. ca

Impact of “Tax Fairness Plan”

Impact of “Tax Fairness Plan”

“Tax Fairness Plan”
 Year 2006 (Q 3) 2005 2004 2003 2002 2001")
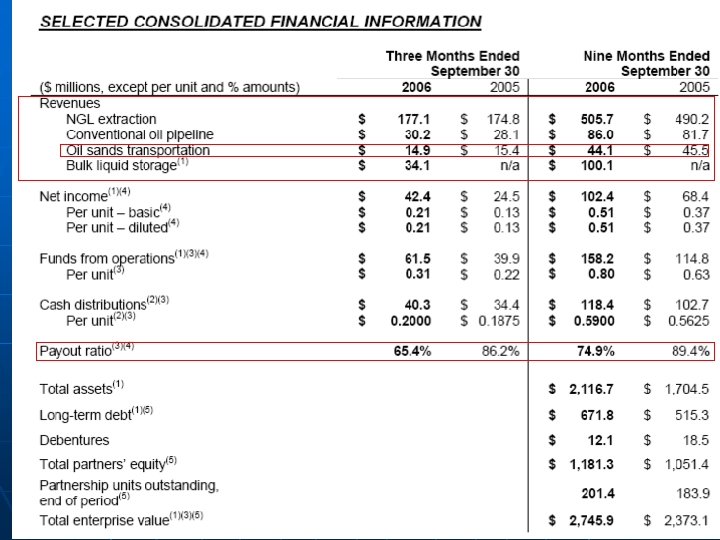
Inter Pipeline Fund (IPL. UN) Year 2006 (Q 3) 2005 2004 2003 2002 2001 Units outstanding (Millions) 201. 4 180 128 73. 2 Market Cap $1. 7 Billion
 P/E≈ 15 P/E = 12. 20 P/E Expansion?")
IPL. UN – One Year (Daily) P/E≈ 15 P/E = 12. 20 P/E Expansion?
 Earnings Growth?")
IPL. UN – 5 year (weekly) Earnings Growth?

Company Overview n n Created 1997 in Calgary Alberta Owns and Operates four business segments: • Conventional Gathering • Oil Sands Transportation • NGL Extraction • Simon Storage Limited

Conventional Gathering • Transported approx. 201, 400 b/d of crude in 2005 • Moves crude oil from producer owned batteries and truck terminals to key market hubs is Alberta and Saskatchewan.

Oil Sands Transportation n Sole transporter of Cold Lake bitumen production. It has the capacity to transport 435, 000 b/d Can be cost effectively expanded to 705, 000 b/d.

NGL Extraction n n Processes pipeline quality natural gas to remove natural gas liquids (NGL) comprised of ethane, propane, butanes and pentanes-plus Uses shrinkage gas, profit comes from spread between selling all NGL’s seperately and the cost Shrinkage Gas.

NGL Extraction con’t n n Inter Pipeline's extraction business consists of 100% ownership interests in the Cochrane and Empress II Plants and a 50% ownership interest in the Empress V Plant NGL’s are generally used directly as an energy product and as a feedstock for the petrochemical and crude oil refining industries.

Simon Storage Limited n n n Wholly owned subsidiary of Inter Pipeline Fund Multi site operator of bulk liquid storage, handling and distribution in the United Kingdom, Germany and Ireland On January 1, 2006 Simon acquired Tanklager-Gesellschaft (TLG) (2 nd largest independent petrochemical storage business in germany.

Simon Storage con’t n Also provides complementary services through its bulk liquid trucking, engineering, training and facilities management divisions.

Directors and Officers n n n David W. Fesyk President and CEO Highlights: • 20 years experience in industry • Responsible for doubling the size of the company with the Cold Lake Pipeline acquisition. • Bachelors in Earth Science, Arizona State, 1984 • MBA from University of Calgary in 1993.

Directors and Officers n n John F. Driscoll Director & Chairman of the Board since October 22, 2002 Founder of JF Driscoll Investment Corp. , where he has served as President since 1981. Many years of advising, managing, and consulting services in the oil and natural gas industry.

Steady Growth Purchase of Simon Storage Purchase of NGL plants
 n n n Purchased Simon Storage for $250 million and TGL")
Key Accomplishments (2005) n n n Purchased Simon Storage for $250 million and TGL for $38 million Entered 20 -year contract with Greenergy Biofuel Ltd. To store and handle biofuel products at the Simon Storage Immingham facilities. Established a new $500 million revolving credit facility to provide greater financial flexibility.

Strategies for future growth n Expand storage segment in Europe • Not clear if this will be through new developments or more acquisitions n Organic Growth and Development • Conventional Oil Pipelines: Improve operating efficiencies, not volume (mature region) n New oil battery connections, better infrastructure, more efficient pumps • NGL Extraction: Improve NGL recovery rates • Oil Sands Transportation: Expand capacity to meet future needs of Imperial Oil, En. Cana, and CNR.

Where they plan to put there money n n Putting larger amount (proportionate to earnings) into oil sands and Europe. GOOD. Investing in areas of highest growth potential

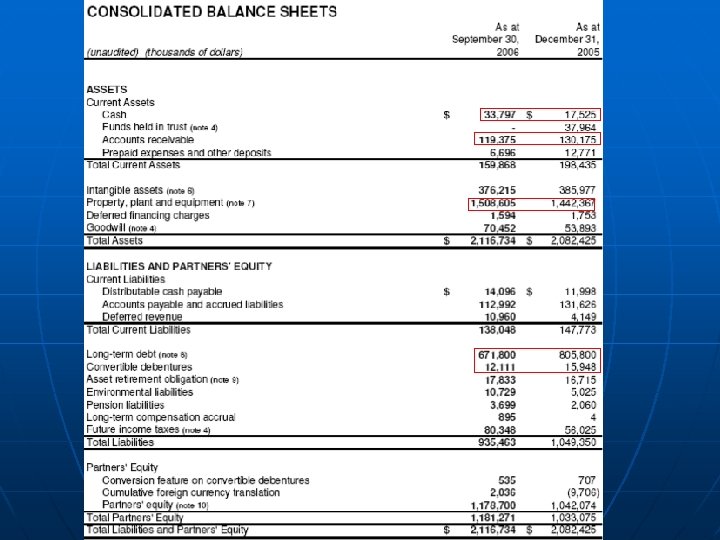
2005 Balance Sheet

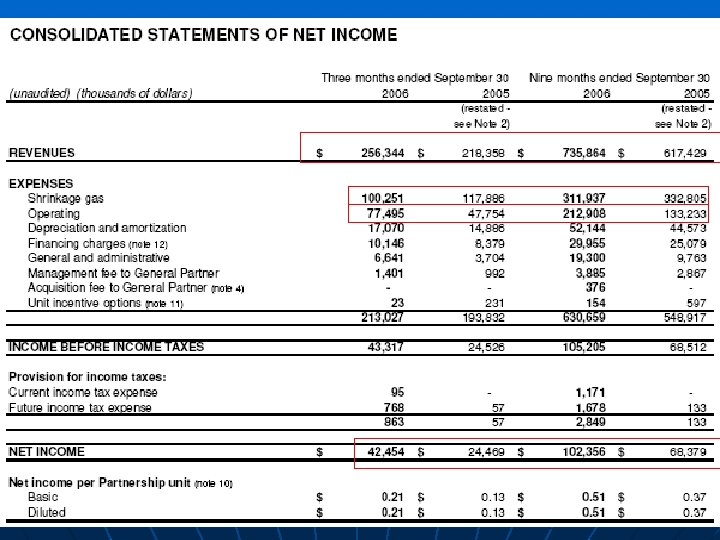
2005 Income Statement 60% of Expenses

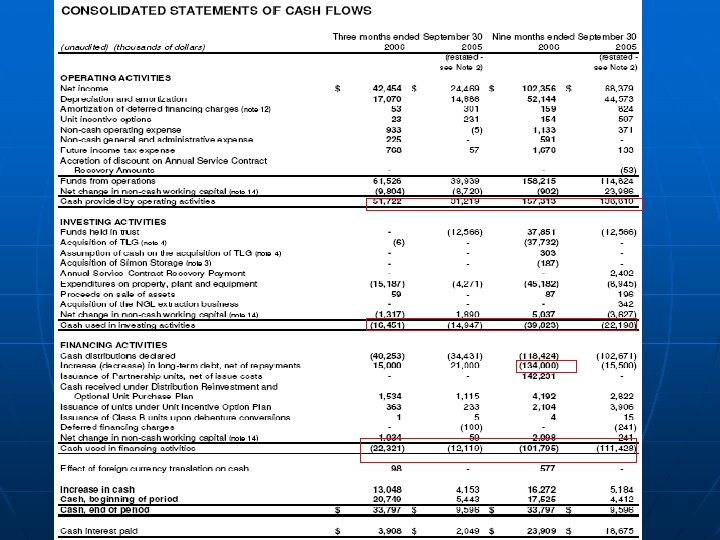
2005 Statement of Cash Flows

Industry Comparison Ratio IPL. UN Industry P/E 12. 20 19. 01 ROE ROA D/E 11. 97 7. 05. 58 12. 88 18. 37 8. 51 1. 04 -3, 318. 08 Net Profit Margin Taken from www. reuters. com
 (millions of dollars) NGL Contracts (4.")
Note on Hedging Activity Hedge Profit / (Loss) (millions of dollars) NGL Contracts (4. 1) Natural Gas Contracts (12. 0) Foreign Currency 0. 1 Heat Rate Swap (0. 3) Electricity Price Swap 0. 9 Interest Rate Swaps 4. 3 Total Unrecognized P/L (11. 1)

Conclusions n Financially sound • Growing profits, intelligent acquisitions, clear and informative financials n n Recently undervalued due to external factors (fair tax law). Positioned to make money in oil sands and oil service industry for many years into the future.


Basic Financials As of November 10, 2006 • • • Yellow Pages Income Fund Listed on: TSX Symbol: YLO. UN-T Price: $12. 87 EPS: $0. 70 P/E: 18. 4 Annual Dividend: $1. 09 per unit Monthly Distribution: $0. 08583 per unit Yield: 8. 46%

Basic Financials Cont’ • • • 52 week high: $17. 2 52 week low: $11. 550 Market Cap: $6. 5 Billion # Units outstanding: 532, 000 Over 2000 employees

5 Year Monthly Chart

1 Year Daily Chart

~90% return: IPO to 2005

Agenda • Company Overview – – • • History Management Products/Businesses Strategy Income Trust Model Financial Analysis New Tax Implications Recommendation
 is Canada’s largest directory publisher • YPG")
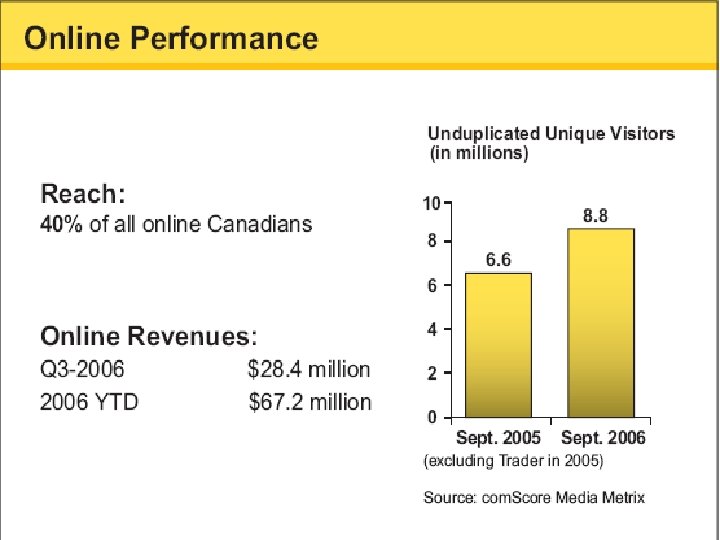
Company Overview • Yellow Pages Group (YPG) is Canada’s largest directory publisher • YPG owns Canada’s most visited online directories: Yellow. Pages. ca, Canada 411. ca, Super. Pages. ca, and Canada. Toll. Free. ca • YPG also owns Canada. Plus. ca: a net work of 7 local sites that include Montreal. Plus. ca, Quebec. Plus. ca, Toronto. Plus. ca, Edmonton. Plus. ca, Ottawa. Plus. ca, and Vancouver. Plus. ca • They are also the exclusive owner of Yellow. Pages, Pages Jaunes, and Walking Fingers Design trademarks in Canada

History • • • YPG published its first directory in 1908 They operated as a division of Bell Canada until 1971 when it was incorporated as Tele-Direct (Publications) Inc. Company initially limited its publishing activities to Canada but by 1980 began expanding into international markets By mid 1990’s the company sold off investments in Hong Kong, Behran, Egypt, Jordan, Cayman Islands, and the US to focus on Canadian Market In 1999 Tele-Direct changed its name to Bell Acti. Media In 2002 Bell Acti. Media sold its directory business: YPG In August 1 2003 YPG, through Yellow Pages Income Fund, completed its initial public offering Yellow Pages Income fund initially owned 30. 6% In June 2004 Yellow Pages Income Fund became 100% owner of YPG

Key Management • Marc P. Tellier - President and CEO – – President and CEO of YPG and CEO of Trader Corporation Previously CEO of Bell Acti. Media Helped complete the largest IPO ever in the income trust sector in 2003 Began with Bell in 1990 after graduating from University of Ottawa with Bachelors in Economics – In 2000 named one of Canada’s “Top forty under forty” • Christian M. Paupe – Executive VP of Corporate Services and CFO – Before Joining YPG, Paupe was Executive VP, Chief Administrative officer, and CFO at Quebecor World Inc. from 1999 -2003 – Harvard MBA and BBA from Royal Military College in St. Jean Quebec • Jean Pascal Lion – VP of Marketing – Was VP of electronic directories up to June 2006 – Was VP of local markets at Sympatico-Lycos Inc – Headed the tem that made Yellow. Pages. ca the #1 online directory in Canada – MBA from Cancordia’s John Molson School of Business

Products and Businesses • Print Directories • Online Directories • Vertical Media: Trader Corp.

Print Directories • YPG Publishes more than 340 Yellow Pages and residential directories • These make for a combined circulation of approximately 30 million copies • Cover 97% of the Canadian population

Print Directories Cont’ • Yellow Pages Directories – Facilitates search for products and services – Host of features such as local attractions, maps, event calendars, entertainment info and more • Yellow Pages Neighborhood Directories – Provide relevant local information for Montreal, Toronto, Vancouver, and Quebec city • Residential Directories – Includes residential and government listings

Online Directories • Yellow. Pages. ca – Online business directory • Pages. Jaunes. ca – French equivalent of Yellow. Pages. ca • Canada 411. ca – Helps to find a person or business in French or English listings • Super. Pages. ca – An extended Version of Yellow. Pages. ca • Canada. Toll. Free. ca – Find any toll free number in Canada • Canada. Sans. Frais. ca – The French equivalent of Cnada. Toll. Free. ca

Online Directories Cont’ • Canada. Plus. ca – A network of 7 local sites as seen below

Trader Corporation • On June 8, 2006 YPG bought all outstanding shares of Trader Corporation for $767 million • Trader is a leader in print and online vertical media • Trader publishes approx 200 publications and 20 websites covering 4 product verticals: automotive, real estate, general merchandise, and employment • Some of the brands include Auto Trader, Buy & Sell, and Homebase • A great acquisition for YPG

YPG Business Strategy • • • Goal: “Yellow Pages Group’s goal in directing and managing its business is to enhance unitholder value and operate with honesty and integrity” Mission: “We are aligning print and online strategies in a continuous effort to find the best seller for each buyer” Basic strategy is differentiation through two avenues 1. Organic growth 2. External growth

Strategy Cont’ • Organic Growth – Enhance and extend print and online product and service offerings – Introduce enhancements to existing product offerings to create new revenue and cross-selling opportunities • External Growth – Invest in or acquire businesses which complement core business – Preference for geographic presence in Canada – Expand into related media that complement YPG’s traditional directory advertising

YPG Core Competencies

YPG’s Key Priorities for 2006 -2007 1. Expand business with national and regional advertisers 2. Continued focus on customer relationship management 3. Extension of the directory category 4. Gain a stronger presence in vertical media

Why Income Trust Model? • YPG is a mature business with relatively high stable, cash flows • YPG’s business holds income producing assets that engage in a similar set of transactions each year • Not too focused on high growth • Assets are stable and long lasting • Converted to avoid paying corporate taxes • Provide higher more frequent distributions to investors than traditional dividends

Corporate Strategy Moves • Supply chain management – Quebecor World Inc – Transcontinental Inc • Acquisitions – MTS Media

$1 Billion Deal with Quebecor World Inc • Signed $1 billion contract on Oct 19, 2006 with Quebecor • Extends directory printing contracts in eastern, western, and central Canada through to 2020 • Cover 300 directory titles • Solidifies long-term supply chain relationship • Quebecor World provides high quality print solutions to leading publishers, retailers, catalogers, and other businesses with advertising activities

$115 Million Trader Contract • On Oct 20, 2006 YPG’s Trader Corp awarded a 10 year contract to Transcontinental Inc • Contract valued at $115 million decomposed into: – $75 million for extension of contract to print vertical guides in the Atlantic provinces, Quebec, and Manitoba – $40 million in new business for Ontario, Saskatchewan, and Manitoba • Secure Traders long term relationship with top printer in Canada • Transcontinental is the largest printer in Canada and ranks as the country’s largest publisher of consumer magazines

MTS Media Acquisition • On Oct 2, 2006 YPG acquired MTS Media from MTS Allstream Inc • $275 million price tag • Makes YPG the #1 directory publisher in Canada’s 10 largest markets • In alignment with external growth strategy • MTS Media is largest directory publisher in Manitoba – Publishes 11 different titles with circulation of 1. 7 million

Financial Analysis

Financial Statements • Annual Statement: 2005 • Quarterly Statements: 2006 3 rd Quarter

Distribution Increase

2006 Distributions

Annual Income Statement • 45% increase in revenue • 126% increase in net earnings

EBITDA Growth

Annual Income Statement Cont’ • EPS up 53% • 124 Million new units issued – Dilution of existing unitholders?

Annual Cash Flow Statement • Cash from operation activities up 42%
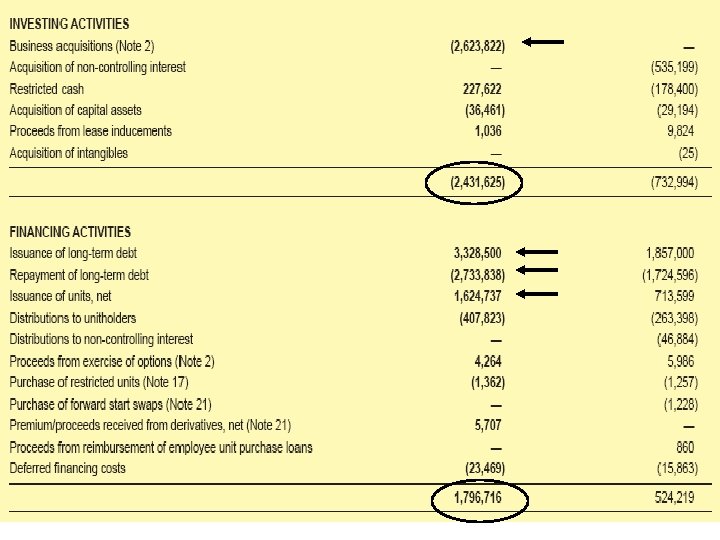

What’s going on? • Investing increased more than 3 times – $2. 6 billion in acquisitions • Results in large financing activities – $3. 2 billion in new debt issued – $1. 6 billion in new equity

Key Annual Metrics

A More Recent Look Q 3 Statements

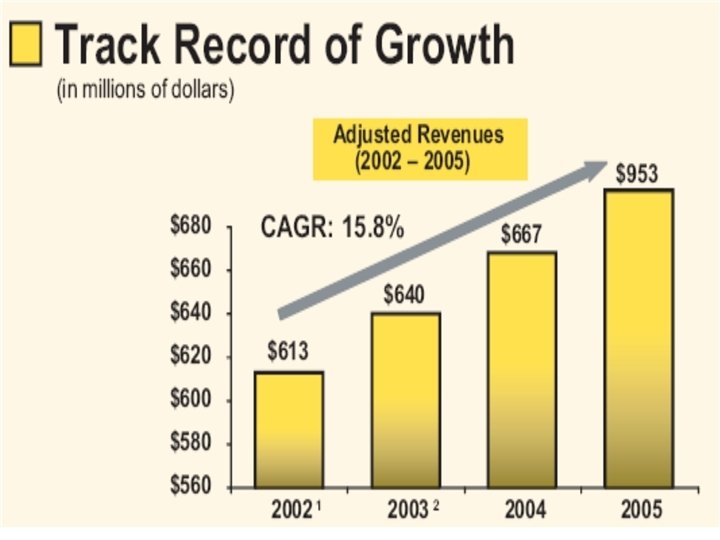
2006 3 rd Quarter Results • Adjusted revenue up 33% • Adjusted EBITDA up 23% • Distributable cash up 11%

Growth

Q 3 Balance Sheet: Assets • Large build up of cash – More Acquisitions on the horizon? • Goodwill Increasing

Q 3 Balance Sheet: L + OE • Large increase in long term debt – More leverage = greater risk • Exchangeable debentures: possible dilution to unitholders

Q 3 Income Statement

Q 3 Income Statement Cont • $0. 8 increase compared with last Q 3 • Large increase in units outstanding

Q 3 Cash Flow Statement

Q 3 Cash Flow Cont

New Tax Announcement • Announcement came Oct 31, 2006 • Government to impose tax on income trust distributions • Existing trusts (YPG) won’t face taxes until 2011

Result of Announcement

A Closer Look • ~20% drop in one day

Implications for YPG • Do not have to pay taxes on distributions until 2011 • YPG still pays the same distributions • YPG may have to consider new business model

Opportunity to buy? • Lower P/E ratio: down from 21. 4 to 18. 4 – Room for multiple growth • • • Distributions remain the same Market may have overreacted YPG showing strong financial numbers Continuing to grow business Units have recovered 5. 5% since announcement

Fisher’s Dimensions • “Superiority in production, marketing, research and financial skills” – – – • Clear, accessible financial statements Continued increase in revenues and earnings Large investment increase and visible brand trademarks “People factor” – – • Experienced management that repeatedly exceed expectations CEO named to “top forty under forty” “Investment Characteristics” – – – • Leader in print directories Leader in online directories #1 in Canada’s 10 largest markets “Price” – – Lower P/E ratio due to tax announcement Drop from 21. 4 to 18. 4

Recommendation


Company Overview As of Nov 24, 2006 Price: $14. 60 Day High: $14. 82 Day Low: $14. 50 52 Week High: $20. 8 52 Week Low: $13. 06 EPS: 1. 23 P/E: 11. 90 Market Cap: 160. 55 M Yield: 8. 784% Units Outstanding: 10. 997 M Company: Boston Pizza Royalties Income Exchange: TSE Ticker: BPF. UN IPO: July 17, 2002 (initial P=$10. 00)
 $ 14.")
Historical One Year Price Latest price (Nov 24, 2006 12: 04 EST) $ 14. 60, Volume 10, 137
 $")
Five Year Price vs. S&P Latest price (Nov 24, 2006 12: 04 EST) $ 14. 60, Volume 10, 137

Structure of the Fund Focus: BP Royalties Income Fund a limited purpose openended trust established to acquire indirectly, through Boston Pizza Royalties Limited Partnership, certain trademarks and trade names used by Boston Pizza International Inc. (BPI) in its Boston Pizza restaurants in Canada.

BP International Inc. BPI is the franchisor of the BP concept in CA (since 1982). The company competes in the casual dining sector of the restaurant industry # One casual dining brand in Canada Charges a 7% royalty fee on Franchise Sales for all full-service BP restaurants and a 5% royalty fee on Franchise Sales for BP Quick Express restaurants Pays the Fund a 4% royalty fee based on Franchise Sales of the specific royalty pool (195 restaurants) for the use of BP trademarks (“BP rights”)

When new stores are added… The adjustment for new Franchise Sales added to the Royalty Pool is designed to be accretive for Uniholders. Implications: BPI aggressively enhances and promotes the Boston Pizza brand through national and radio advertising. ( business strategic)

The Fund Stable Structure: Provides Uniholders with top-line royalty from BP restaurants. The Fund has no capital expenditures. Distribution Policy: equal distribution payments to Uniholders on a monthly basis

Nature of Units are hybrids –share certain attributes common to both equity securities and debt instrument Units do not represent a direct investment in the Trust or the Partnership (should not be viewed by investors as units in the Trust or the Partnership) Units represent a fractional interest in the Fund Price per Unit is a fraction of anticipated distribution of cash

The Restaurant Industry and Competitors Performance of the fund is directly dependent upon the royalty and interest payments received from BPI. The performance of BPI is dependent on various factors that may affect the casual dining sector of the restaurant industry. The restaurant industry is intensely competitive with respect to price, service, location, and food quality…( Menu, atmosphere, low price at BP) Other factors including economic conditions

Royalties: 4% Performance of the Fund directly dependent upon the Royalty and interest payments received from BPI How much revenue How many new stores Management: Aggressive vs. Conservative)

the Funds Trustees John L. Cowperthwaite Retired Partner, Ernst & Young LLP Chartered Accountant since 1965 42 years of experience as an auditor at Ernst & Young LLP Subsequently became Chairman of the United Way of the Lower Mainland is currently a governor of SFU

the Funds Trustees Robert L. Phillips Current president of R. L. Phillips Investments Inc. President and CEO of BCR Group of Companies from 2001 - 2004 Executive BP of Mac. Millan Bloedel Ltd. From 1999 to 2000 President and CEO of Dreco Energy Services Ltd. From 1994 to 1998 Bachelor of Science, Chemical Engineering, and Bachelor of Laws degrees from the University of Alberta

the Funds Trustees William C. Brown VP of BC Sugar Refinery Ltd. From 1976 -1988, President from 1988 to 1997, and CEO from 1990 to 1997. Chairman of BC Sugar Refinery Ltd. from 1997 to 1998. Significant experience in accounting and financial reporting issues through serving on the audit committee at Union Gas Ltd. from 2002 to present Bachelor of Science degree from the University of New Brunswick.

BP International Inc. Management Team Walter J. Treliving Opened his first restaurant in 1968 Chairman and owner Born entrepreneur and risk taker

BP International Inc. Management Team George C. Melville Joined the company in 1973 Chairman and owner Entrepreneur Chartered accountant degree in 1968 and worked for the renowned accounting firm, Peat Marwick Mitchell & Co. in Penticton, B. C

The Fund – Cash Flow Statement

BP Intl Inc. -Cash Flow Statement

Key Growth Statistics Restaurant Growth: 31 Store Openings in ‘ 05 0 Store Closures in ‘ 05 SSSG- Average: 6% key driver for yield growth of the Fund was 10. 54% for Q 4, 05 increase distribution for Uniholders

The Fund- Consolidated Statement of Earnings

BP Intl Inc. Consolidated Statements of Operations and Deficits

Business Strategy Commitment for franchise profitability Commitment to continually enhance BP brand Commitment to continually improve customer experience.

What does it mean for Uniholders… In 2005 the Fund delivered two increases in distribution to Uniholders. Distributions have grown by 21. 2% since IPO

Appendix- Current Operation of BPI l 2005 Gross Sales = $513 million l 2005 Franchise Sales = $417 million l 2005 Avg Gross Sales per Location = $2. 3 million l 2005 Customer Visits = 30 million l 2005 # Locations Currently Open = 250 stores l 2005 # Locations in Royalty Pool = 226 stores l zero closure rate in 2005

Appendix-Competitive Strengths Drivers: Low food cost Broad demographic appeal Single brand focus Focus on franchising versus corporate operations. Award-winning national marketing program Increasing number of franchises, allowing Boston Pizza to increase purchasing efficiencies and to reduce unit cost overhead.

Appendix- A Glance at BP restaurants

Appendix-Royalty Pool Locations

Outlook BP International Inc. will continue aggressive expansion into Eastern Canada and Quebec, while continuing to infill markets in Western Canada. Approximately 40 new BP restaurants in 2006 24 -26 renovations are planned in 2006

Recommendation Confident about future Revenue Confident about big economy
fc12415284f00565dc50aca8c7d30067.ppt