

 C E N T R E F O R I N T E G R A T I V E B I O I N F O R M A T I C S V U Lecture 14: Protein domains, function and associated prediction Introduction to Bioinformatics
 Metabolomics fluxomics TERTIARY") Functional Genomics – Systems Biology Genome Expressome Proteome TERTIARY STRUCTURE (fold) Metabolomics fluxomics TERTIARY STRUCTURE (fold) Metabolome
Functional Genomics – Systems Biology Genome Expressome Proteome TERTIARY STRUCTURE (fold) Metabolomics fluxomics TERTIARY STRUCTURE (fold) Metabolome
 Experimental • • Structural genomics Functional genomics Protein-protein interaction Metabolic pathways • Expression data
 Issue when elucidating function experimentally • Typically done through knock-out experiments • Partial information (indirect interactions) and subsequent filling of the missing steps • Negative results (elements that have been shown not to interact, enzymes missing in an organism) • Putative interactions resulting from computational analyses
 • Binding – transport (active/passive) – Protein-DNA/RNA binding") Protein function categories • Catalysis (enzymes) • Binding – transport (active/passive) – Protein-DNA/RNA binding (e. g. histones, transcription factors) – Protein-protein interactions (e. g. antibody-lysozyme) (experimentally determined by yeast two-hybrid (Y 2 H) or bacterial two-hybrid (B 2 H) screening ) – Protein-fatty acid binding (e. g. apolipoproteins) – Protein – small molecules (drug interaction, structure decoding) • Structural component (e. g. -crystallin) • Regulation • Signalling • Transcription regulation • Immune system • Motor proteins (actin/myosin)
Protein function categories • Catalysis (enzymes) • Binding – transport (active/passive) – Protein-DNA/RNA binding (e. g. histones, transcription factors) – Protein-protein interactions (e. g. antibody-lysozyme) (experimentally determined by yeast two-hybrid (Y 2 H) or bacterial two-hybrid (B 2 H) screening ) – Protein-fatty acid binding (e. g. apolipoproteins) – Protein – small molecules (drug interaction, structure decoding) • Structural component (e. g. -crystallin) • Regulation • Signalling • Transcription regulation • Immune system • Motor proteins (actin/myosin)
![Catalytic properties of enzymes Michaelis-Menten equation: Vmax × [S] V = --------- Km +](https://present5.com/presentation/cda03f70a799457834d5ae0f11b24a21/image-6.jpg "Catalytic properties of enzymes Michaelis-Menten equation: Vmax × [S] V = --------- Km +") Catalytic properties of enzymes Michaelis-Menten equation: Vmax × [S] V = --------- Km + [S] Vmax Moles/s Km kcat V /2 E + S ES E+P • E = enzyme K • S = substrate • ES = enzyme-substrate complex (transition state) • P = product • Km = Michaelis constant • Kcat = catalytic rate constant (turnover number) • Kcat/Km = specificity constant (useful for comparison) max m [S]
Catalytic properties of enzymes Michaelis-Menten equation: Vmax × [S] V = --------- Km + [S] Vmax Moles/s Km kcat V /2 E + S ES E+P • E = enzyme K • S = substrate • ES = enzyme-substrate complex (transition state) • P = product • Km = Michaelis constant • Kcat = catalytic rate constant (turnover number) • Kcat/Km = specificity constant (useful for comparison) max m [S]
 Protein interaction domains http: //pawsonlab. mshri. on. ca/html/domains. html
 include: •") Energy difference upon binding Examples of protein interactions (and of functional importance) include: • Protein – protein (pathway analysis); • Protein – small molecules (drug interaction, structure decoding); • Protein – peptides, DNA/RNA The change in Gibb’s Free Energy of the protein-ligand binding interaction can be monitored and expressed by the following equation: G = H – T S (H=Enthalpy, S=Entropy and T=Temperature)
Energy difference upon binding Examples of protein interactions (and of functional importance) include: • Protein – protein (pathway analysis); • Protein – small molecules (drug interaction, structure decoding); • Protein – peptides, DNA/RNA The change in Gibb’s Free Energy of the protein-ligand binding interaction can be monitored and expressed by the following equation: G = H – T S (H=Enthalpy, S=Entropy and T=Temperature)
 Protein function • Many proteins combine functions • Some immunoglobulin structures are thought to have more than 100 different functions (and active/binding sites) • Alternative splicing can generate (partially) alternative structures
 Protein function & Interaction Active site / binding cleft Shape complementarity
 Protein function evolution Chymotrypsin From a simple ancestral active site for cutting protein chains. . . to a more elaborate active site with four different features, all helping to optimise proteolysis (cleavage) Gene duplication has resulted in two-domain protein
 Protein function evolution Chymotrypsin The active site lies between the two domains. It consists of residues on the same two loops (firstly between beta-strands 3 and 4, secondly between beta strands 5 and 6) of each of the two barrel domains. Four features of the active site are indicated in the figure. The Substrate Specificity Pocket Main Chain Substrate-binding The Oxyanion Hole (white) Catalytic triad Chymotrypsin cleaves peptides at the carboxyl side of tyrosine, tryptophan, and phenylalanine because those three amino acids contain phenyl rings.
 How to infer function • Experiment • Deduction from sequence – Multiple sequence alignment – conservation patterns – Homology searching • Deduction from structure – Threading – Structure-structure comparison – Homology modelling
. • Stable unit of") A domain is a: • Compact, semi-independent unit (Richardson, 1981). • Stable unit of a protein structure that can fold autonomously (Wetlaufer, 1973). • Recurring functional and evolutionary module (Bork, 1992). “Nature is a tinkerer and not an inventor” (Jacob, 1977). • Smallest unit of function
A domain is a: • Compact, semi-independent unit (Richardson, 1981). • Stable unit of a protein structure that can fold autonomously (Wetlaufer, 1973). • Recurring functional and evolutionary module (Bork, 1992). “Nature is a tinkerer and not an inventor” (Jacob, 1977). • Smallest unit of function
 Delineating domains is essential for: • Obtaining high resolution structures (x-ray but particularly NMR – size of proteins) • Sequence analysis • Multiple sequence alignment methods • Prediction algorithms (SS, Class, secondary/tertiary structure) • Fold recognition and threading • Elucidating the evolution, structure and function of a protein family (e. g. ‘Rosetta Stone’ method) • Structural/functional genomics • Cross genome comparative analysis
 Domain connectivity linker
 Structural domain organisation can be nasty… Pyruvate kinase Phosphotransferase b barrel regulatory domain /b barrel catalytic substrate binding domain /b nucleotide binding domain 1 continuous + 2 discontinuous domains
 Domain size • The size of individual structural domains varies widely – from 36 residues in E-selectin to 692 residues in lipoxygenase-1 (Jones et al. , 1998) – the majority (90%) having less than 200 residues (Siddiqui and Barton, 1995) – with an average of about 100 residues (Islam et al. , 1995). • Small domains (less than 40 residues) are often stabilised by metal ions or disulphide bonds. • Large domains (greater than 300 residues) are likely to consist of multiple hydrophobic cores (Garel, 1992).
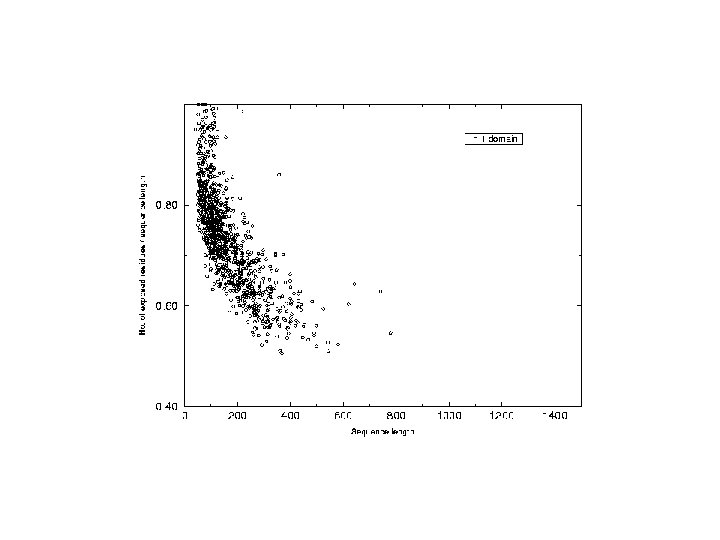
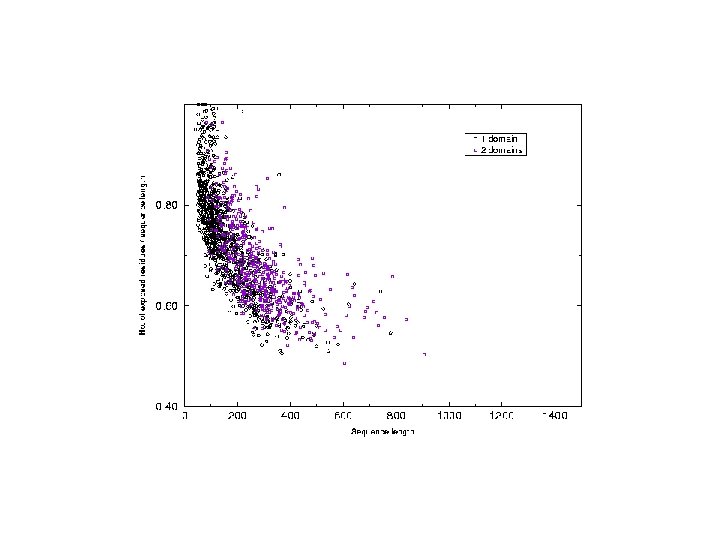
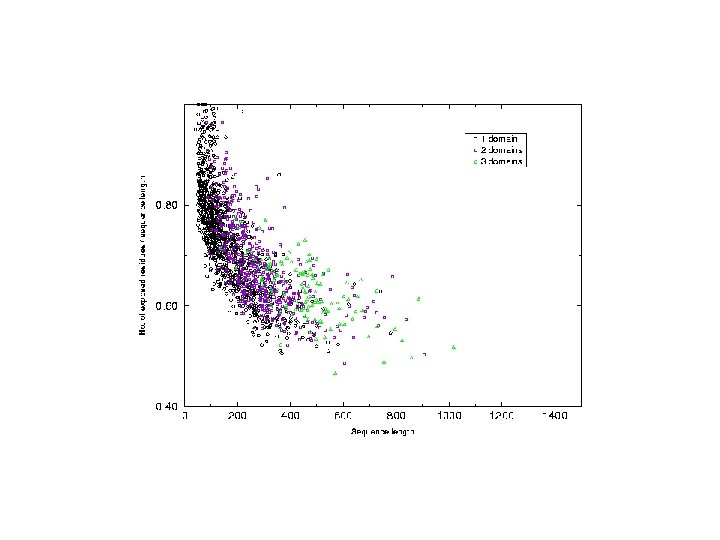
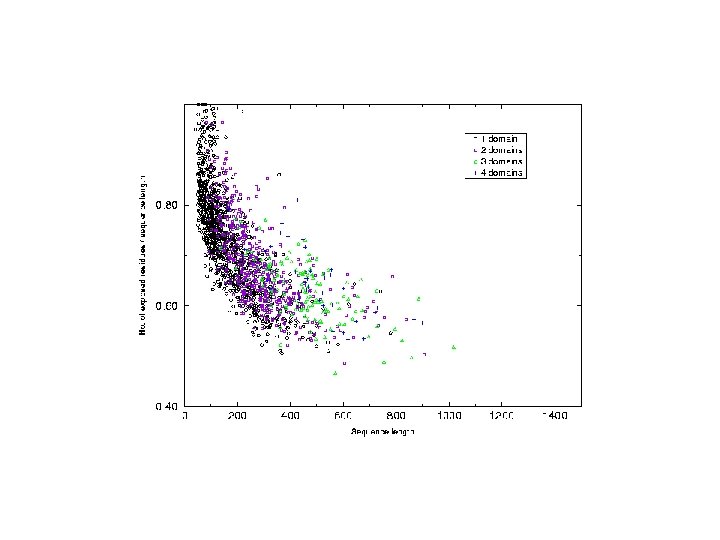

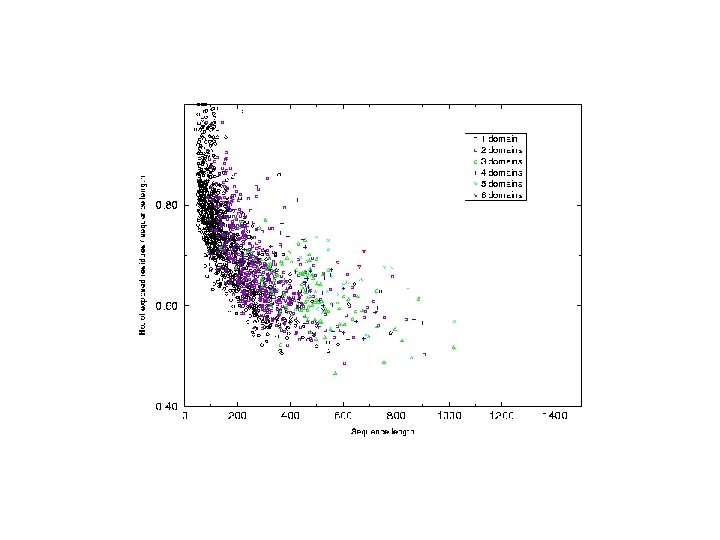

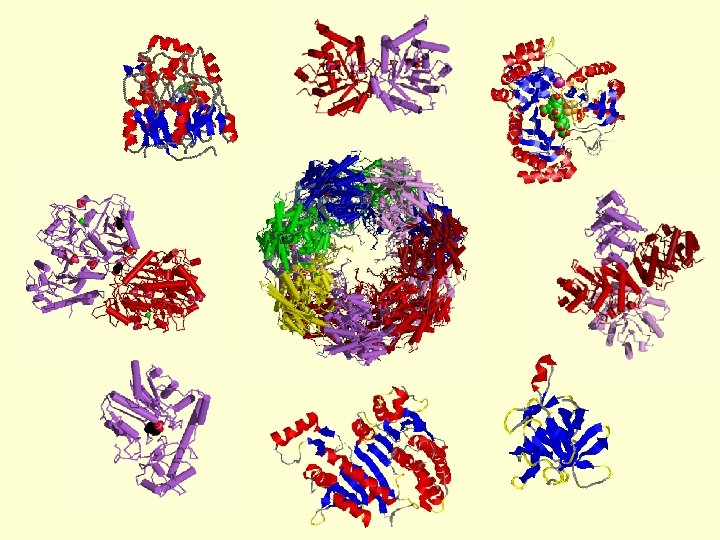
 Analysis of chain hydrophobicity in multidomain proteins
 Analysis of chain hydrophobicity in multidomain proteins
 Domain characteristics Domains are genetically mobile units, and multidomain families are found in all three kingdoms (Archaea, Bacteria and Eukarya) underlining the finding that ‘Nature is a tinkerer and not an inventor’ (Jacob, 1977). The majority of genomic proteins, 75% in unicellular organisms and more than 80% in metazoa, are multidomain proteins created as a result of gene duplication events (Apic et al. , 2001). Domains in multidomain structures are likely to have once existed as independent proteins, and many domains in eukaryotic multidomain proteins can be found as independent proteins in prokaryotes (Davidson et al. , 1993).
 duplication Active site Chymotrypsin") Protein function evolution - Gene (domain) duplication Active site Chymotrypsin
Protein function evolution - Gene (domain) duplication Active site Chymotrypsin
 Pyruvate phosphate dikinase • 3 -domain protein • Two domains catalyse 2 -step reaction A B C • Third so-called ‘swivelling domain’ actively brings intermediate enzymatic product (B) over 45Å from one active site to the other /
 Pyruvate phosphate dikinase • 3 -domain protein • Two domains catalyse 2 -step reaction A B C • Third so-called ‘swivelling domain’ actively brings intermediate enzymatic product (B) over 45Å from one active site to the other /
 The DEATH Domain http: //www. mshri. on. ca/pawson • Present in a variety of Eukaryotic proteins involved with cell death. • Six helices enclose a tightly packed hydrophobic core. • Some DEATH domains form homotypic and heterotypic dimers.
 Detecting Structural Domains • A structural domain may be detected as a compact, globular substructure with more interactions within itself than with the rest of the structure (Janin and Wodak, 1983). • Therefore, a structural domain can be determined by two shape characteristics: compactness and its extent of isolation (Tsai and Nussinov, 1997). • Measures of local compactness in proteins have been used in many of the early methods of domain assignment (Rossmann et al. , 1974; Crippen, 1978; Rose, 1979; Go, 1978) and in several of the more recent methods (Holm and Sander, 1994; Islam et al. , 1995; Siddiqui and Barton, 1995; Zehfus, 1997; Taylor, 1999).
 Detecting Structural Domains • However, approaches encounter problems when faced with discontinuous or highly associated domains and many definitions will require manual interpretation. • Consequently there are discrepancies between assignments made by domain databases (Hadley and Jones, 1999).
 Detecting Domains using Sequence only • Even more difficult than prediction from structure!
 Integrating protein multiple sequence alignment, secondary and tertiary structure prediction in order to predict structural domain boundaries in sequence data Snap. DRAGON Richard A. George R. A. and Heringa, J. (2002) J. Mol. Biol. , 316, 839 -851.
 SECONDARY STRUCTURE (helices, strands) VHLTPEEKSAVTALWGKVNVD") Protein structure hierarchical levels PRIMARY STRUCTURE (amino acid sequence) SECONDARY STRUCTURE (helices, strands) VHLTPEEKSAVTALWGKVNVD EVGGEALGRLLVVYPWTQRFF ESFGDLSTPDAVMGNPKVKAH GKKVLGAFSDGLAHLDNLKGTF ATLSELHCDKLHVDPENFRLLG NVLVCVLAHHFGKEFTPPVQAA YQKVVAGVANALAHKYH QUATERNARY STRUCTURE TERTIARY STRUCTURE (fold)
Protein structure hierarchical levels PRIMARY STRUCTURE (amino acid sequence) SECONDARY STRUCTURE (helices, strands) VHLTPEEKSAVTALWGKVNVD EVGGEALGRLLVVYPWTQRFF ESFGDLSTPDAVMGNPKVKAH GKKVLGAFSDGLAHLDNLKGTF ATLSELHCDKLHVDPENFRLLG NVLVCVLAHHFGKEFTPPVQAA YQKVVAGVANALAHKYH QUATERNARY STRUCTURE TERTIARY STRUCTURE (fold)
 1. Input: Multiple") SNAPDRAGON Domain boundary prediction protocol using sequence information alone (Richard George) 1. Input: Multiple sequence alignment (MSA) and predicted secondary structure 2. Generate 100 DRAGON 3 D models for the protein structure associated with the MSA 3. Assign domain boundaries to each of the 3 D models (Taylor, 1999) 4. Sum proposed boundary positions within 100 models along the length of the sequence, and smooth boundaries using a weighted window George R. A. and Heringa J. (2002) Snap. DRAGON - a method to delineate protein structural domains from sequence data, J. Mol. Biol. 316, 839 -851.
SNAPDRAGON Domain boundary prediction protocol using sequence information alone (Richard George) 1. Input: Multiple sequence alignment (MSA) and predicted secondary structure 2. Generate 100 DRAGON 3 D models for the protein structure associated with the MSA 3. Assign domain boundaries to each of the 3 D models (Taylor, 1999) 4. Sum proposed boundary positions within 100 models along the length of the sequence, and smooth boundaries using a weighted window George R. A. and Heringa J. (2002) Snap. DRAGON - a method to delineate protein structural domains from sequence data, J. Mol. Biol. 316, 839 -851.
 Predicted secondary") Snap. Dragon Folds generated by Dragon Multiple alignment Boundary recognition (Taylor, 1999) Predicted secondary structure CCHHHCCEEE Summed and Smoothed Boundaries
Snap. Dragon Folds generated by Dragon Multiple alignment Boundary recognition (Taylor, 1999) Predicted secondary structure CCHHHCCEEE Summed and Smoothed Boundaries
 1. Input: Multiple") SNAPDRAGON Domain boundary prediction protocol using sequence information alone (Richard George) 1. Input: Multiple sequence alignment (MSA) 1. Sequence searches using PSI-BLAST (Altschul et al. , 1997) 2. followed by sequence redundancy filtering using OBSTRUCT (Heringa et al. , 1992) 3. and alignment by PRALINE (Heringa, 1999) • and predicted secondary structure 4. PREDATOR secondary structure prediction program George R. A. and Heringa J. (2002) Snap. DRAGON - a method to delineate protein structural domains from sequence data, J. Mol. Biol. 316, 839 -851.
SNAPDRAGON Domain boundary prediction protocol using sequence information alone (Richard George) 1. Input: Multiple sequence alignment (MSA) 1. Sequence searches using PSI-BLAST (Altschul et al. , 1997) 2. followed by sequence redundancy filtering using OBSTRUCT (Heringa et al. , 1992) 3. and alignment by PRALINE (Heringa, 1999) • and predicted secondary structure 4. PREDATOR secondary structure prediction program George R. A. and Heringa J. (2002) Snap. DRAGON - a method to delineate protein structural domains from sequence data, J. Mol. Biol. 316, 839 -851.
 Domain prediction using DRAGON Distance Regularisation Algorithm for Geometry Optimisatio. N (Aszodi & Taylor, 1994) • Folded protein models based on the requirement that (conserved) hydrophobic residues cluster together. • First construct a random high dimensional C distance matrix. • Distance geometry is used to find the 3 D conformation corresponding to a prescribed target matrix of desired distances between residues.
 2. Generate 100") SNAPDRAGON Domain boundary prediction protocol using sequence information alone (Richard George) 2. Generate 100 DRAGON (Aszodi & Taylor, 1994) models for the protein structure associated with the MSA – – DRAGON folds proteins based on the requirement that (conserved) hydrophobic residues cluster together (Predicted) secondary structures are used to further estimate distances between residues (e. g. between the first and last residue in a b-strand). It first constructs a random high dimensional C (and pseudo Cb) distance matrix Distance geometry is used to find the 3 D conformation corresponding to a prescribed matrix of desired distances between residues (by gradual inertia projection and based on input MSA and predicted secondary structure) DRAGON = Distance Regularisation Algorithm for Geometry Optimisatio. N
SNAPDRAGON Domain boundary prediction protocol using sequence information alone (Richard George) 2. Generate 100 DRAGON (Aszodi & Taylor, 1994) models for the protein structure associated with the MSA – – DRAGON folds proteins based on the requirement that (conserved) hydrophobic residues cluster together (Predicted) secondary structures are used to further estimate distances between residues (e. g. between the first and last residue in a b-strand). It first constructs a random high dimensional C (and pseudo Cb) distance matrix Distance geometry is used to find the 3 D conformation corresponding to a prescribed matrix of desired distances between residues (by gradual inertia projection and based on input MSA and predicted secondary structure) DRAGON = Distance Regularisation Algorithm for Geometry Optimisatio. N
 C distance matrix N Target matrix 3 N 100 randomised initial matrices 100 predictions Multiple alignment N N Predicted secondary structure CCHHHCCEEE N Input data • The C distance matrix is divided into smaller clusters. • Separately, each cluster is embedded into a local centroid. • The final predicted structure is generated from full embedding of the multiple centroids and their corresponding local structures.
 Lysozyme 4 lzm PDB DRAGON
 Methyltransferase 1 sfe PDB DRAGON
 Phosphatase 2 hhm-A PDB DRAGON
 DOMAIN-3 D 3. Assign domain boundaries to each of the 3") Taylor method (1999) DOMAIN-3 D 3. Assign domain boundaries to each of the 3 D models (Taylor, 1999) • • • Easy and clever method Uses a notion of spin glass theory (disordered magnetic systems) to delineate domains in a protein 3 D structure Steps: 1. 2. 3. 4. Take sequence with residue numbers (1. . N) Look at neighbourhood of each residue (first shell) If (“average nghhood residue number” > res no) resno = resno+1 else resno = resno-1 If (convergence) then take regions with identical “residue number” as domains and terminate Taylor, WR. (1999) Protein structural domain identification. Protein Engineering 12 : 203 -216
Taylor method (1999) DOMAIN-3 D 3. Assign domain boundaries to each of the 3 D models (Taylor, 1999) • • • Easy and clever method Uses a notion of spin glass theory (disordered magnetic systems) to delineate domains in a protein 3 D structure Steps: 1. 2. 3. 4. Take sequence with residue numbers (1. . N) Look at neighbourhood of each residue (first shell) If (“average nghhood residue number” > res no) resno = resno+1 else resno = resno-1 If (convergence) then take regions with identical “residue number” as domains and terminate Taylor, WR. (1999) Protein structural domain identification. Protein Engineering 12 : 203 -216
 repeat until convergence 5 if 41 < (5+6+56+78+89)/5 78 56 6") Taylor method (1999) repeat until convergence 5 if 41 < (5+6+56+78+89)/5 78 56 6 41 then Res 41 42 (up 1) else Res 41 40 (down 1) 89
Taylor method (1999) repeat until convergence 5 if 41 < (5+6+56+78+89)/5 78 56 6 41 then Res 41 42 (up 1) else Res 41 40 (down 1) 89
 initial situation Iterate until convergence continuous discontinuous") Taylor method (1999) initial situation Iterate until convergence continuous discontinuous
Taylor method (1999) initial situation Iterate until convergence continuous discontinuous
 4. Sum proposed") SNAPDRAGON Domain boundary prediction protocol using sequence information alone (Richard George) 4. Sum proposed boundary positions within 100 models along the length of the sequence, and smooth boundaries using a weighted window (assign central position) Window score = 1≤ i ≤ l Si × Wi Wi i Where Wi = (p - |p-i|)/p 2 and p = ½(n+1). It follows that l Wi = 1 George R. A. and Heringa J. (2002) Snap. DRAGON - a method to delineate protein structural domains from sequence data, J. Mol. Biol. 316, 839 -851.
SNAPDRAGON Domain boundary prediction protocol using sequence information alone (Richard George) 4. Sum proposed boundary positions within 100 models along the length of the sequence, and smooth boundaries using a weighted window (assign central position) Window score = 1≤ i ≤ l Si × Wi Wi i Where Wi = (p - |p-i|)/p 2 and p = ½(n+1). It follows that l Wi = 1 George R. A. and Heringa J. (2002) Snap. DRAGON - a method to delineate protein structural domains from sequence data, J. Mol. Biol. 316, 839 -851.
/stdev •") SNAPDRAGON Statistical significance: • Convert peak scores to Z-scores using z = (x-mean)/stdev • If z > 2 then assign domain boundary Statistical significance using random models: • Test hydrophibic collapse given distribution of hydrophobicity over sequence • Make 5 scrambled multiple alignments (MSAs) and predict their secondary structure • Make 100 models for each MSA • Compile mean and stdev from the boundary distribution over the 500 random models • If observed peak z > 2. 0 stdev (from random models) then assign domain boundary
SNAPDRAGON Statistical significance: • Convert peak scores to Z-scores using z = (x-mean)/stdev • If z > 2 then assign domain boundary Statistical significance using random models: • Test hydrophibic collapse given distribution of hydrophobicity over sequence • Make 5 scrambled multiple alignments (MSAs) and predict their secondary structure • Make 100 models for each MSA • Compile mean and stdev from the boundary distribution over the 500 random models • If observed peak z > 2. 0 stdev (from random models) then assign domain boundary
 Snap. DRAGON prediction assessment • Test set of 414 multiple alignments; 183 single and 231 multiple domain proteins. • Boundary predictions are compared to the region of the protein connecting two domains (maximally 10 residues from true boundary)
 Snap. DRAGON prediction assessment • Baseline method I: • Divide sequence in equal parts based on number of domains predicted by Snap. DRAGON • Baseline method II: • Similar to Wheelan et al. , based on domain length partition density function (PDF) • PDF derived from 2750 non-redundant structures (deposited at NCBI) • Given sequence, calculate probability of onedomain, two-domain, . . , protein • Highest probability taken and sequence split equally as in baseline method I
 Success is") Average prediction results per protein Coverage is the % linkers predicted (TP/TP+FN) Success is the % of correct predictions made (TP/TP+FP)
Average prediction results per protein Coverage is the % linkers predicted (TP/TP+FN) Success is the % of correct predictions made (TP/TP+FP)
 Average prediction results per protein
 Protein-protein interaction networks
 of the cellular networks?") Protein Function Prediction How can we get the edges (connections) of the cellular networks? • We can predict functions of genes or proteins so we know where they would fit in a metabolic network • There also techniques to predict whether two proteins interact, either functionally (e. g. they are involved in a two-step metabolic process) or directly physically (e. g. are together in a protein complex)
Protein Function Prediction How can we get the edges (connections) of the cellular networks? • We can predict functions of genes or proteins so we know where they would fit in a metabolic network • There also techniques to predict whether two proteins interact, either functionally (e. g. they are involved in a two-step metabolic process) or directly physically (e. g. are together in a protein complex)
 Protein Function Prediction The state of the art – it’s not complete Many genes are not annotated, and many more are partially or erroneously annotated. Given a genome which is partially annotated at best, how do we fill in the blanks? Of each sequenced genome, 20%-50% of the functions of proteins encoded by the genomes remains unknown! How then do we build a reasonably complete networks when the parts list is so incomplete?
 Protein Function Prediction For all these reasons, improving automated protein function prediction is now a cornerstone of bioinformatics and computational biology New methods will need to integrate signals coming from sequence, expression, interaction and structural data, etc.
 • Sequence based approaches – protein A has") Classes of function prediction methods (recap) • Sequence based approaches – protein A has function X, and protein B is a homolog (ortholog) of protein A; Hence B has function X • Structure-based approaches – protein A has structure X, and X has so-so structural features; Hence A’s function sites are …. • Motif-based approaches – a group of genes have function X and they all have motif Y; protein A has motif Y; Hence protein A’s function might be related to X • Function prediction based on “guilt-by-association” – gene A has function X and gene B is often “associated” with gene A, B might have function related to X
Classes of function prediction methods (recap) • Sequence based approaches – protein A has function X, and protein B is a homolog (ortholog) of protein A; Hence B has function X • Structure-based approaches – protein A has structure X, and X has so-so structural features; Hence A’s function sites are …. • Motif-based approaches – a group of genes have function X and they all have motif Y; protein A has motif Y; Hence protein A’s function might be related to X • Function prediction based on “guilt-by-association” – gene A has function X and gene B is often “associated” with gene A, B might have function related to X
 Phylogenetic profile analysis • Function prediction of genes based on “guilt-byassociation” – a non-homologous approach • The phylogenetic profile of a protein is a string that encodes the presence or absence of the protein in every sequenced genome • Because proteins that participate in a common structural complex or metabolic pathway are likely to co-evolve, the phylogenetic profiles of such proteins are often ``similar'‘ • This means that such proteins have a good chance of being physically or metabolically connected
 – For each gene X") Phylogenetic profile analysis • Phylogenetic profile (against N genomes) – For each gene X in a target genome (e. g. , E coli), build a phylogenetic profile as follows – If gene X has a homolog in genome #i, the ith bit of X’s phylogenetic profile is “ 1” otherwise it is “ 0”
Phylogenetic profile analysis • Phylogenetic profile (against N genomes) – For each gene X in a target genome (e. g. , E coli), build a phylogenetic profile as follows – If gene X has a homolog in genome #i, the ith bit of X’s phylogenetic profile is “ 1” otherwise it is “ 0”
 Phylogenetic profile analysis • Example – phylogenetic profiles based on 60 genomes genome gene orf 1034: 11101101100101111101000000001111111011010101 orf 1036: 101111000001010000010010000101110011011010000101 orf 1037: 11011000000111001000011111100110111110101111000010100 orf 1038: 111010010010110010011100000101110101101111110000101 orf 1039: 111111111111111111111011111111101 orf 104: 1000101000000001010000011000000010010100 orf 1040: 11101111101111100000111111110110111111101 orf 1041: 11111111101111111011111111111101 orf 1042: 1110100100101100001001111110101101100010101 orf 1043: 1110100100000101001111001000011111101011101000010101 orf 1044: 11111001001011111100111111101101100010101 orf 1045: 1111110110110011111111101111111111110010101 orf 1046: 0101100000010110000001111100000101001010000 orf 1047: 00000000100000010000000010000000 orf 105: 011011011010001011110110101011100110110010111110000010001 orf 1054: 0100100110000100000000100100100010010000 By correlating the rows (open reading frames (ORF) or genes) you find out about joint presence or absence of genes: this is a signal for a functional connection Genes with similar phylogenetic profiles have related functions or functionally linked – D Eisenberg and colleagues (1999)
 Phylogenetic profile analysis • Phylogenetic profiles contain great amount of functional information • Phlylogenetic profile analysis can be used to distinguish orthologous genes from paralogous genes • Example: Subcellular localization: 361 yeast nucleusencoded mitochondrial proteins were identified at 50% accuracy with 58% coverage through phylogenetic profile analysis • Functional complementarity: By examining inverse phylogenetic profiles, one can find functionally complementary genes that might have evolved through one of several mechanisms of convergent evolution. • Phylogenetic profiling typically has low accuracy (specificity) but can have high coverage.
 comprising the enzymes") Domain fusion example n. Vertebrates have a multi-enzyme protein (GARs- AIRs-GARt) comprising the enzymes GAR synthetase (GARs), AIR synthetase (AIRs), and GAR transformylase (GARt) n. In insects, the polypeptide appears as GARs(AIRs)2 -GARt n. In yeast, GARs-AIRs is encoded separately from GARt n. In bacteria each domain is encoded separately (Henikoff et al. , 1997). GAR: glycinamide ribonucleotide AIR: aminoimidazole ribonucleotide
Domain fusion example n. Vertebrates have a multi-enzyme protein (GARs- AIRs-GARt) comprising the enzymes GAR synthetase (GARs), AIR synthetase (AIRs), and GAR transformylase (GARt) n. In insects, the polypeptide appears as GARs(AIRs)2 -GARt n. In yeast, GARs-AIRs is encoded separately from GARt n. In bacteria each domain is encoded separately (Henikoff et al. , 1997). GAR: glycinamide ribonucleotide AIR: aminoimidazole ribonucleotide
 Using observed domain fusion for prediction of protein-protein interactions Rosetta stone method • Gene fusion is the an effective method for prediction of protein-protein interactions – If proteins A and B are homologous to two domains of a multidomain protein C, A and B are predicted to have interaction A B C Though gene-fusion has low prediction coverage, its false-positive rate is low (high specificity)
 Protein interaction database • There are numerous databases of protein-protein interactions • DIP is a popular protein-protein interaction database The DIP database catalogs experimentally determined interactions between proteins. It combines information from a variety of sources to create a single, consistent set of protein-protein interactions.
 Protein interaction databases BIND - Biomolecular Interaction Network Database DIP - Database of Interacting Proteins PIM – Hybrigenics Path. Calling Yeast Interaction Database MINT - a Molecular Interactions Database GRID - The General Repository for Interaction Datasets Inter. Pre. TS - protein interaction prediction through tertiary structure STRING - predicted functional associations among genes/proteins Mammalian protein-protein interaction database (PPI) Inter. Dom - database of putative interacting protein domains Fusion. DB - database of bacterial and archaeal gene fusion events Int. Act Project The Human Protein Interaction Database (HPID) ADVICE - Automated Detection and Validation of Interaction by Co-evolution Inter. Weaver - protein interaction reports with online evidence Path. BLAST - alignment of protein interaction networks Clus. Pro - a fully automated algorithm for protein-protein docking HPRD - Human Protein Reference Database
 Protein interaction database
 proteins.") Network of protein interactions and predicted functional links involving silencing information regulator (SIR) proteins. Filled circles represent proteins of known function; open circles represent proteins of unknown function, represented only by their Saccharomyces genome sequence numbers ( http: //genomewww. stanford. edu/Saccharomyces). Solid lines show experimentally determined interactions, as summarized in the Database of Interacting Proteins 19 (http: //dip. doe-mbi. ucla. edu). Dashed lines show functional links predicted by the Rosetta Stone method 12. Dotted lines show functional links predicted by phylogenetic profiles 16. Some predicted links are omitted for clarity.
Network of protein interactions and predicted functional links involving silencing information regulator (SIR) proteins. Filled circles represent proteins of known function; open circles represent proteins of unknown function, represented only by their Saccharomyces genome sequence numbers ( http: //genomewww. stanford. edu/Saccharomyces). Solid lines show experimentally determined interactions, as summarized in the Database of Interacting Proteins 19 (http: //dip. doe-mbi. ucla. edu). Dashed lines show functional links predicted by the Rosetta Stone method 12. Dotted lines show functional links predicted by phylogenetic profiles 16. Some predicted links are omitted for clarity.
 Network of predicted functional linkages involving the yeast prion protein 20 Sup 35. The dashed line shows the only experimentally determined interaction. The other functional links were calculated from genome and expression data 11 by a combination of methods, including phylogenetic profiles, Rosetta stone linkages and m. RNA expression. Linkages predicted by more than one method, and hence particularly reliable, are shown by heavy lines. Adapted from ref. 11.
 STRING - predicted functional associations among genes/proteins • STRING is a database of predicted functional associations among genes/proteins. • Genes of similar function tend to be maintained in close neighborhood, tend to be present or absent together, i. e. to have the same phylogenetic occurrence, and can sometimes be found fused into a single gene encoding a combined polypeptide. • STRING integrates this information from as many genomes as possible to predict functional links between proteins. Berend Snel (UU), Martijn Huynen (RUN) and the group of Peer Bork (EMBL, Heidelberg)
 STRING - predicted functional associations among genes/proteins STRING is a database of known and predicted protein-protein interactions. The interactions include direct (physical) and indirect (functional) associations; they are derived from four sources: 1. 2. 3. 4. Genomic Context (Synteny) High-throughput Experiments (Conserved) Co-expression Previous Knowledge STRING quantitatively integrates interaction data from these sources for a large number of organisms, and transfers information between these organisms where applicable. The database currently contains 736429 proteins in 179 species
 STRING - predicted functional associations among genes/proteins Conserved Neighborhood This view shows runs of genes that occur repeatedly in close neighborhood in (prokaryotic) genomes. Genes located together in a run are linked with a black line (maximum allowed intergenic distance is 300 bp). Note that if there are multiple runs for a given species, these are separated by white space. If there are other genes in the run that are below the current score threshold, they are drawn as small white triangles. Gene fusion occurences are also drawn, but only if they are present in a run.
 Wrapping up • Understand chymotrypsin example: evolution via gene duplication of an optimised two-domain barrel enzyme with active site residues from either domain. • Understand domain issues: structural and functional • Understand the basic steps of the Snap-DRAGON method for domain boundary prediction – but no need to memorize it all • Understand phylogenetic profiling and the Rosetta Stone method (guilt-by-association) • Understand that conservation patterns in the order of genes that are nearby on the genome (synteny) indicate functional relationships (used in STRING method) • Also co-expression (genes being expressed (or not) at the same time) indicates a functional relationship (used in STRING method)