5857f0d6306c408930d62d7a87573f07.ppt
- Количество слайдов: 31
Building OC-768 Monitor using GS Tool Vladislav Shkapenyuk Theodore Johnson Oliver Spatscheck June 2009
GS Tool Overview • High performance data stream processing – Monitor network traffic using SQL queries. – Rapid development of complex monitoring systems • With automated complex optimizations • Joint project between Database, Networking Research – New model of database processing • Which became popular around that time. – Overcame snorts of derision • Currently, standard DPI solution in AT&T.
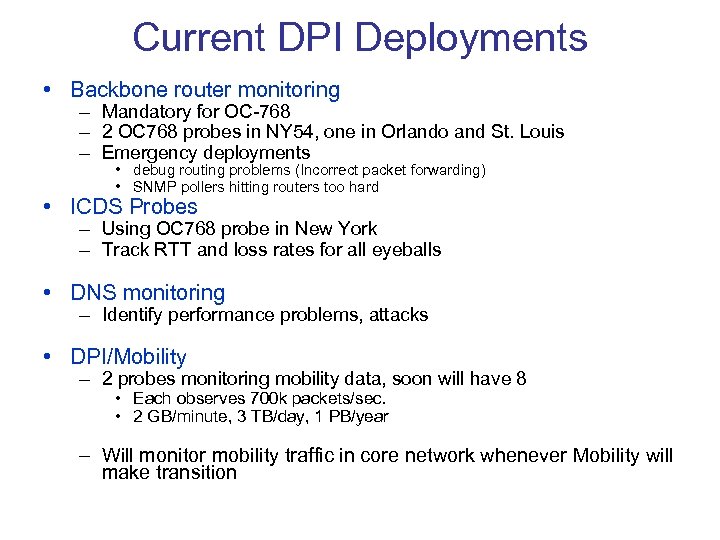
Current DPI Deployments • Backbone router monitoring – Mandatory for OC-768 – 2 OC 768 probes in NY 54, one in Orlando and St. Louis – Emergency deployments • debug routing problems (Incorrect packet forwarding) • SNMP pollers hitting routers too hard • ICDS Probes – Using OC 768 probe in New York – Track RTT and loss rates for all eyeballs • DNS monitoring – Identify performance problems, attacks • DPI/Mobility – 2 probes monitoring mobility data, soon will have 8 • Each observes 700 k packets/sec. • 2 GB/minute, 3 TB/day, 1 PB/year – Will monitor mobility traffic in core network whenever Mobility will make transition
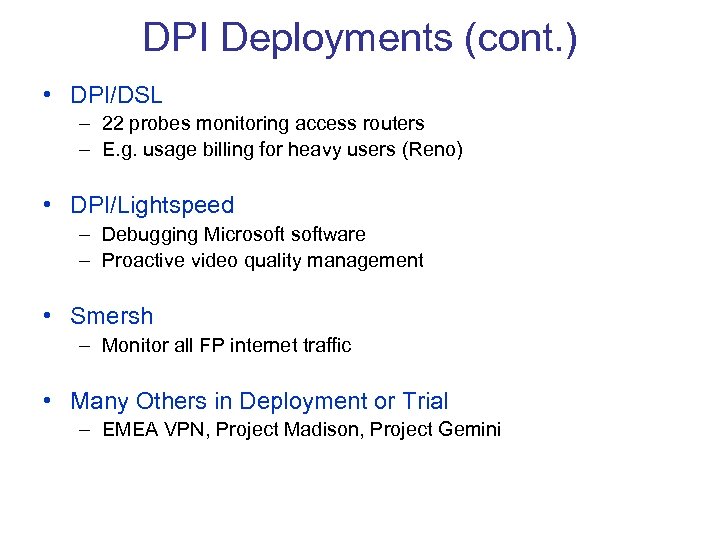
DPI Deployments (cont. ) • DPI/DSL – 22 probes monitoring access routers – E. g. usage billing for heavy users (Reno) • DPI/Lightspeed – Debugging Microsoftware – Proactive video quality management • Smersh – Monitor all FP internet traffic • Many Others in Deployment or Trial – EMEA VPN, Project Madison, Project Gemini
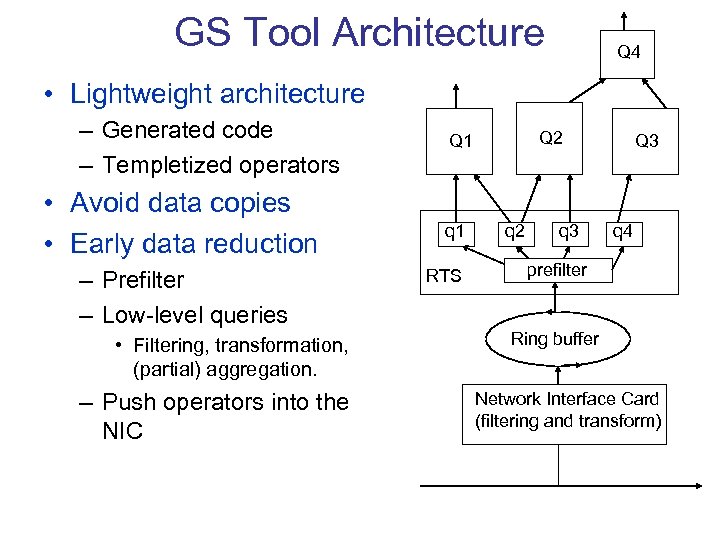
GS Tool Architecture Q 4 • Lightweight architecture – Generated code – Templetized operators • Avoid data copies • Early data reduction – Prefilter – Low-level queries • Filtering, transformation, (partial) aggregation. – Push operators into the NIC Q 2 Q 1 q 1 RTS q 2 q 3 Q 3 q 4 prefilter Ring buffer Network Interface Card (filtering and transform)
Scaling Issues • Exploding data rates – GS architecture worked well for up to OC-48 rates (2. 5 Gbit/sec) – 10 Geth is a new standard • need automatic parallelization for multi-core Gigascope – OC-768 links carry 2 x 40 Gbit/sec traffic (112 million packets/sec) • 26 cycles per tuple on 4 Ghz machine • exceeds the capabilities of modern computer buses • need traffic partitioning / cluster computing • Exploding query sets – I used to think that 50 queries is a lot – Now up to 170 on some major apps. • Exploding query complexity – Complex joins – Complex aggregation group definition (TCP flows, etc) – Alerting
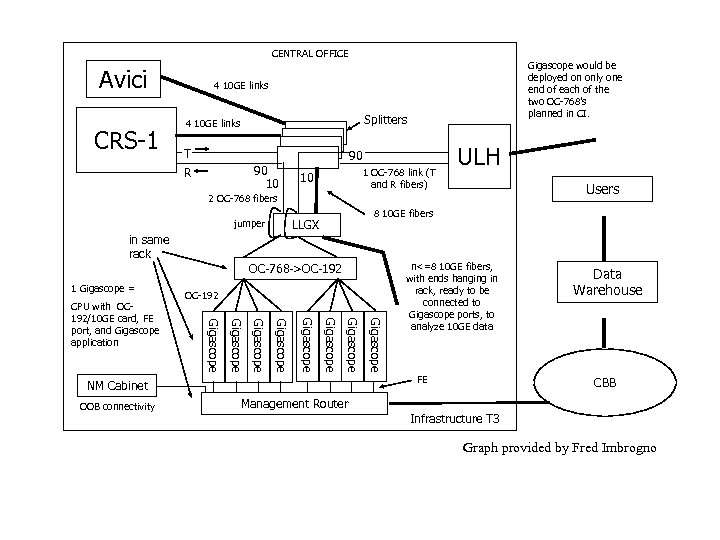
CENTRAL OFFICE Avici CRS-1 Gigascope would be deployed on only one end of each of the two OC-768’s planned in CI. 4 10 GE links Splitters 4 10 GE links T 90 90 10 R 1 OC-768 link (T and R fibers) 10 ULH Users 2 OC-768 fibers jumper in same rack 1 Gigascope = OC-768 ->OC-192 NM Cabinet OOB connectivity Gigascope Gigascope CPU with OC 192/10 GE card, FE port, and Gigascope application 8 10 GE fibers LLGX n<=8 10 GE fibers, with ends hanging in rack, ready to be connected to Gigascope ports, to analyze 10 GE data FE Data Warehouse CBB Management Router Infrastructure T 3 Graph provided by Fred Imbrogno
OC-768 Probe Architecture

First Prototype – Four Dwarfs
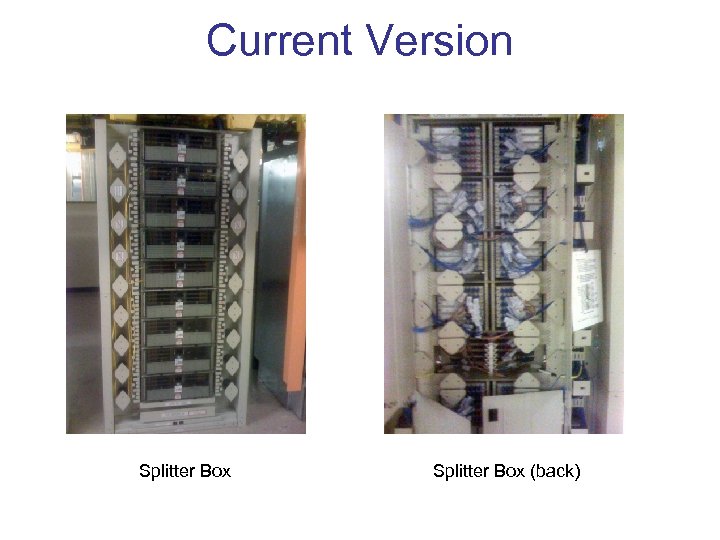
Current Version Splitter Box (back)
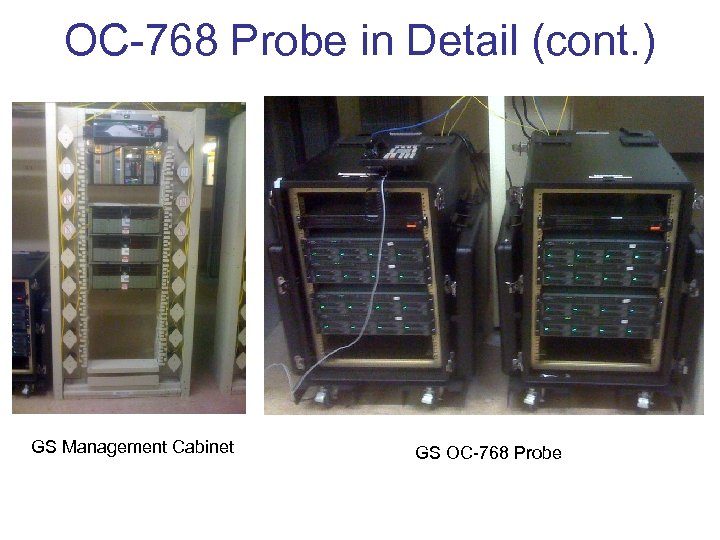
OC-768 Probe in Detail (cont. ) GS Management Cabinet GS OC-768 Probe
Technical Challenges • Liveness management • Multi-query optimization – avoid cost of invoking queries needlessly – combining common predicates • Load shedding – query-aware load shedding that returns meaningful results • Distributed query optimization – query-aware stream partitioning for distributed evaluation • Pushing operators into NIC and below – using TCAMs for filtering, sampling and partitioning
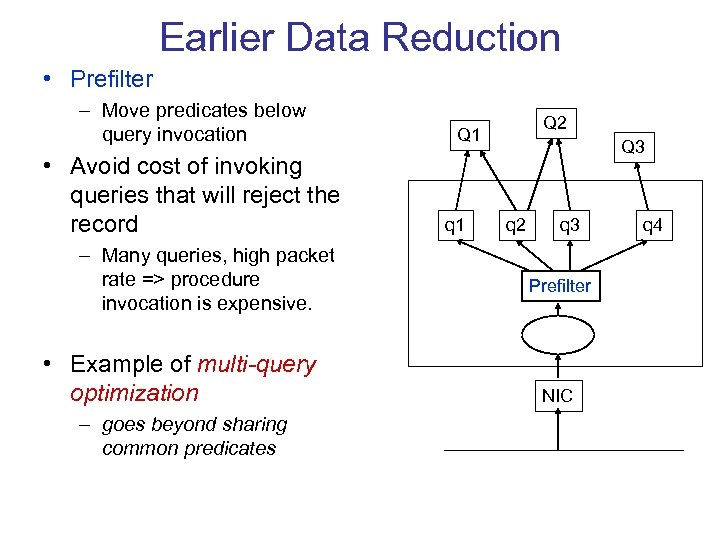
Earlier Data Reduction • Prefilter – Move predicates below query invocation • Avoid cost of invoking queries that will reject the record – Many queries, high packet rate => procedure invocation is expensive. • Example of multi-query optimization – goes beyond sharing common predicates Q 2 Q 1 q 1 Q 3 q 2 q 3 Prefilter NIC q 4
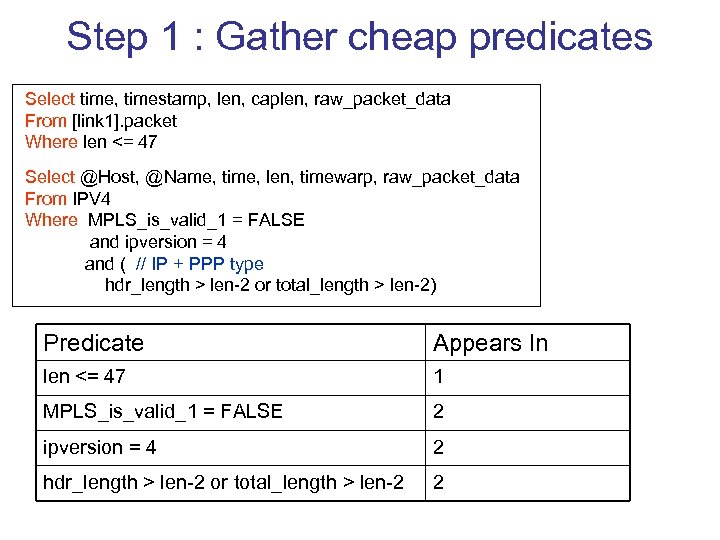
Step 1 : Gather cheap predicates Select time, timestamp, len, caplen, raw_packet_data From [link 1]. packet Where len <= 47 Select @Host, @Name, time, len, timewarp, raw_packet_data From IPV 4 Where MPLS_is_valid_1 = FALSE and ipversion = 4 and ( // IP + PPP type hdr_length > len-2 or total_length > len-2) Predicate Appears In len <= 47 1 MPLS_is_valid_1 = FALSE 2 ipversion = 4 2 hdr_length > len-2 or total_length > len-2 2
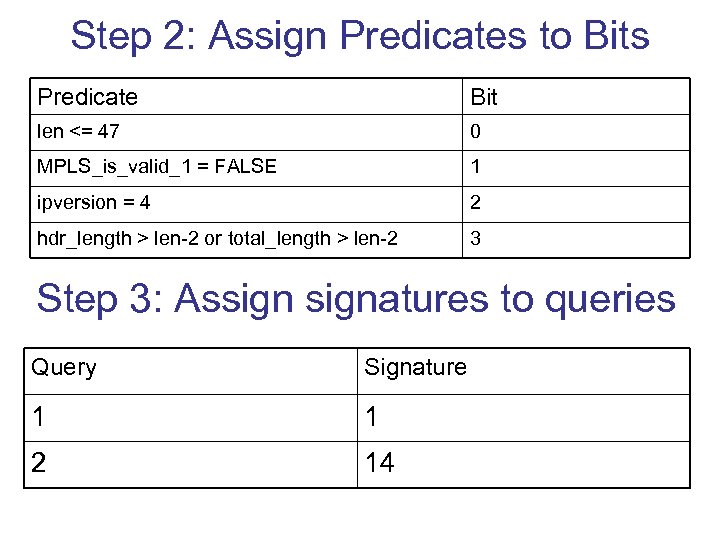
Step 2: Assign Predicates to Bits Predicate Bit len <= 47 0 MPLS_is_valid_1 = FALSE 1 ipversion = 4 2 hdr_length > len-2 or total_length > len-2 3 Step 3: Assignatures to queries Query Signature 1 1 2 14
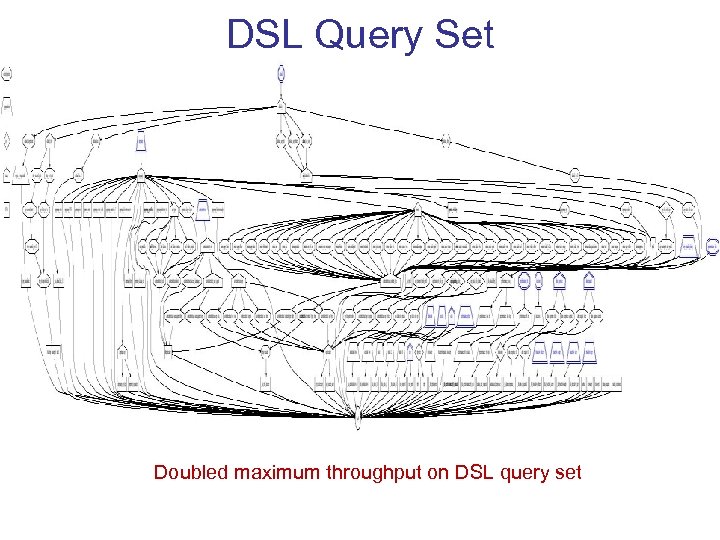
DSL Query Set Doubled maximum throughput on DSL query set
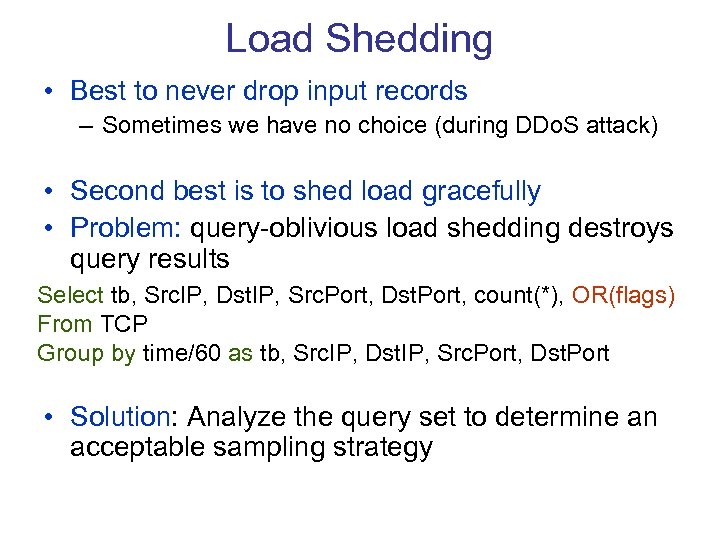
Load Shedding • Best to never drop input records – Sometimes we have no choice (during DDo. S attack) • Second best is to shed load gracefully • Problem: query-oblivious load shedding destroys query results Select tb, Src. IP, Dst. IP, Src. Port, Dst. Port, count(*), OR(flags) From TCP Group by time/60 as tb, Src. IP, Dst. IP, Src. Port, Dst. Port • Solution: Analyze the query set to determine an acceptable sampling strategy
Query-Aware Load Shedding • Sampling methods • Per-tuple • Per-group • Strongly Compatible – Output of the query over a sample is a sample of the output of the query over the entire stream • Weakly Compatible – “good approximations” OK for aggregates (e. g. , SUM has a good approximation). • Per-group sampling – Define the group as a subset of the partitioning fields • Aggregation : group-by fields • Join – equi-join fields. • Reconcile the sampling choices at the leaves
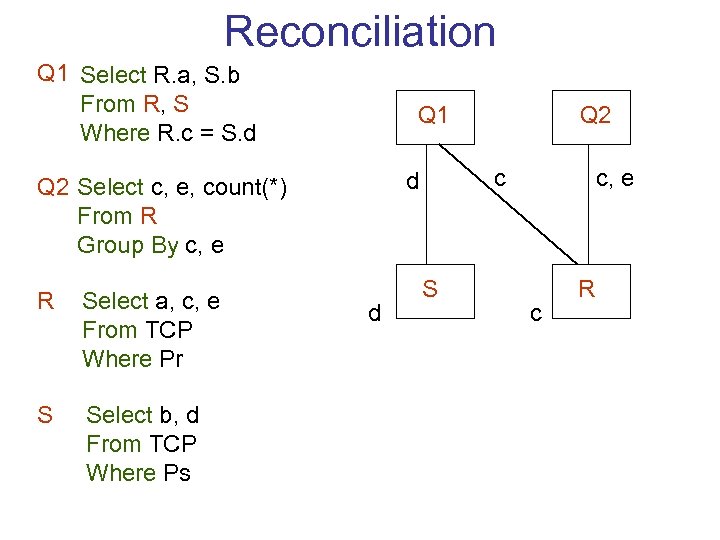
Reconciliation Q 1 Select R. a, S. b From R, S Where R. c = S. d Q 1 R Select a, c, e From TCP Where Pr S Select b, d From TCP Where Ps c d Q 2 Select c, e, count(*) From R Group By c, e d Q 2 S c, e c R
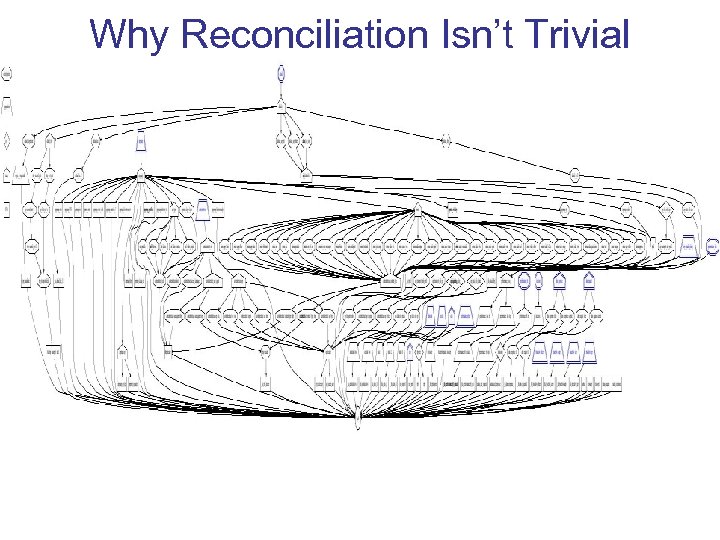
Why Reconciliation Isn’t Trivial
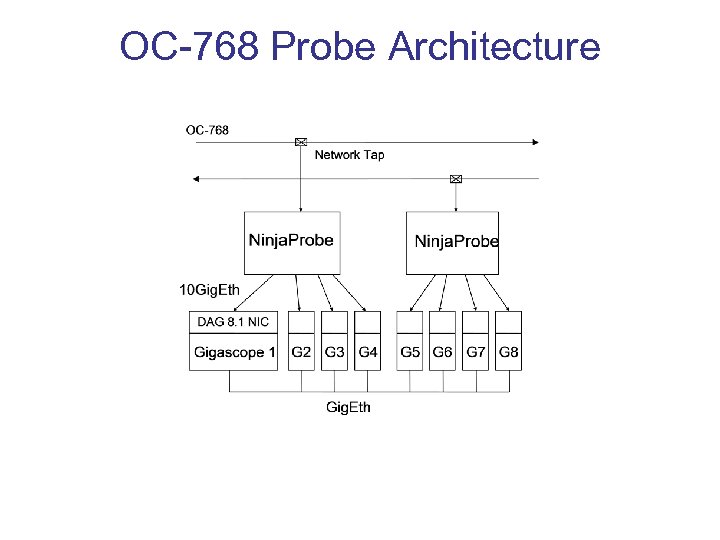
Distributed Query Optimization • The OC-768 monitor partitions 40 Gbit/s streams into 4 10 Gbit/s streams – partitioning is done by Hydra in hardware • only one shot at partitioning – each GS server monitors single 10 GE link • Query evaluation plan depends on the method of partitioning – result reintegration is cheap if partitioning is compatible • some partitioning strategies are much better than others • Example: traffic flow computation on 8 nodes SELECT tb, src. IP, dest. IP, src. Port, dest. Port, count(*) as cnt, sum (len), OR_AGGR(flags), other_stats … FROM TCP GROUP BY time/10 as tb, src. IP, dest. IP, src. Port, dest. Port; – in the worst case a single flow will result in 8 partial flows – partial results need to be combined --> load on final aggregator node can exceed the load on centralized system
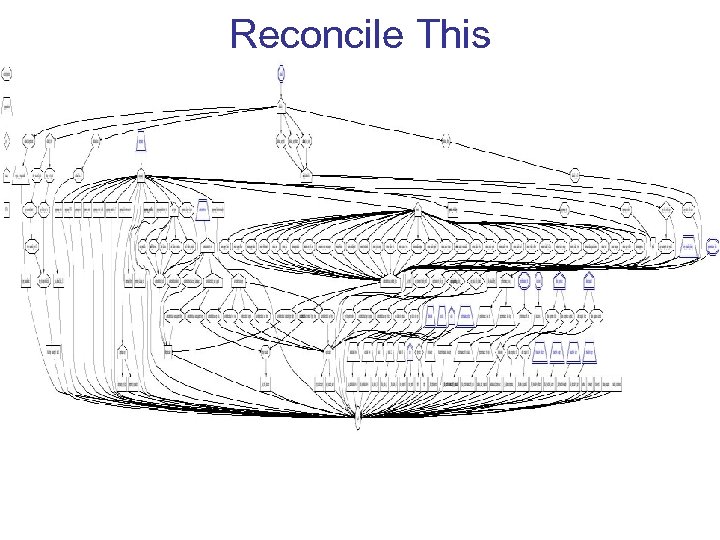
Distributed Multi-query Optimization • Straightforward to compute good partitioning for simple individual queries – similar to finding compatible sampling method – prior work in parallel database and networking community • We run a query set, not a single query – Network monitoring query sets are large and complex -> conflicting partitioning requirements – may not be possible to be compatible with all queries -> need to choose globally optimal • How to find an optimal partitioning strategy for the query set – Repartitioning is not acceptable.
Reconcile This
Query-aware partitioning • Find the best partitioning set for each query node – Partitioning set : attributes used in the partitioning hash function • Reconcile partitioning sets – Find largest partitioning set compatible with two queries. • for simple cases reconciled set is an intersection of two sets • Find an optimal partitioning set for all queries – No single set likely to be compatible with all queries. – Dynamic programming algorithm to efficiently search the space of solutions > Goal: minimize the cost of copying tuples across network
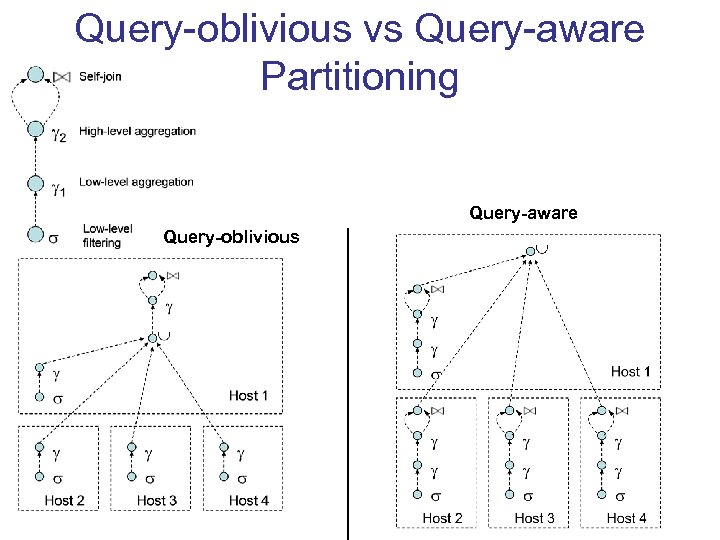
Query-oblivious vs Query-aware Partitioning Query-aware Query-oblivious
Live OC 768 Feed Experiments • OC 768 monitor deployed in NY 54 switching center. • Live internet backbone traffic captured using an OC 768 router optical splitter. – OC-768 Traffic is split into four 10 Gig. Eth lines – each line is monitored by a separate dual-core 3 GHz Xeon servers w/ 4 GB of RAM, Linux 2. 4. 21 – servers connected using Gigabit LAN • One direction of OC 768 link monitored, observed approximately 1. 6 millions packets per second (about 7. 3 Gbit/sec).
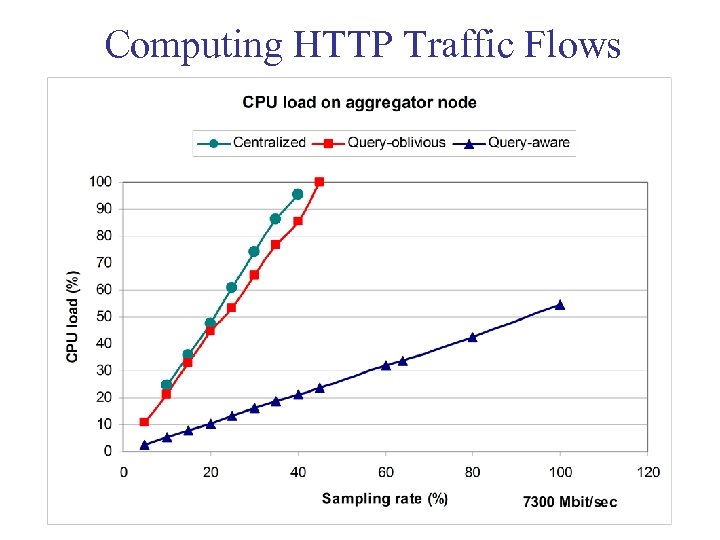
Computing HTTP Traffic Flows
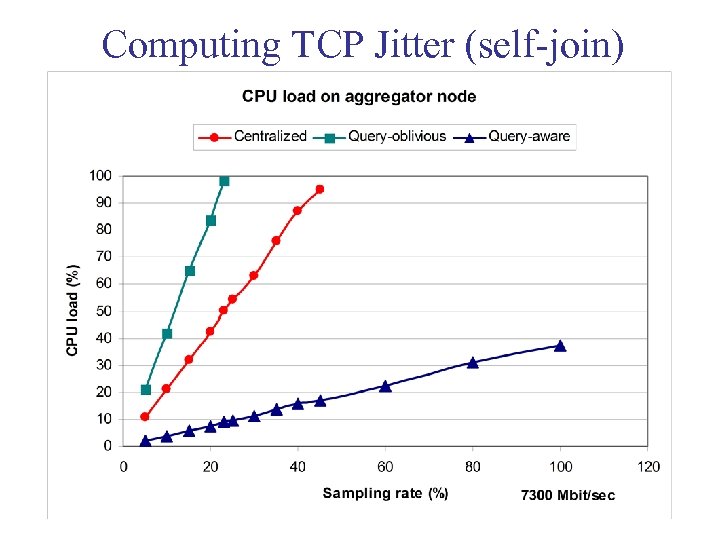
Computing TCP Jitter (self-join)
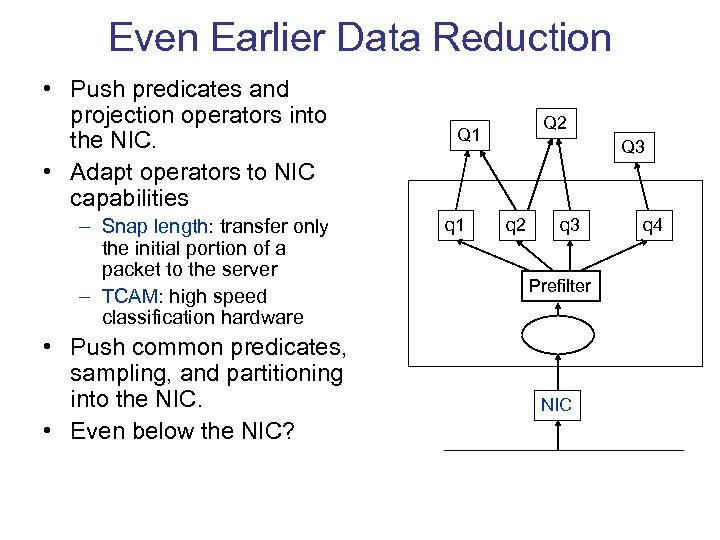
Even Earlier Data Reduction • Push predicates and projection operators into the NIC. • Adapt operators to NIC capabilities – Snap length: transfer only the initial portion of a packet to the server – TCAM: high speed classification hardware • Push common predicates, sampling, and partitioning into the NIC. • Even below the NIC? Q 2 Q 1 q 1 Q 3 q 2 q 3 Prefilter NIC q 4
TCAM Programming • Ternary Content Addressable Memory – each memory line stores a rules with associated action • Relatively easy to program, can assign actions whenever we have a match in a CAM – we are using it to implement partitioning, sampling and tuple filtering – also possible on the 10 Geth card – Enable parallel processing at the low level • Need to translate partition set into TCAM rules – Also selection predicates and sampling rules
Conclusions • First and only OC 768 monitor in existence – • DSMS technology is necessary to scale to the levels of data and query complexity – – • glory and the pain of all first adopters multi-query optimization intelligent sampling for load shedding distributed query optimization TCAM programming … Successfully deployed in AT&T core network – many techniques developed for OC 768 are now widely used in Mobility, ICDS and other deployments
5857f0d6306c408930d62d7a87573f07.ppt