fde08d68aa15110ed09c71d7b6c98f74.ppt
- Количество слайдов: 61


Bond is a contract by the seller to pay the buyer a stated cash flow. Time 0 1 2 3 Cash flow (Coupon payments (C) or interest (INT), and maturity payment (M) or face value payment (F) $0 $50 $50 $1000 5% coupon payment (coupon interest rate of 5%) with a maturity (par, face) value of $1000 and 3 years to maturity.

US Treasury Bond Quotes

Valuing Bonds Capitalization of Cash Flow Value of a Bond with a finite life

Setting up a new issue bond: Consider a government that needs to borrow $1000 • When do they want to pay back the principle? (the maturity date) • What interest rate do they have to pay on the “loan”? (the coupon interest rate) • Assume the $1000 is what they want to borrow so sell the bond at par or maturity value.
 • What coupon")
Suppose they decided for a oneyear bond issued at par ($1000) • What coupon rate do they have to set? • What is the rate of return (YTM) on other 1 year bonds with the same risk? (OR, what interest rate does the government have to pay to borrow? )

If the annual interest for borrowing for one year for an agent of the same risk is 4. 85%, what coupon rate should be set to sell the bond at par? • Price: $1000 • Received in 1 year: $1000 + INT • Return should be 4. 85% • 0. 0485 = ($1000 - $1000) + INT $1000 INT = $48. 50 so set coupon rate at 4. 85%

Here’s the bond: Price when issued: P = $1000 Period 0 1 Cash Flow $0 $1000 + $48. 50 Notice: the $1000 + $48. 50 is a contracted amount. It cannot change over the life of the bond.

Person A buys the bond for $1000 Two minutes later, the central bank lowers interest rates. Yields on oneyear bonds fall to 3. 5%.
 with a newly issued one year bond (B) Period CF(A) CF(B)")
Compare bond (A) with a newly issued one year bond (B) Period CF(A) CF(B) 0 $0 $0 1 $1000 + $48. 50 $1000 + $35. 00

Bonds with the same risk should sell to yield the same return (yield to maturity). What should be the current market prices of Bond A and Bond B?

Bond Prices: Relationship Between Coupon and Yield • If bond price = par value or face value, then bond is selling at par (YTM = coupon rate) • If bond price < face value, then bond is selling at a discount (YTM > coupon rate) • If bond price > face value, then bond is selling at a premium (YTM < coupon rate)

Cash Flow of Bond A $1048. 50 ? ? Today’s yield on one-year US Government bonds 3. 5% Cash Flow of Bond B $1035. 00 $1000. 00 3. 5% Year 1 Price Is Bond A selling at a discount or premium?

Solve for the Price that gives a return of 3. 5% 0. 035 = ($1000 - P) + $48. 50 P or P = $1048. 50/(1+ yield) Solving for P: P = $1013. 04

Interest or Current Yield = Coupon/Price Total Rate of Return or Yield = Current Yield + Capital Gains Yield This is just a breakdown of the annual return on a bond to that portion due to cash flow from the coupon and that due to capital gains.

For who bought the bond at P = $1013. 04 notice the following returns if held for one year: § § Rate of capital gains = ($1000 -1013. 04)/$1013. 04 = -0. 01287 Interest (current) yield = $48. 50/$1013. 04 = 0. 047876 § Total rate of return = -0. 01287 + 0. 047876 = 0. 035 or 3. 5%

• Great for the agent who initially purchased the 1 year 4. 85% bond A. • Bought bond (A) for $1000 • Predicted interest rates would fall • Sold the bond for $1013. 04 • Capital gains for the individual investor • = $1013. 04 - $1000 = $13. 04 and rate of capital gain 1. 304%

Two minutes later the central bank raises interest rates. Newly issued one year bonds yield 6. 1%

Year 1 Yield Today’s Price Cash flow of $1048. 50 Bond A 6. 1% $988. 22 Cash flow of $1035. 00 Bond A 6. 1% $975. 49 Cash flow of $1061. 00 Bond A 6. 1% $1000. 00 Do the bond prices make sense?

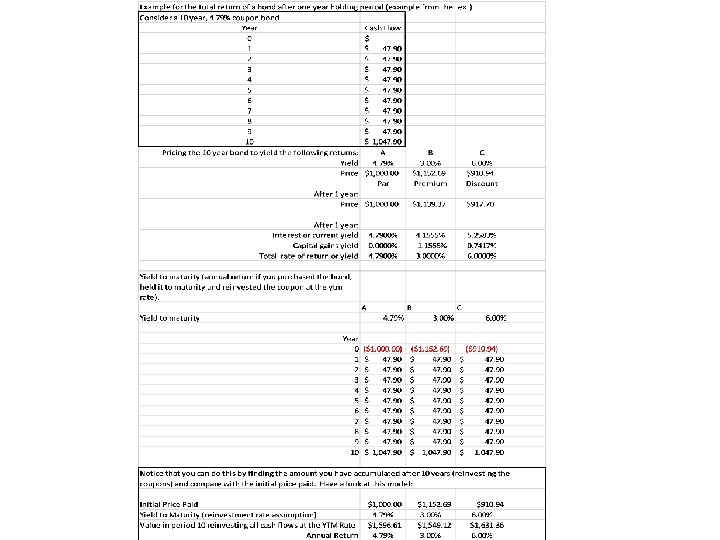
Let’s look at the Total Return or Yield on a single bond after one year: consider a 10 year 4. 79% coupon bond priced to yield 4. 79%. • see the excel file “Example of total return and YTM”
 payments reinvested at YTM")
Yield to maturity as a promised yield; assumes interest (coupon) payments reinvested at YTM rate. Consider a 2 year, 6% bond. Suppose the bond is priced to yield 7%: Pb = $60/(1. 07) + $60/(1. 07)2 + $1000/(1. 07)2 = 981. 92 0 1 $60 2 $60+$1000 $60(1. 07) = $64. 20 (reinvestment of coupon at YTM) In year 2: $64. 20 + $60 + $1000 = $1124. 20…. $1124. 20/(1. 07)2 = $981. 92

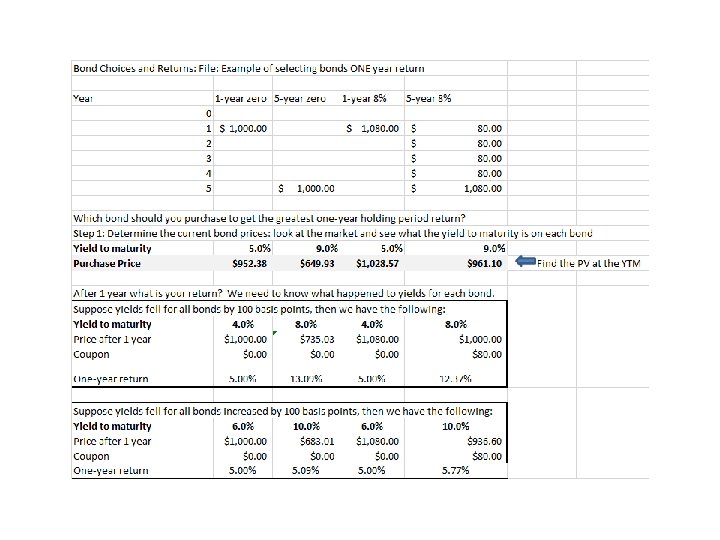
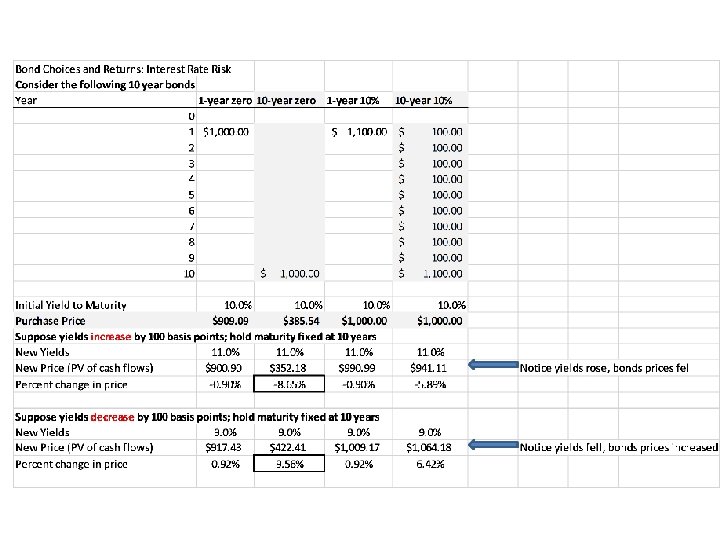
Example of selecting bonds: see Excel Sheet: One Year Returns Example of Interest Rate Changes and Bond Prices: see Excel Sheet: Bonds and Interest Rate Risk

Selecting bonds • To determine which bond strategy to follow, we need to understand what is going to happen to yields (interest rates) as that will determine the capital gains and reinvestment of any coupons. • What determines yields (interest rates)?
 +")
Determinants of interest rates Nominal or quoted rate: rd = (r* + IP) + DRP + LP + MRP rd = r RF + DRP + LP + MRP r d = required return on a debt security r* = real risk-free rate of interest r. RF = quoted risk-free rate IP = inflation premium DRP = default risk premium LP = liquidity premium MRP= maturity risk premium

Real interest rates • Historically 1. 5% to 2. 0% • Sometimes measured as the yield to maturity on short term Treasury Inflation Protected Securities (TIPS)

Inflation risk premium • For a short-term, default-free US T-bill, the actual interest rate charged would be the real risk-free rate plus the (expected) inflation premium: • r T-Bill = r. RF = real rate + IP • Note the IP incorporated into any security is the average rate expected over the security’s life (e. g. , 1 year, 5 year avg. rates). Can estimate expected inflation by the difference in yields on same year Treasuries and TIPS.
 inflation rate over the life")
Inflation risk premium • What is the expected (annual) inflation rate over the life of the asset (bond)? • What factors determine expected inflation? • Compare a 10 -year US Treasury with a 10 -Year US Treasury TIP Annual IP = 10 -year Treasury – 10 -year TIP

Finding the inflation risk premium: 10 year bond example Treasury yields Inflation premium 10 -year bonds = 2. 43% - 0. 47% = 1. 96% each year for 10 -years

Default risk premium • Default risk assesses the probability that the borrower will not pay back either the interest or maturity on a bond. • U. S. government bonds have no default risk. • Default risk assigned by rating agencies such as Moody’s (AAA, A, BBB).

Bond Ratings – Investment Quality • High Grade – Moody’s Aaa and S&P AAA – capacity to pay is extremely strong – Moody’s Aa and S&P AA – capacity to pay is very strong • Medium Grade – Moody’s A and S&P A – capacity to pay is strong, but more susceptible to changes in circumstances – Moody’s Baa and S&P BBB – capacity to pay is adequate, adverse conditions will have more impact on the firm’s ability to pay

Bond Ratings - Speculative • Low Grade – Moody’s Ba, B, Caa and Ca – S&P BB, B, CCC, CC – Considered speculative with respect to capacity to pay. The “B” ratings are the lowest degree of speculation. • Very Low Grade – Moody’s C and S&P C – income bonds with no interest being paid – Moody’s D and S&P D – in default with principal and interest in arrears

Example: December 13, 2015 – Yahoo Finance!

Maturity risk premium = interest rate risk + reinvestment risk

Maturity Risk Premium • Interest rate risk – Change in price due to changes in interest rates – Long-term bonds have more price risk than short-term bonds • Reinvestment Rate Risk – Uncertainty concerning rates at which cash flows can be reinvested – Short-term bonds have more reinvestment rate risk than long -term bonds – High coupon rate bonds have more reinvestment rate risk than low coupon rate bonds

Bond prices and yields

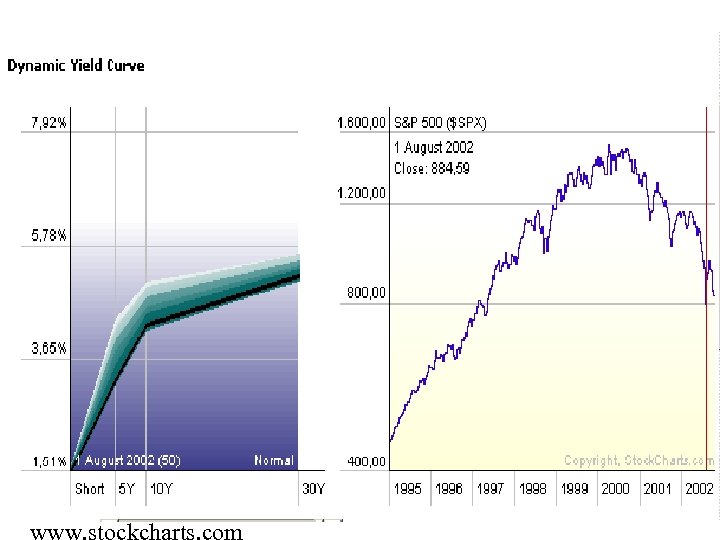
The term structure of interest rates: relationship between bond yields and maturities. • Graph of the term structure of interest rates is known as the yield curve.

Upward-Sloping Yield Curve

Downward-Sloping Yield Curve

What may determine the relationship between a long term bond yield and a short term bond yield? In other words, what information is contained in the shape of the yield curve? • Let’s consider expectations theory.

Pure Expectations Hypothesis • The PEH contends that the shape of the yield curve depends on investor’s expectations about future interest rates. • If interest rates are expected to increase, L-T rates will be higher than S-T rates, and viceversa. Thus, the yield curve can slope up, down, or even bow.

Expectations theory • • Consider you have $1 to invest for a 5 year period. Your choices are: One five-year bond. 5 one-year bonds. Decision based on which investment strategy gives you the highest rate of return.
5 •")
• One 5 -year bond: 5 -year Return = $1(1+r. L, 5)5 • Five 1 -year bonds: 5 -year Return = $1(1+r 1)(1+r 2 e)···(1+r 5 e) where r 1, r 2, … r 5 are the short term nominal interest rates for each year and r. L, 5 is the 5 -year nominal bond rate and “e” means a rate is the expected rate.

• If markets are efficient, the rates of return on the two 5 year investments with the same risk should be equal. Why? • $1(1+r. L, 5)5 = $1(1+r 1)(1+r 2 e)···(1+r 5 e)

Solve for r. L, 5 in terms of r 1, r 2, …r 5 • $1(1+r. L, 5)5 = $1(1+r 1)(1+r 2 e)···(1+r 5 e) • Solving for r. L, 5 (today’s yield on the 5 -year bond:

Example: what do markets expect today for the yield on a 1 -year bond in one year? (1 +. 07) 2 = (1 +. 05)(1+r 2 e)
 Maturity 1 year 2")
An example: Observed Treasury rates and the Expectations hypothesis (EH) Maturity 1 year 2 years 3 years 4 years 5 years Yield 6. 0% 6. 2% 6. 4% 6. 5% If EH holds, what does the market expect will be the interest rate on one-year securities, one year from now? Three-year securities, two years from now?
2 =")
Using the geometric mean to get the one year forward rate (1. 062)2 = (1. 06)(1+r 2 e) Solve for r 2 e.
5 = (1 + 0. 062)2(1")
Three-year security, two years from now (1 +. 065)5 = (1 + 0. 062)2(1 + x)3 Solve for x, the three year forward rate two years from now.

What factors influence short term nominal interest rates? • Examine at the money market (factors: central bank, GDP, inflation) r MS re Md (Y, P) Money

www. stockcharts. com

Some uses of the yield curve • • Forecast future short term interest rates. Detect under/overpriced securities. Ride the yield curve. Assess financial institutions.

Bond Investment Problem You have to decide whether or not to undertake the investment strategy of buying a 5 -year bond, waiting three years and selling the bond. Assume that all bonds are zero coupon bonds.

Probability distributions

Risk versus uncertainty • What is the difference between risk and uncertainty? There is a large discussion on this so, it may be helpful to begin by considering that we can assign a probability to an event if we have a known probability function, versus not knowing which probability function to use! • The economist, Frank Knight, wrote about this in his 1921 book: “Risk, Uncertainty, and Profit. ”

The Federal Reserve System

Source: European. Union. Maps. com

Crude Oil Prices - 70 Year Historical Chart Interactive charts of West Texas Intermediate (WTI or NYMEX) crude oil prices per barrel <a href='http: //www. macrotrends. net/1369/crude-oil-price-history-chart'>Crude Oil Prices - 70 Year Historical Chart</a>
fde08d68aa15110ed09c71d7b6c98f74.ppt