5e66be1e20b61fc37f235fb56e2f8a4d.ppt
- Количество слайдов: 74


Bioinformatics and Genome Annotation Shane C Burgess http: //www. agbase. msstate. edu/

NIH WORKING DEFINITION OF BIOINFORMATICS AND COMPUTATIONAL BIOLOGY July 17, 2000 Bioinformatics: Research, development, or application of computational tools and approaches for expanding the use of biological, medical, behavioral or health data, including those to acquire, store, organize, archive, analyze, or visualize such data. Computational Biology: The development and application of data-analytical and theoretical methods, mathematical modeling and computational simulation techniques to the study of biological, behavioral, and social systems.

Biocomputing: computational biology & bioinformatics Gene Ontology Consortium members

Dr Fiona Mc. Carthy Dr Susan Bridges Dr Teresia Buza Dr Nan Wang Cathy Grisham Dr Divya Pedinti Philippe Chouvarine Lakshmi Pillai

Sequencing is getting cheaper Cost of human or similar sized genome Source: Richard Gibbs, Baylor College of Medicine and biocomputing becomes more of an issue.

A. 1. 2. 3. 4. 5. 6. 7. 8. 9. Complexity Sequence itself and from all it’s compatriots and assorted microbes SNPs Transcripts (all of them…don’t forget alternative splicing, starts) CNVs Epigenetic changes to DNA Proteome (expression, epigenetics, PTMs, location, flux, enzyme kinetics) Metabolites Phenotypes Drugs B. Statistical. 1. Multiple testing problem. 2. Search space Both have potential computationally-intensive solutions (Monte Carlo/Resampling/ Permutation/Bootstrap and target/decoy). C. Information: publications are no longer the sole source of “valid” or “legitimate” information. Trusted databases and not just publications used as research sources; not just data but also community annotations etc D. Biocomputing issues: LOCAL--storage, compute power (CPUs days), RAM; DISTANT– linking, data movement, cyberinfrastucture (hard, soft and human). E. How and who?

Titus Brown, Mich. SU
 e. g. Amazon. For the first")
Storage costs A. Simple Storage Service (S 3) e. g. Amazon. For the first 50 TB = 15 US cents/Gb ($7, 500/50 TB) plus pay for data transfer and operations. VS Buy, store and scale as needed e. g. Web Object Scaler (WOS) Immediate or “longer” term solution Putting Genomes in the Cloud. Making data sharing faster, easier and more scalable. By M. May, May 18, 2010.
/second")
10 Gigabits (Gb)/second
 predicted")
Annotation: Nomenclature, Structural & Functional Nomenclature Structural Annotation: • Open reading frames (ORFs) predicted during genome assembly • predicted ORFs require experimental confirmation Functional Annotation: • annotation of gene products = Gene Ontology (GO) annotation • initially, predicted ORFs have no functional literature and GO annotation relies on computational methods (rapid) • functional literature exists for many genes/proteins prior to genome sequencing • Gene Ontology annotation does not rely on a completed genome sequence

Livestock Gene Nomenclature: Jim Reecy et al. , International Society for Animal Genetics from 26 th – 30 th July 2010, Edinburgh Chicken Gene Nomenclature • 1995: chicken gene nomenclature will follow HGNC guidelines • 2007: chicken biocurators begin assigning standardized nomenclature • 2008: first CGNC report; NCBI begins using standardized nomenclature & CGNC links • 2010: first dedicated chicken gene nomenclature biocurator; NCBI/Ag. Base/Marcia Miller – structural annotation & nomenclature for MHC regions (chr 16) • Chicken gene nomenclature database – UK & US databases sharing and co-coordinating data.

http: //edit-genenames. roslin. ac. uk/ Available via Bird. Base & Ag. Base

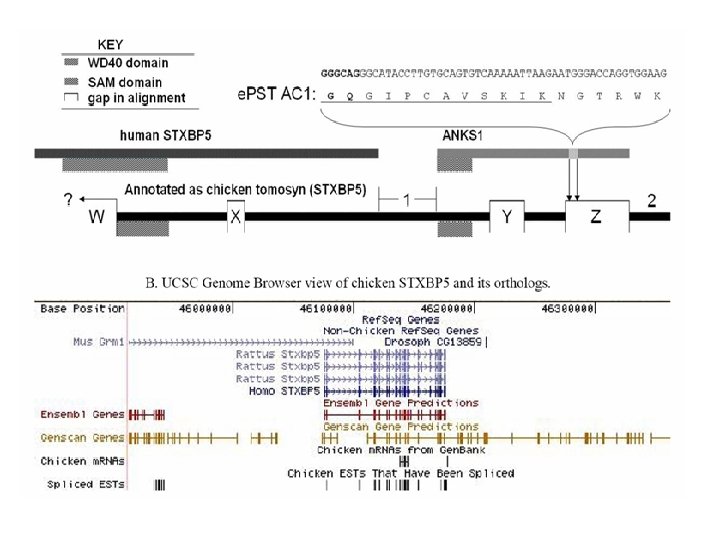
Experimental Structural genome annotation Proteogenomic mapping

Problems with Current Structural Annotation Methods • EST evidence is biased for the ends of the genes • Computational gene finding programs – Misidentify some, and especially short, genes. – Overlook exons – Incorrectly demarcate gene boundaries, especially splice junctions

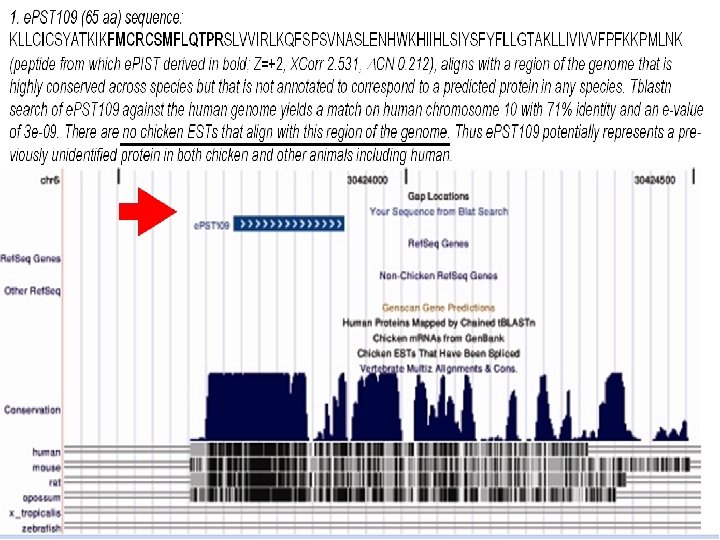
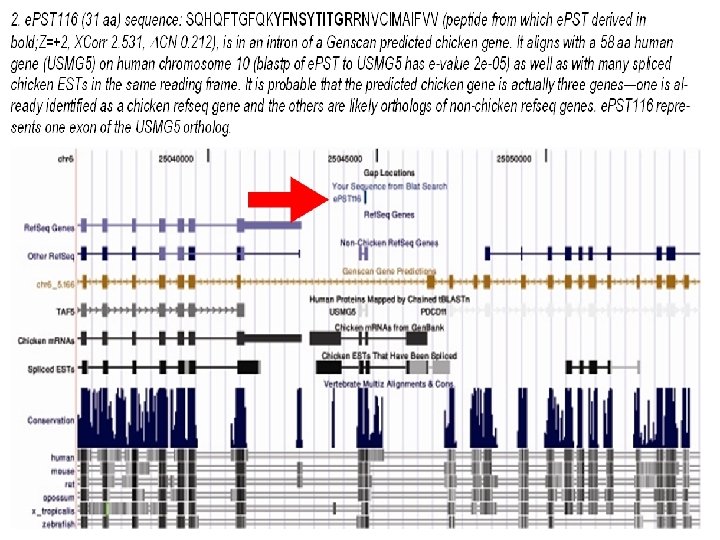
Proteogenomic Mapping • Combines genomic and proteomic data for structural annotation of genomes • First reported by Jaffe et al. at Harvard in 2004 in bacteria • Mc. Carthy et al. 2006 first applied in chicken (one of the first uses in a eukaryote; the other two in human). • Improves genome structural annotation based on expressed protein evidence – Confirms existence of predicted protein-coding gene – Identifies exons missed by gene finder – Corrects incorrect boundaries of previously identified genes – Identifies new genes that the gene finding programs missed

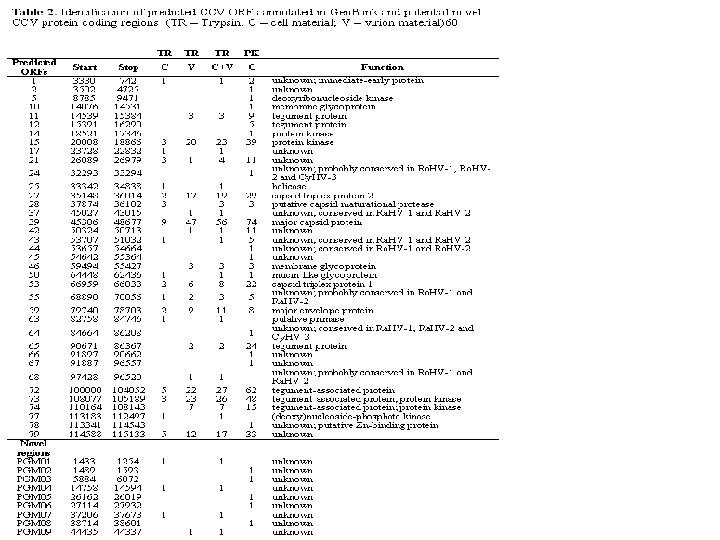
CCV genome was sequenced in 1992 But only 12 of predicted 76 ORFs confirmed to exist as proteins. Confirmed 37/76. Identified 17 novel ORFs that were not predicted.

Structural Annotation of the Chicken Genome • Location of genes on the genome • Computational gene finding programs such as Gnomen (NCBI) based on Markov Models and also use – ESTs – Known proteins – Sequence conservation

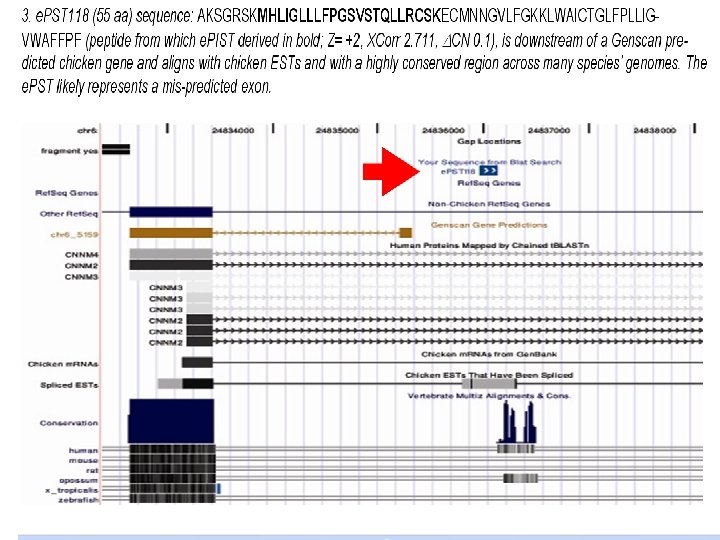
e. PST Generation Process Peptide nucleotide sequence chromosome Map peptide nucleotide sequence to chromosome

Biological Sample Trypsin Digestion LC ESI-MS/MS Data Search against protein Database Search against genome translated in 6 reading frame Peptide matches Generate e. PST (expressed Peptide. Sequence Tags) from peptides matching genome only Confirm predicted proteincoding gene Correction / validation of genome annotation Novel protein-coding gene

e. PST Generation Process Peptide nucleotide sequence Stop codon chromosome Locate first downstream in-frame stop codon or canonical splice junction

e. PST Generation Process Peptide nucleotide sequence Stop codon chromosome Locate upstream canonical splice junction or in-frame stop

e. PST Generation Process Peptide nucleotide sequence Stop codon chromosome Start codon Find 1 st start codon between in-frame stop and peptide

e. PST Generation Process chromosome Use splice junction or in-frame start as beginning of e. PST

e. PST Generation Process chromosome e. PST coding nucleotide sequence Translate Expressed Peptide Sequence Tag (e. PST) amino acid sequence

Functional annotation

No. x 106 25000 18 16 20000 14 12 15000 10 8 10000 6 4 5000 2 0 0 ‘ 01 ‘ 02 ‘ 03 ‘ 04 ‘ 05 ‘ 06 ‘ 07 ‘ 08 ‘ 09 YEAR 70 75 80 85 90 95 00 05

Ontologies Canonical and other Networks GO Cellular Component Pathway Studio 5. 0 GO Biological Process Ingenuity Pathway Analyses GO Molecular Function Cytoscape BRENDA Interactome Databases Functional Understanding

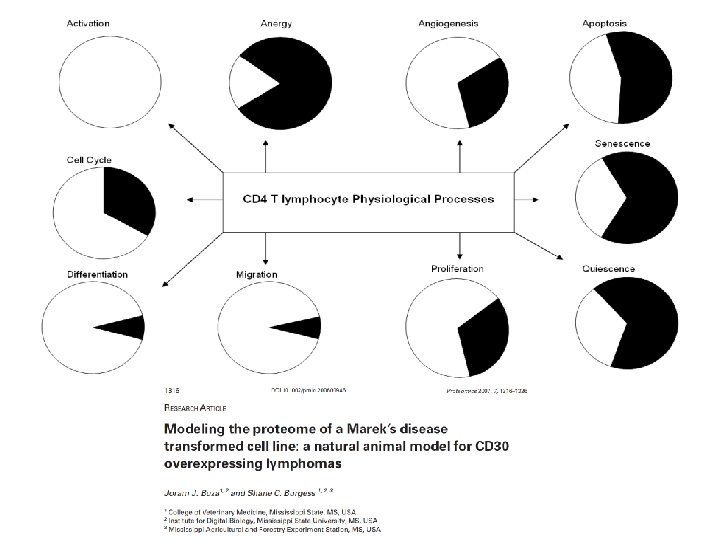
Biological interpretation Gene Ontology Derived Network Modeling Implied Physiology (= Cellular Component + Biological Process + Molecular Function)

What is the Gene Ontology? “a controlled vocabulary that can be applied to all organisms even as knowledge of gene and protein roles in cells is accumulating and changing” • the de facto standard for functional annotation • assign functions to gene products at different levels, depending on how much is known about a gene product • is used for a diverse range of species • structured to be queried at different levels, eg: – find all the chicken gene products in the genome that are involved in signal transduction – zoom in on all the receptor tyrosine kinases • human readable GO function has a digital tag to allow computational analysis of large datasets COMPUTATIONALLY AMENABLE ENCYCLOPEDIA OF GENE FUNCTIONS AND THEIR RELATIONSHIPS

GO is the “encyclopedia” of gene functions captured, coded and put into a directed acyclic graph (DAG) structure. In other words, by collecting all of the known data about gene product biological processes, molecular functions and cell locations, GO has become the master “cheat-sheet” for our total knowledge of the genetic basis of phenotype. Because every GO annotation term has a unique digital code, we can use computers to mine the GO DAGs for granular functional information. Instead of having to plough through thousands of papers at the library and make notes and then decide what the differential gene expression from your microarray experiment means as a net affect, the aim is for GO to have all the biological information captured and then retrieve it and compile it with your quantitative gene product expression data and provide a net affect.

Use GO for……. 1. Determining which classes of gene products are over-represented or under-represented. 2. Grouping gene products. 3. Relating a protein’s location to its function. 4. Focusing on particular biological pathways and functions (hypothesis-testing).

Many people use “GO Slims” which capture only high-level terms which are more often then not extremely poorly informative and not suitable for hypothesis-testing. “GO Slim” In contrast, we need to use the deep granular information rich data suitable for hypothesis-testing

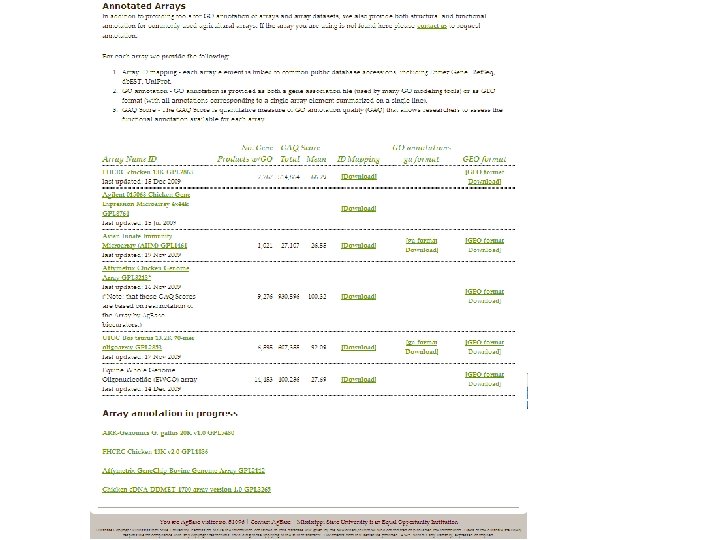
Sourcing displaying GO annotations: secondary and tertiary sources.

GO Consortium: Reference Genome Project • Limited resources to GO annotate gene products for every genome – rely on computational GO annotations – most robust method is to transfer GO between orthologs • Reference genome project: goal is to produce a “gold standard” manually biocurated GO annotation dataset for orthologous genes – 12 reference genomes – chicken is only agricultural species – Chicken RGP contributions provided via USDA CSREES MISV -329140 http: //www. geneontology. org/GO. refgenome. shtml

RGP & Taxonomy checks • Transferring GO annotation between orthologs requires: – determining orthologs – computational prediction followed by manual curation – developing ‘sanity’ checks to ensure transferred functions make sense phylogenetically (eg. no lactating chickens!)

Further taxon checking comments may be added here, or contact the Ag. Base database.

Ag. Base Quality Checks & Releases Ag. Base Biocurators ‘sanity’ check Ag. Base biocuration interface ‘sanity’ check & GOC QC Ag. Base database ‘sanity’ check EBI GOA Project ‘sanity’ check: checks to ensure all appropriate information is captured, no obsolete GO: IDs are used, etc. GO analysis tools Microarray developers ‘sanity’ check & GOC QC GO Consortium database Uni. Prot db Quick. GO browser GO analysis tools Microarray developers Public databases Ami. GO browser GO analysis tools Microarray developers

Comparing Ag. Base & EBI-GOA Annotations 14, 000 computational manual - sequence Gene Products annotated 12, 000 manual - literature 10, 000 8, 000 Complementary to EBI-GOA: Genbank proteins not represented in Uni. Prot & EST sequences on arrays 6, 000 4, 000 2, 000 0 Ag. Base Chick EBI-GOA Ag. Base Chick Cow Project EBI-GOA Cow

Contribution to GO Literature Biocuration Ag. Base EBI GOA Chicken 97. 82% EBI-Int. Act Roslin < 0. 50% HGNC UCL-Heart project MGI Cow Reactome 88. 78% < 1. 50%
 Array. IDer GORetriever gene products with")
INPUT: functional genomics data (e. g. Microarray data) Array. IDer GORetriever gene products with GO annotations gene products with NO GO annotations GOanna BLAST output Manual interpretation of GOanna output gene products with orthologs and GO annotations GAQ Score GOanna 2 ga comprehensive GO annotation gene products with NO orthologs OR with orthologs but NO GO annotations GA 2 GEO (existing GO analysis programs) data visualization Biocuration from literature biocurated annotations from literature or specialist knowledge GOModeler GOSlim. Viewer NO literature or specialist knowledge that can be used to make GO annotations Specific: user-defined, hypothesis-driven, quantitative data presentation must wait on experimental evidence or new electronic inference Generic: qualitative data presentation. Analysis can only be changed if user has programming skills

2010 GO Training Opportunities - on site training by request/interest - webinar: notification via ANGENMAP & GO discussion groups To request a workshop contact Fiona Mc. Carthy fmccarthy@cvm. msstate. edu OR agbase@cse. msstate. edu

200 Workshop Surveys GO training strongly agree Annual uncertain disagree strongly disagree Cumulative 150 I would recommend this workshop No. of people 100 I am confident I can get GO questions answered 50 I am confident in using GO for modeling Topics were well explained 0 2007 2008 2009 Topics covered were relevant Year workshops offered 2009 Workshop hosts: ISU – Dr Susan Lamont NCSU – Dr Hsiao-Ching Liu 10 20 30 40 % of respondents 50 60

Chicken Array Usage Number of participants: 25 Number of arrays: 22 Number of votes: 41 Neuroendocrine Arizona 20. 7 K UD_Liver_3. 2 K ARK-Genomics Bovine array usage Number of participants: 26 Number of arrays: 26 Number of votes: 42 UD 7. 4 K Metabolic/Somatic Agilent 44 K array UIUC 13. 2 K Affymetrix Agilent 44 k Bovine Total Leukocyte c. DNA Affymetrix UIUC 7, 872 element

Quality improvement Microarray annotations

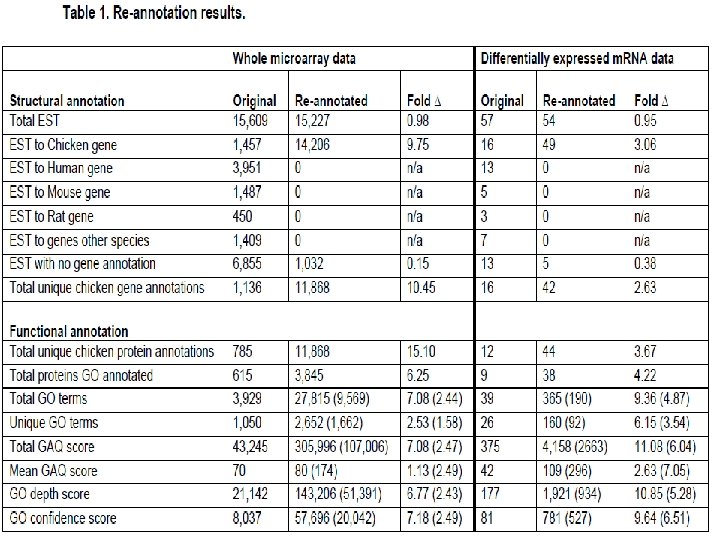
• Most microarray analysis tools do not readily accept EST clone names (abundantly on arrays). • Manual re-annotation of microarrays is impracticable • Retrieves the most recent accession mapping files from public databases based on EST clone names or accessions and rapidly generates database accessions. • Fred Hutchinson Cancer Research Centre 13 K chicken c. DNA array • structurally re-annotated 55% of the array; decreased non-chicken functional annotations by 2 fold; identified 290 pseudogenes, 66 of which were previously incorrectly annotated.

Zhou H, Lamont SJ: Global gene expression profile after Salmonella enterica Serovar enteritidis challenge in two F 8 advanced intercross chicken lines. Cytogenet Genome Res 2007; 117: 131 -138 (DOI: 10. 1159/000103173)
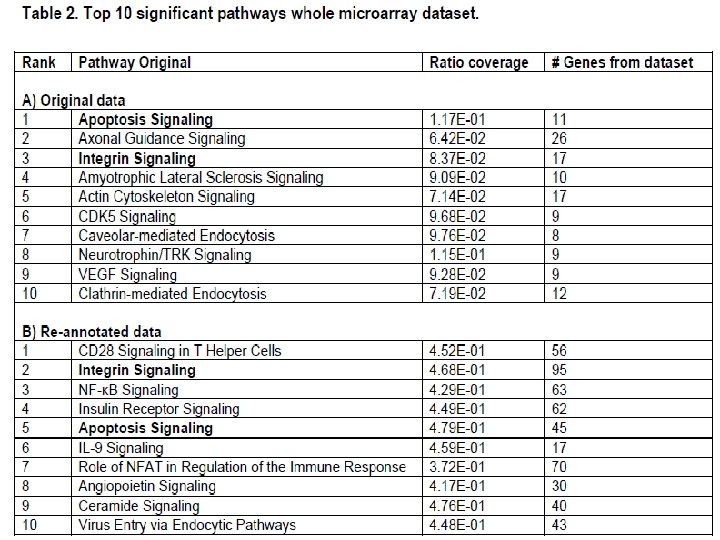
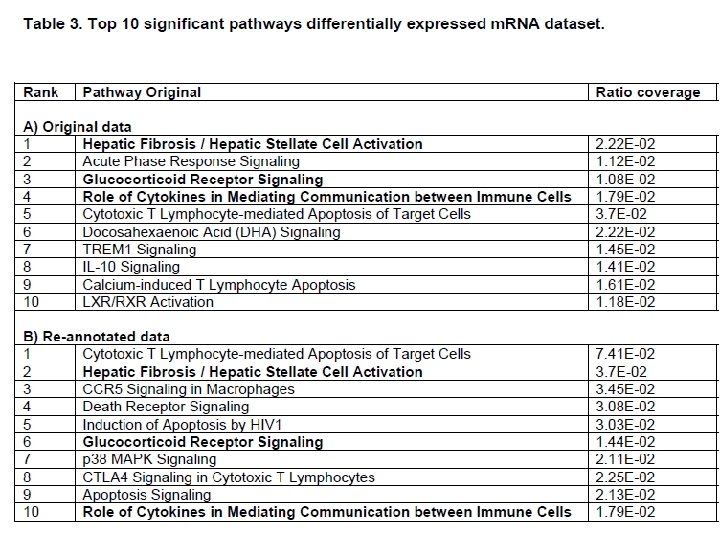

1. Increased the pathway coverage of several major immune response pathways and provided more comprehensive modelling of signalling pathways e. g. FAS : originally not annotated but now pathways involving FAS identified. 2. Confirm and consolidate previous suggestions that CD 3 e, IL-1β, and CCL 5 differential expression involved in the immune response to SE. Chicken-specific functional annotation of these genes allowed identification of these gene’s related pathways with statistical confidence. 3. Identified additional genes involved in major immune pathways important in bacterial gut disease but not identified in the original work e. g. tyrosine phosphatase type IVA member 1 (PTP 4 A 1); CD 28; T-cell co-stimulator (ICOS, CD 287) and NK-lysin and associated pathway genes.

Bacterial functional genomic responses to structural differences in explosive compounds. KTR 9 and V. fischeri proteomics

Quantifying re-annotation Metrics Granularity Specificity # previous annotations # chicken annotations # re-annotations # human/mouse annotations Quality Gene Ontology Annotation Quality (GAQ) score

• Do. D: Bobwhite Quail Toxicogenomics kb Reads in annotated gene regions + 20 radius of GO annotations Number of gene products with GO • Reads in “RNAFAR” regions i. e. clustered reads forming novel transcripts (these reads do not belong to any gene model the reference set and can either be assigned to neighboring gene models, if they are within a specified threshold GAQ score or assigned their own Total radius, Mean GAQ score predicted transcript model. • Repeats with > 10 alignments • Reads overlapping annotated repeat regions • Unmapped reads • Other (regulatory, etc. do not include reads discarded as poor quality). 35, 000 4, 500 4, 000 30, 000 3, 500 25, 000 3, 000 20, 000 2, 500 15, 000 2, 000 1, 500 10, 000 1, 000 500 0 0 Original Reannotated 450, 000 400, 000 350, 000 300, 000 250, 000 200, 000 150, 000 100, 000 50, 000 0 Original Reannotated

GO Cellular Component DAG

Differential Detergent Fractionation DDF Fraction 1 2 3 4 2007. Non-electrophoretic differential detergent fractionation proteomics using frozen whole organs. Rapid Commun Mass Spectrom 21: 3905 -9. 2007. Sequential detergent extraction prior to mass spectrometry analysis. Methods in Molecular Medicine: Proteomic analysis of membrane proteins. Humana Press. 117 (1 -4): 278 -87. 2005. Differential detergent fractionation for non-electrophoretic eukaryote cell proteomics. Journal of Proteome Research. 4 (2), 316 -324.

Sub-cellular localization of pro-PCD proteins. One mechanism controlling PCD is the release of “pro-death” proteins mitochondria into the cytoplasm or nucleus. B-cells C Stroma Cyt. C Apaf 1 M AMID N Endo. G AIF Smac

-2 -3 Cancer Immunology and Immunotherapy, 2008. 57: 1253 -62 -7 D A SM -8 3 -4 A PR G TL C Fb TG g 3 -7 D A SM -4 -8 PR G A TL C g Fb TG N IF 8 -1 3 IL -1 2 IL -1 0 IL -8 IL -6 IL -4 -2 IL -1 IL Protein IF N 12 IL - 10 2 IL - 3 IL - 13 0 8 6 IL - 1 IL - IL 4 2 4 -1 8 IL -1 IL - IL Neoplastic compared to Hyperplastic lymphoma cells (%) 100000 m. RNA 10000 100 10 1

IL-18 distribution: it matters where proteins are 35 1 2 30 Hyperplastic Lymphocytes 3 4 25 20 15 10 5 Extracellular 0 1 2 3 4 DDF Fraction 80 70 Neoplastic Lymphocytes (T-reg) 60 50 40 30 Shack et al. , Cancer Immunology and Immunotherapy, 2008. 57: 1253 -62 20 10 0 Nuclear

Translation to clinical research Bindu Nanduri Pig Total m. RNA and protein expression was measured from quadruplicate samples of control, electroscalple and harmonic scalple-treated tissue. Differentially-expressed m. RNA’s and proteins identified using Monte-Carlo resampling 1. Using network and pathway analysis as well as Gene Ontology -based hypothesis testing, differences in specific phyisological processes between electroscalple and harmonic scalpletreated tissue were quantified and reported as net effects. (1) Nanduri, B. , P. Shah, M. Ramkumar, E. A. Allen, E. Swaitlo, S. C. Burgess*, and M. L. Lawrence*. 2008. Quantitative analysis of Streptococcus Pneumoniae TIGR 4 response to in vitro iron restriction by 2 -D LC ESI MS/MS. Proteomics 8, 2104 -14.

Proportional distribution of protein functions differentially-expressed by Electro and Harmonic Scalpel Electroscalpel HYPOTHESIS TERMS Harmonic Scalpel immunity (primarily innate) inflammation Wound Healing Lipid metabolism response to Thermal Injury angiogenesis hemorrhage Total differentially-expressed proteins: 509 Total differentially-expressed proteins: 433

Net functional distribution of differentially-expressed proteins Harmonic Scalpel Electroscalpel hemorrhage sensory response to pain angiogenesis response to thermal injury Lipid metabolism Wound healing classical inflammation (heat, redness, swelling, pain, loss of function) immunity (primarily innate) 8 6 4 2 0 Relative bias 2 4 6
5e66be1e20b61fc37f235fb56e2f8a4d.ppt