91026b90b8c5c901d6e6f5f1ca8d16e6.ppt
- Количество слайдов: 46

Best Practices of Exchange Server Preventative Maintenance Brett Johnson Brettjo@microsoft. com GTSC (UK) Exchange Escalation Engineer Microsoft Services UK
Agenda What is Preventative Maintenance? Configuring Exchange Preparing for Exchange Maintaining Exchange Checklists QA
What is preventative maintenance? Prevention IS better than cure > 60% of problems are people / process not technology Reliability of any system is subject to the reliability of its components Problems are the exception, not the rule.
What is preventative maintenance? Around 90% Of Exchange Administrators never attempt maintenance until disaster hits…Why? Low understanding of issues and problems No time, resources, or budget to address maintenance tasks Impact of “testing” with their production servers Assume the risk of doing nothing outweighs the risk of pro-active maintenance Technically capable of performing maintenance tasks, however they realise that the process of maintenance can be boring and take a long time
Configuring Microsoft Exchange
Configuring Exchange Hardware Consistent Hardware Configurations Select High-Quality Hardware Updated Firmware and Drivers Hardware Compatibility List Memory Use ECC Memory Use Ample Memory (Max 4 GB)
Configuring Exchange Disk Correct Disk Caching Configuration Hardware RAID vs. Software RAID Disk Volume Configuration Recommended Disk Layouts C: SYSTEM DRIVE - RAID 1 (mirror) 2 Partitions: 1 For System Files, 1 For Page File and MTA Data (x 400) E: SMTP QUEUES - RAID 0+1 (stripe / mirror) 1 Partition: SMTP mail queues. F: TRANSACTION LOGS - RAID 0+1 (stripe / mirror) 1 Partition, Exchange Transaction Logs. G: DATABASE FILES - RAID 0+1 (stripe /mirror) or RAID 5 1 Partition, Exchange EDB Files.
Configuring Exchange Disk (Cont’d) Ensure Sufficient Disk Space Exchange Transaction Log Volumes Plan for storage and I/O Avoid Disk Compression
Configuring Exchange Windows Server Consistent Software Versions Set Maximum Log Size to 16 MB and Overwrite Events as Needed Configure Dr. Watson as the Default Debugger Set Recovery Options Make Sure There Is DC Resilience If Running Win 2003 Server And Have > 1 GB Ram. . /3 GB
Configuring Exchange Microsoft Exchange Configuration Disable Circular Logging Set IS Maintenance Window (Staggered) Set Maximum Mailbox Quotas Permission With Groups Not Users Have A Solid Naming Convention Use The Administrative Notes Field !
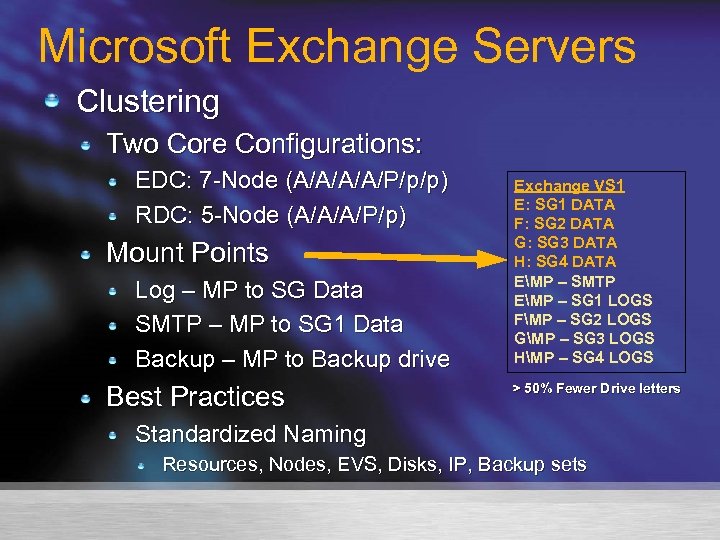
Microsoft Exchange Servers Clustering Two Core Configurations: EDC: 7 -Node (A/A/P/p/p) RDC: 5 -Node (A/A/A/P/p) Mount Points Log – MP to SG Data SMTP – MP to SG 1 Data Backup – MP to Backup drive Best Practices Exchange VS 1 E: SG 1 DATA F: SG 2 DATA G: SG 3 DATA H: SG 4 DATA EMP – SMTP EMP – SG 1 LOGS FMP – SG 2 LOGS GMP – SG 3 LOGS HMP – SG 4 LOGS > 50% Fewer Drive letters Standardized Naming Resources, Nodes, EVS, Disks, IP, Backup sets
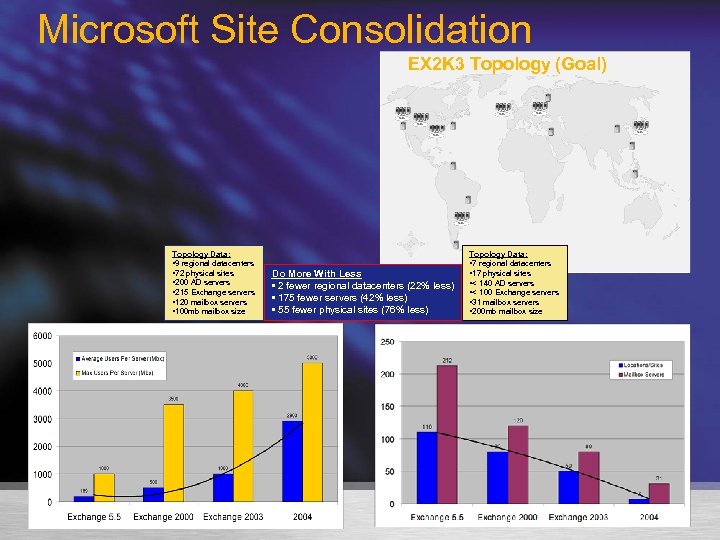
Microsoft Site Consolidation EX 2 K 3 Topology (Goal) Topology Data: • 9 regional datacenters • 72 physical sites • 200 AD servers • 215 Exchange servers • 120 mailbox servers • 100 mb mailbox size Do More With Less • 2 fewer regional datacenters (22% less) • 175 fewer servers (42% less) • 55 fewer physical sites (76% less) Topology Data: • 7 regional datacenters • 17 physical sites • < 140 AD servers • < 100 Exchange servers • 31 mailbox servers • 200 mb mailbox size
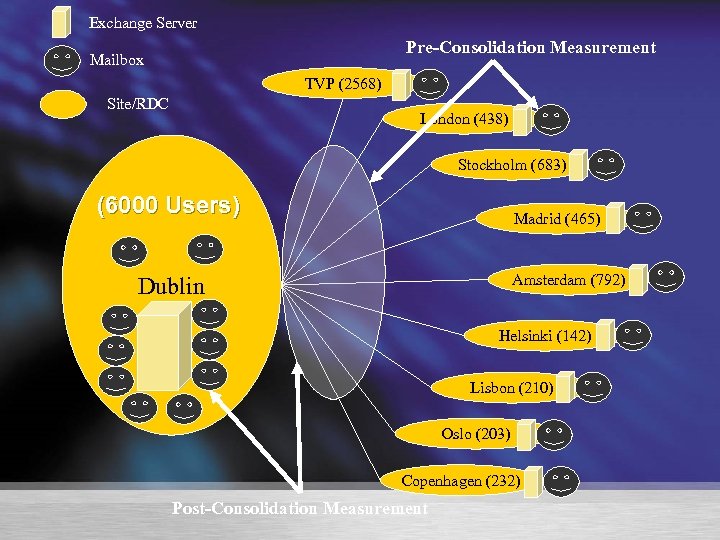
Exchange Server Pre-Consolidation Measurement Mailbox TVP (2568) Site/RDC London (438) Stockholm (683) (6000 Users) Madrid (465) Amsterdam (792) Dublin Helsinki (142) Lisbon (210) Oslo (203) Copenhagen (232) Post-Consolidation Measurement

Preparing For Microsoft Exchange
Preparing For Exchange Server Configuration Log This includes: Firmware and BIOS revisions Installed software and version information Service packs Hot-fixes Symbols Hardware Services Network configuration Repair and Recovery information These records are useful in several ways: Enforce consistency, determine which servers require upgrades Good information to Microsoft support engineers
Preparing For Exchange Create A Operations Log Create Test Accounts Acquire A Production Test Server
Preparing For Exchange Maintenance Plan Maintenance Windows Upfront (Clustering) Plan Patch And Hot fix Processes Backup Develop a Backup/Restore Plan Standardize Tape Backup Formats Recovery and Troubleshooting Planning Backup Contingency Plan for Oversize Stores Fix/Resolve All Hardware Problems Immediately Build a Spare Parts Inventory at Your Site Perform Periodic Server Recovery Drills

Maintaining Microsoft Exchange…The Good Stuff
Maintaining Exchange Backup and Restore Daily Full Online Backups of the Information and Directory Stores ***even if you are using VSS Online backups check the integrity of the Exchange stores by performing checksum verification Full online backups manage the size of the transaction log volume by purging transaction logs at the conclusion of the backup Users may continue to access mailboxes and public folders during an online backup Verify Backups Perform Recovery Drills Monitor Tape Drives for Maintenance
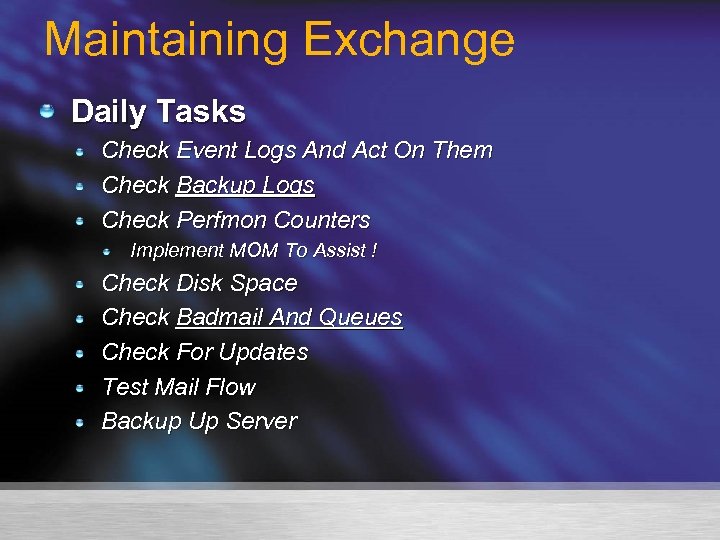
Maintaining Exchange Daily Tasks Check Event Logs And Act On Them Check Backup Logs Check Perfmon Counters Implement MOM To Assist ! Check Disk Space Check Badmail And Queues Check For Updates Test Mail Flow Backup Up Server
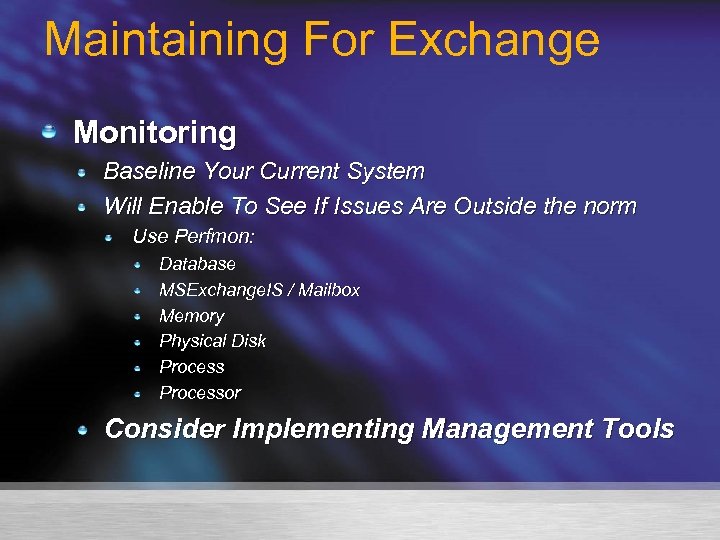
Maintaining For Exchange Monitoring Baseline Your Current System Will Enable To See If Issues Are Outside the norm Use Perfmon: Database MSExchange. IS / Mailbox Memory Physical Disk Processor Consider Implementing Management Tools
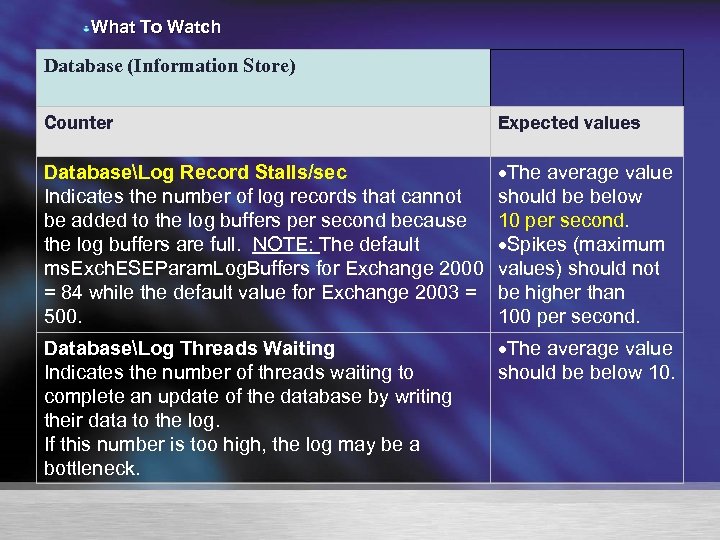
What To Watch Database (Information Store) Counter Expected values DatabaseLog Record Stalls/sec Indicates the number of log records that cannot be added to the log buffers per second because the log buffers are full. NOTE: The default ms. Exch. ESEParam. Log. Buffers for Exchange 2000 = 84 while the default value for Exchange 2003 = 500. The average value should be below 10 per second. Spikes (maximum values) should not be higher than 100 per second. DatabaseLog Threads Waiting Indicates the number of threads waiting to complete an update of the database by writing their data to the log. If this number is too high, the log may be a bottleneck. The average value should be below 10.
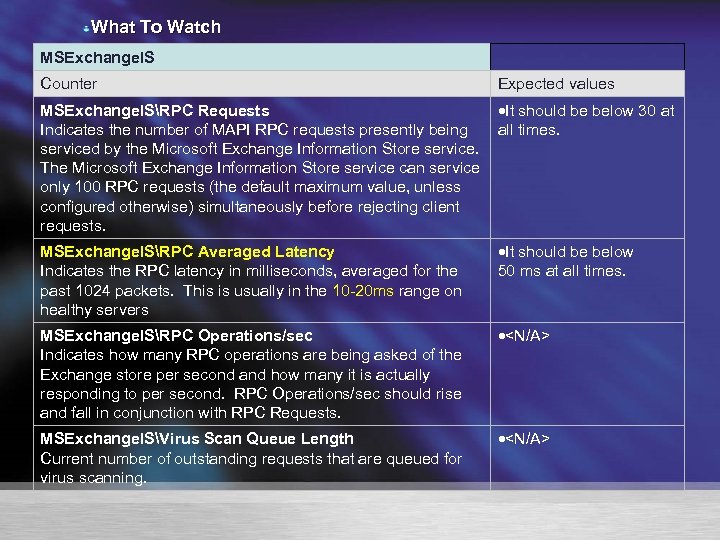
What To Watch MSExchange. IS Counter Expected values MSExchange. ISRPC Requests It should be below 30 at Indicates the number of MAPI RPC requests presently being all times. serviced by the Microsoft Exchange Information Store service. The Microsoft Exchange Information Store service can service only 100 RPC requests (the default maximum value, unless configured otherwise) simultaneously before rejecting client requests. MSExchange. ISRPC Averaged Latency Indicates the RPC latency in milliseconds, averaged for the past 1024 packets. This is usually in the 10 -20 ms range on healthy servers It should be below 50 ms at all times. MSExchange. ISRPC Operations/sec Indicates how many RPC operations are being asked of the Exchange store per second and how many it is actually responding to per second. RPC Operations/sec should rise and fall in conjunction with RPC Requests. <N/A> MSExchange. ISVirus Scan Queue Length Current number of outstanding requests that are queued for virus scanning. <N/A>
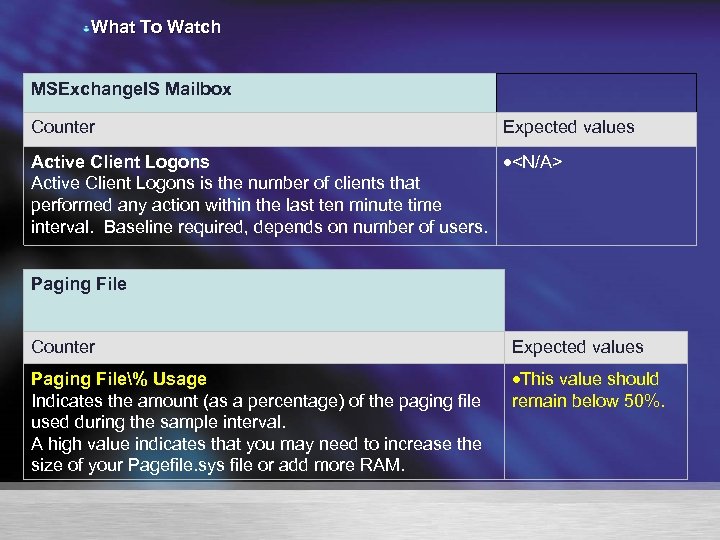
What To Watch MSExchange. IS Mailbox Counter Expected values Active Client Logons <N/A> Active Client Logons is the number of clients that performed any action within the last ten minute time interval. Baseline required, depends on number of users. Paging File Counter Expected values Paging File% Usage Indicates the amount (as a percentage) of the paging file used during the sample interval. A high value indicates that you may need to increase the size of your Pagefile. sys file or add more RAM. This value should remain below 50%.
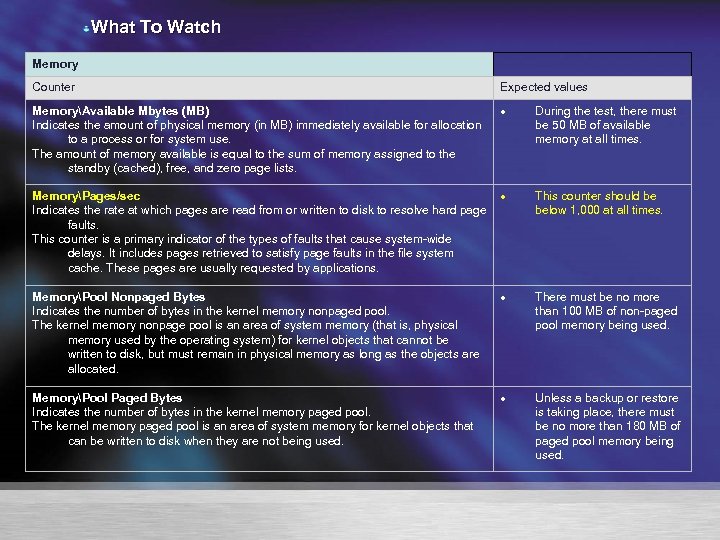
What To Watch Memory Counter Expected values MemoryAvailable Mbytes (MB) Indicates the amount of physical memory (in MB) immediately available for allocation to a process or for system use. The amount of memory available is equal to the sum of memory assigned to the standby (cached), free, and zero page lists. MemoryPages/sec Indicates the rate at which pages are read from or written to disk to resolve hard page faults. This counter is a primary indicator of the types of faults that cause system-wide delays. It includes pages retrieved to satisfy page faults in the file system cache. These pages are usually requested by applications. During the test, there must be 50 MB of available memory at all times. This counter should be below 1, 000 at all times. MemoryPool Nonpaged Bytes Indicates the number of bytes in the kernel memory nonpaged pool. The kernel memory nonpage pool is an area of system memory (that is, physical memory used by the operating system) for kernel objects that cannot be written to disk, but must remain in physical memory as long as the objects are allocated. There must be no more than 100 MB of non-paged pool memory being used. MemoryPool Paged Bytes Indicates the number of bytes in the kernel memory paged pool. The kernel memory paged pool is an area of system memory for kernel objects that can be written to disk when they are not being used. Unless a backup or restore is taking place, there must be no more than 180 MB of paged pool memory being used.
What PSS use time and time again
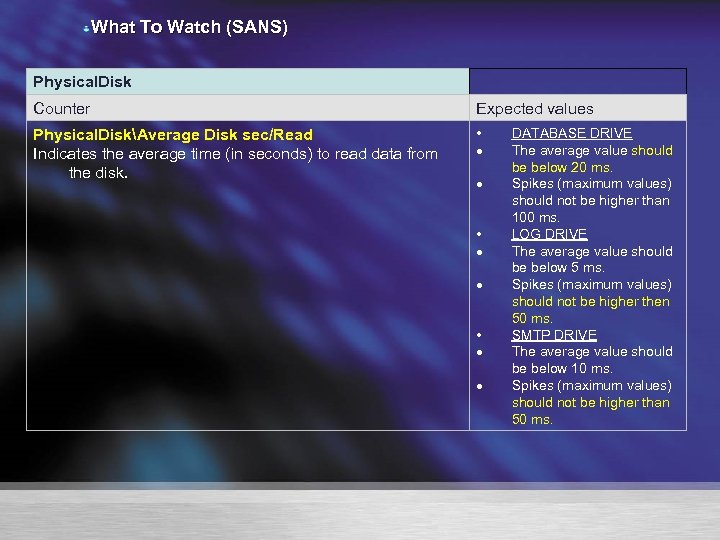
What To Watch (SANS) Physical. Disk Counter Expected values Physical. DiskAverage Disk sec/Read Indicates the average time (in seconds) to read data from the disk. • • • DATABASE DRIVE The average value should be below 20 ms. Spikes (maximum values) should not be higher than 100 ms. LOG DRIVE The average value should be below 5 ms. Spikes (maximum values) should not be higher then 50 ms. SMTP DRIVE The average value should be below 10 ms. Spikes (maximum values) should not be higher than 50 ms.
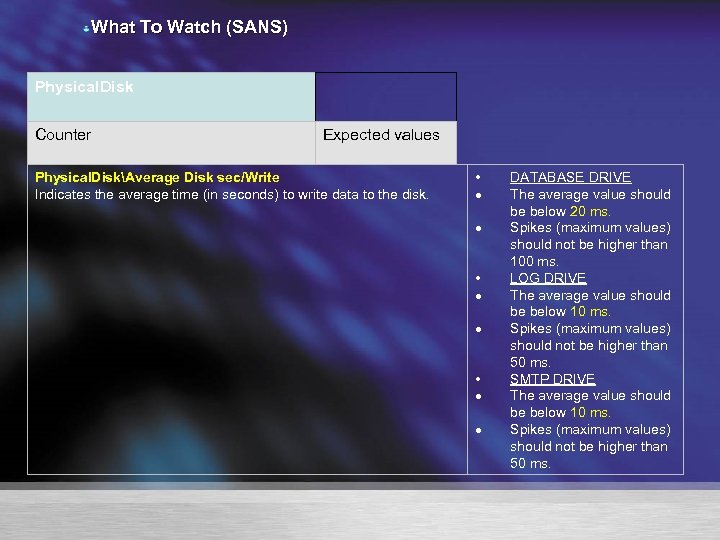
What To Watch (SANS) Physical. Disk Counter Expected values Physical. DiskAverage Disk sec/Write Indicates the average time (in seconds) to write data to the disk. • • • DATABASE DRIVE The average value should be below 20 ms. Spikes (maximum values) should not be higher than 100 ms. LOG DRIVE The average value should be below 10 ms. Spikes (maximum values) should not be higher than 50 ms. SMTP DRIVE The average value should be below 10 ms. Spikes (maximum values) should not be higher than 50 ms.
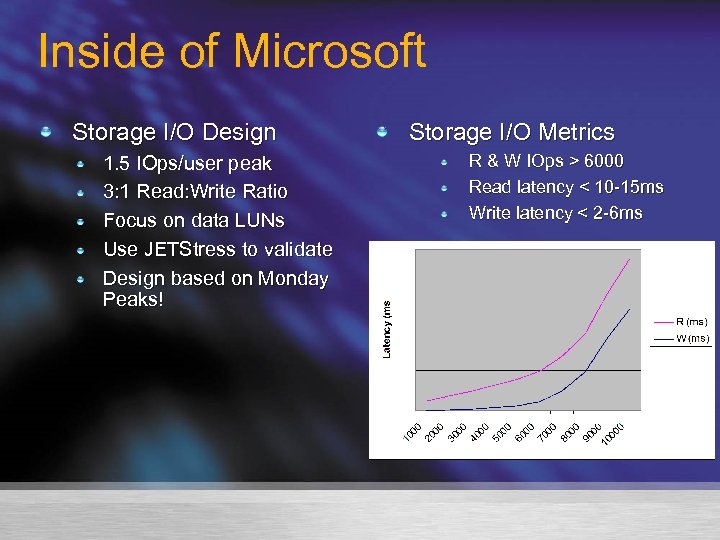
Inside of Microsoft Storage I/O Design 1. 5 IOps/user peak 3: 1 Read: Write Ratio Focus on data LUNs Use JETStress to validate Design based on Monday Peaks! Storage I/O Metrics R & W IOps > 6000 Read latency < 10 -15 ms Write latency < 2 -6 ms
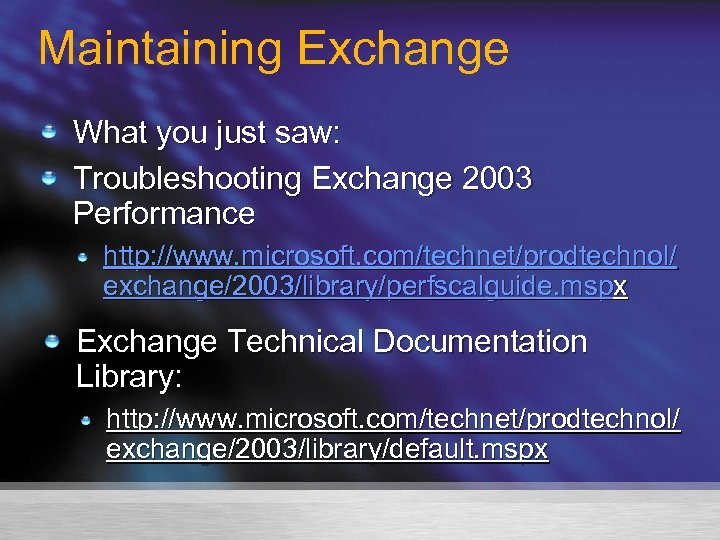
Maintaining Exchange What you just saw: Troubleshooting Exchange 2003 Performance http: //www. microsoft. com/technet/prodtechnol/ exchange/2003/library/perfscalguide. mspx Exchange Technical Documentation Library: http: //www. microsoft. com/technet/prodtechnol/ exchange/2003/library/default. mspx
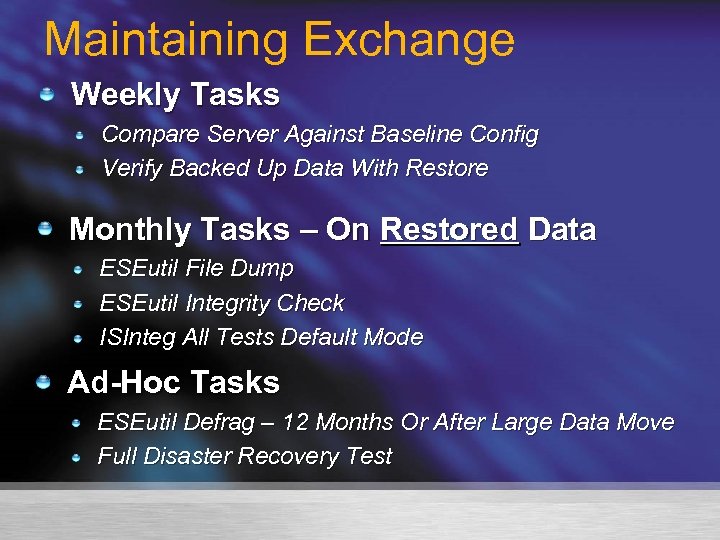
Maintaining Exchange Weekly Tasks Compare Server Against Baseline Config Verify Backed Up Data With Restore Monthly Tasks – On Restored Data ESEutil File Dump ESEutil Integrity Check ISInteg All Tests Default Mode Ad-Hoc Tasks ESEutil Defrag – 12 Months Or After Large Data Move Full Disaster Recovery Test
Maintaining Exchange ESEUtil For Maintenance We Are Interested In: Defragmentation (/d) Integrity (/g) File Dump (/m) Copy File (/y) ESEutil is a powerful tool and needs to be used correctly, for these maintenance procedures we recommend only running against restored data not production boxes or in conjunction with PSS.
Maintaining Exchange Defragmentation – Why? If you have deleted a large amount of mailboxes High Turn Over of Staff Migration If you had to run a hard repair of the database (ESEUtil /p - we do NOT recommend unless this is a last possible thing to do). If you are experiencing a specific issue and have found a reference that says offline defrag will fix it. As a general rule, only defrag to reclaim space if you're going to reclaim more than 30% of the space. You can look for Event ID 1221 after nightly online defrag to get a conservative estimate of how much free space is in the database.
Maintaining Exchange Defragmentation – How? The basic command line to defragment a database is: ESEUTIL /D database. edb To use this simple version of the command: There must be sufficient disk space (110%) on the local logical drive for the temporary defragmentation database. The streaming database must be in the same folder as the. EDB file.
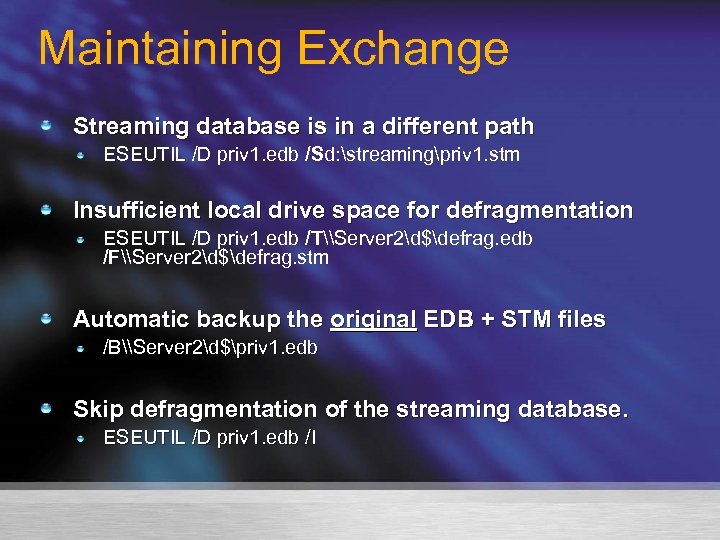
Maintaining Exchange Streaming database is in a different path ESEUTIL /D priv 1. edb /Sd: streamingpriv 1. stm Insufficient local drive space for defragmentation ESEUTIL /D priv 1. edb /T\Server 2d$defrag. edb /F\Server 2d$defrag. stm Automatic backup the original EDB + STM files /B\Server 2d$priv 1. edb Skip defragmentation of the streaming database. ESEUTIL /D priv 1. edb /I
Maintaining Exchange ESE Integrity Check (/g) – Why? “Dry run” of the repair function. Problems that repair would address will be reported in the <database>. integ. raw file The. raw file logs results for all tables in the database, not just ones that have problems May abort prematurely if damage to the database is of such a nature that parts of the database must be repaired before other parts can be checked If it aborts before it finishes does not necessarily mean that repair is unlikely to succeed
Maintaining Exchange Integrity Check (/g) – How? The basic command line syntax to run an integrity check with ESEUtil is: ESEUTIL /G database_filename. edb For example: ESEUTIL /G priv 1. edb To use this simple version of the command: There must be disk space equivalent to 20% of combined size of the. EDB and. STM files. The streaming database must be in the same folder as the. EDB file.
Maintaining Exchange File Dump– Why? View header information for database, streaming database, checkpoint and transaction log files. View header information for individual database pages. Validate that a series of transaction log files forms a matched set and that all files are undamaged. View space allocation inside the database and streaming database files. View metadata for all tables or for a specific table in the database file.
Maintaining Exchange File Dump – How? To view the header of a database, streaming database file or online backup patch file: ESEUTIL /MH {filename. edb | filename. stm | filename. pat} To view the header of a checkpoint file: ESEUTIL /MK filename. chk To view the header of a transaction log file: ESEUTIL /ML filename. log
Defrag, Integrity, File Dump
Maintaining Exchange ISINTEG Focuses on logical database rather than physical (ESEutil). 2 major modes in ISinteg: Default mode: in which the tool runs the tests you specify and reports its findings. Fix mode: where you specify optional switches instructing ISinteg to run the specified tests and attempt to fix whatever it can. For maintenance work we use DEFAULT mode
Maintaining Exchange ISINTEG – How? ISINTEG –S server_name –L logfile_path_and_name –TEST alltests You may also specify individual tests, separating them with commas, For example: -TEST folder, message, Msgref As a general rule, perform all tests in a single ISInteg command. Unless you are addressing a specific, limited problem in the database, running “alltests” is typically the most effective course to follow.
Maintaining Exchange ISINTEG – Notes ISINTEG can be run against remote servers by specifying a remote server name. It is more efficient to run it on the server console. The Information Store service must be running in order for ISINTEG to work, but the database to be checked must be dismounted. You cannot run ISINTEG on raw database files or backups You must run it on a server with Exchange installed and the Information Store running.
Checklists

Q & A
Attend a free chat or web cast http: //www. microsoft. com/communities/chats/default. mspx http: //www. microsoft. com/usa/webcasts/default. asp List of newsgroups http: //communities 2. microsoft. com/communities/newsgroups/enus/default. aspx communities/newsgroups/en-us/default. aspx MS Community Sites http: //www. microsoft. com/communities/default. mspx Locate Local User Groups http: //www. microsoft. com/communities/usergroups/default. mspx Community sites http: //www. microsoft. com/communities/related/default. mspx
91026b90b8c5c901d6e6f5f1ca8d16e6.ppt