65335cd1a76998e1e1fe240759394985.ppt
- Количество слайдов: 77


Beamline 8. 3. 1 PRT organization Funding Hardware Safety management Control system Scientific productivity

Beamline 8. 3. 1 PRT organization Funding Hardware Safety management Control system Scientific productivity

Beam Time Allocation 25% UC Berkeley 2% Pl on xik ex 8% General User Program 5% 10% 25%

Staff PRT Tom Alber PRT Contractees Principal Investigator Member Labs James Holton Beamline Director George Meigs Senior Research Associate Jane Tanamachi Administrator

Beamline 8. 3. 1 PRT organization Funding Hardware Safety management Control system Scientific productivity

Beamline 8. 3. 1 PRT organization Funding Hardware Safety management Control system Scientific productivity

Funding for ALS 8. 3. 1 FY 2006 cost $200, 000 $800, 000 01/07 $116, 000 $748, 000 07/08 $150, 000 $1. 25 M 02/07 UCSD $35, 000 $145, 000 2011 UCSF NIH Center grant $80, 000 $320, 000 6/10 DOE IDAT (SIBYLS) $84, 000 TBD 9/09 NIH STTR (Fluidigm) Total U Alberta Plexxikon Grants End date MD Anderson Contracts Total cost $28, 200 $141, 000 7/08 $693, 200 $3. 4 M -

Beamline 8. 3. 1 PRT organization Funding Hardware Safety management Control system Scientific productivity

Beamline 8. 3. 1 PRT organization Funding Hardware Safety management Control system Scientific productivity
 monochromator")
X-ray optics Plane Parabolic mirror Scatter guard pinhole Torroidal mirror divergence slits Si(111) monochromator Protein Crystal • 2: 1 demagnification cancels spherical aberrations • comparable flux to a wiggler with < 1% of the heat ADSC Quantum 210 Superbend
 monochromator")
X-ray optics Plane Parabolic mirror Scatter guard pinhole Torroidal mirror divergence slits Si(111) monochromator Protein Crystal • 2: 1 demagnification cancels spherical aberrations • comparable flux to a wiggler with < 1% of the heat ADSC Quantum 210 Superbend

Beamline 8. 3. 1 PRT organization Funding Hardware Safety management Control system Scientific productivity

Beamline 8. 3. 1 PRT organization Funding Hardware Safety management Control system Scientific productivity

Safety Management • • Hardware safety systems Training Safety through simplicity Failsafe envelope • Examples: – Liquid nitrogen – better tools – Automatic retraction – eliminate confusion – Automatic backup – eliminate distraction
 Personnel Protection System (PSS) Equipment Protection System (EPS)")
Safety Envelope Radiation Safety System (RSS) Personnel Protection System (PSS) Equipment Protection System (EPS) 8. 3. 1 Training GERT Training experiment
 Personnel Protection System (PSS) Equipment Protection System (EPS)")
Safety Envelope Radiation Safety System (RSS) Personnel Protection System (PSS) Equipment Protection System (EPS) 8. 3. 1 Training GERT Training experiment

Safety Envelope “There is no safety system that can stop a determined user with a hacksaw” -Anonymous Solution: Create tools that enhance productivity within the safety envelope

Example 1: Liquid nitrogen

Liquid nitrogen safety concern

A safer way

Safer and more productive!

Example 2: Automatic detector retraction ADSC Quantu

ADSC Quantu

Detector retraction ADSC Quantu

Detector retraction
")
Automatic detector retraction • Detector motors are disabled with hutch door open (pinch hazard) • Sample is difficult to access with detector in data collection position • Common mistake: – forget to retract detector before opening door • Result: confusion • Solution: – Door will not open with detector forward – Detector automatically retracts on door open attempt
 1. 8")
Distraction is unsafe! Median time to lift foot off accelerator (secs. ) 1. 8 1. 6 Distraction Condition 1. 4 1. 2 No-Distraction Condition 1. 0 0. 8 2 4 6 8 Distance from the lead vehicle (secs. ) Drivers following a car that suddenly brakes take longer to respond to that event when they are distracted by trying to solve a logic problem. This is especially true if the two vehicles start out close together--when it is critical that the driver in the following vehicle make a rapid response to avoid a rear-end collision. March 2003 MOTOROLA and the Stylized M Logo are registered in the US Patent & Trademark Office. All other product or service names are the property of their respective owners. © Motorola, Inc. 2002.

Automated firewire drive backup

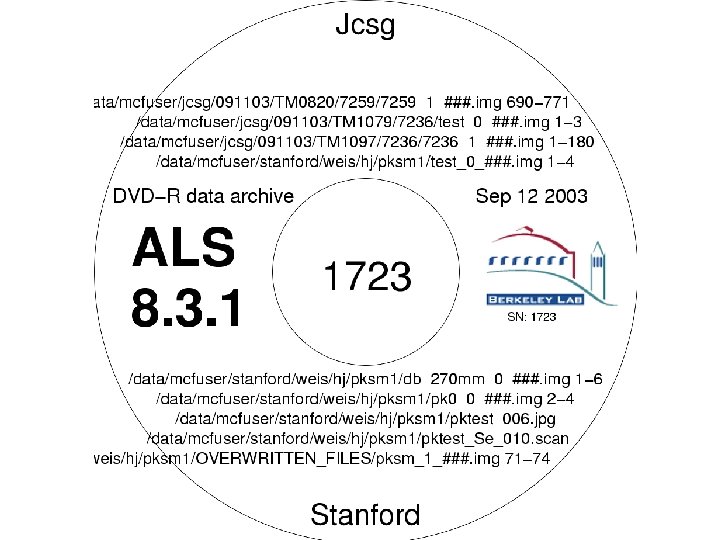
Automated DVD archive

Safety Summary • Encourage safe practices by making them the best way to get results • Measures are in addition to existing ALS safety envelope • Better science and better safety can go hand in hand

Beamline 8. 3. 1 PRT organization Funding Hardware Safety management Control system Scientific productivity

Beamline 8. 3. 1 PRT organization Funding Hardware Safety management Control system Scientific productivity

Software BLU-ICE 3. 0 control system Elves integrated with BLU-ICE ALS-wide beamline health monitor
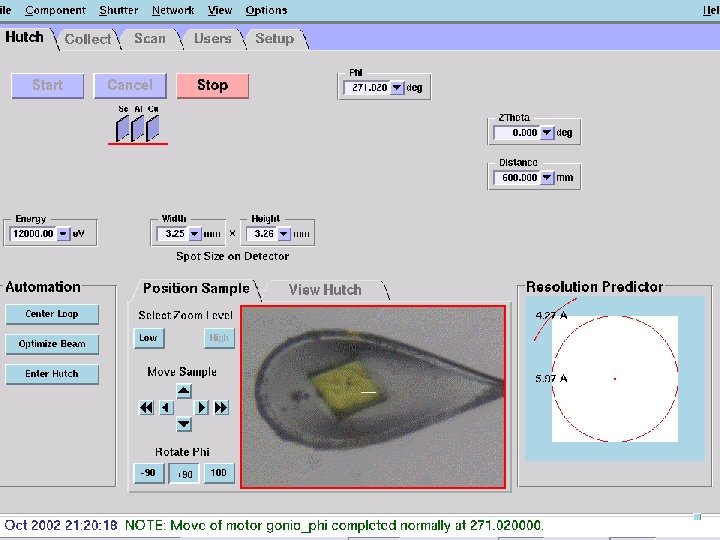
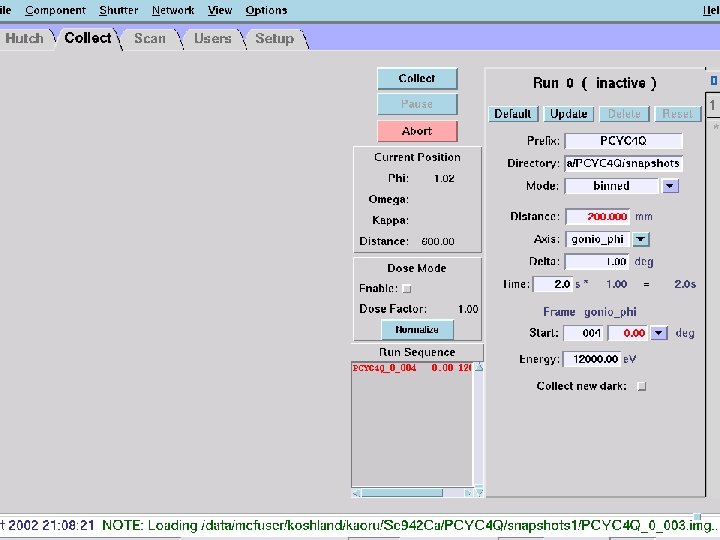

Touch screen

Integration of Elves with BLU-ICE Elves structure solution index e r ost m n tio ma Wedger Elves mosflm autoindex strategy ge a t im cen ru r info n data collection

Integration of Elves with BLU-ICE Elves structure solution mosflm scala solve ARP/w. ARP process run information pick un-busy cluster node data collection

Elven Automation Apr 6 – 24 at ALS 8. 3. 1 27, 686 148 31 56 5 KDa – 23 MDa 0. 94 – 32 Å images collected datasets (15 MAD) investigators unique cells asymmetric unit resolution (3. 2 Å)

Elven Automation Apr 6 – 24 at ALS 8. 3. 1 148 117 ~3. 5 (0. 1 -75) 31 ~61 (0 -231) 2 / 15 datasets succeded hours failed hours MAD structures

ALS beamline health monitor

ALS l. N 2 health monitor

Beamline 8. 3. 1 PRT organization Funding Hardware Safety management Control system Scientific productivity

Beamline 8. 3. 1 PRT organization Funding Hardware Safety management Control system Scientific productivity
 Science 305 1587 -94.")
Amt. B ammonia channel Khademi et. al. (2004) Science 305 1587 -94.
 Science 310 827 -34")
The E. coli ribosome Schuwirth et. al. (2005) Science 310 827 -34
 Nat Struct Mol Biol 13, 676")
Dna. A origin-recognition protein Erzberger et. al. (2006) Nat Struct Mol Biol 13, 676 -83
 Cell 114, 135")
E. coli rho Skordalakes and Berger (2003) Cell 114, 135
 Science 312 741 -4")
multidrug transporter Emr. D Yin et. al. (2006) Science 312 741 -4
")
How many are we solving? Jiang & R. M. Sweet (2004)

Operational Efficiency “representative” 8. 3. 1 user Seconds Description 104490 Assigned and available Percent 91% 42093 Shutter open 40% 52684 Collecting (3026 images) 50% 51806 Something else 50%

Turning data into models 8. 3. 1 in 2003 Number Description 446028 Images (~7 TB) 2346 Data sets 449 MAD/SAD (1: 2) 48 Published Percent 33% 47% 19% 2%

Why do structures fail? Overlaps Signal to noise Radiation Damage

Why do structures fail? Overlaps Signal to noise Radiation Damage

Elven Automation Apr 6 – 24 at ALS 8. 3. 1 148 117 ~3. 5 (0. 1 -75) 31 ~61 (0 -231) 2 / 15 datasets succeded hours failed hours MAD structures

avoiding overlaps c c

Why do structures fail? Overlaps Signal to noise Radiation Damage

Why do structures fail? Overlaps Signal to noise Radiation Damage

Elven Automation Apr 6 – 24 at ALS 8. 3. 1 148 117 ~3. 5 (0. 1 -75) 31 ~61 (0 -231) 2 / 15 datasets succeded hours failed hours MAD structures

MAD phasing simulation Correlation coefficient to correct model mlphare results Anomalous signal to noise ratio
")
Minimum required signal (MAD/SAD)

Why do structures fail? Overlaps Signal to noise Radiation Damage

Why do structures fail? Overlaps Signal to noise Radiation Damage

Radiation Damage thaw

Lattice damage

Distention of cryo with dose before beam

Distention of cryo with dose after beam

Specific Damage

Specific Damage

Correlation coefficient to observed data Individual atoms decay at different rates 0 12 24 36 dose (MGy) 48 60

fluorescence probe for damage 1. 0 Wide range of decay rates seen 0. 6 Half-dose = 41. 7 ± 4 MGy “GCN 4” in crystal 0. 2 0. 4 Protection factor: 660% ± 94% 0. 0 Fraction unconverted 0. 8 Half-dose = 5. 5 ± 0. 6 MGy 8 m. M Se. Met in Na. OH 0 50 100 Absorbed Dose (MGy) 150 200

How to improve productivity • Nocturnal automation • Offline experimental design • Understand radiation damage

Interleaved Scheduling experiment queue Minor 30 s Choe 120 s Alberta 60 s Choe 30 s Minor 30 s beamline

cool hand luke

“infinite capacity” sample carousel

6 -foot conveyor
65335cd1a76998e1e1fe240759394985.ppt