b3f07a5efddc2d45db72740831cfeb7e.ppt
- Количество слайдов: 45


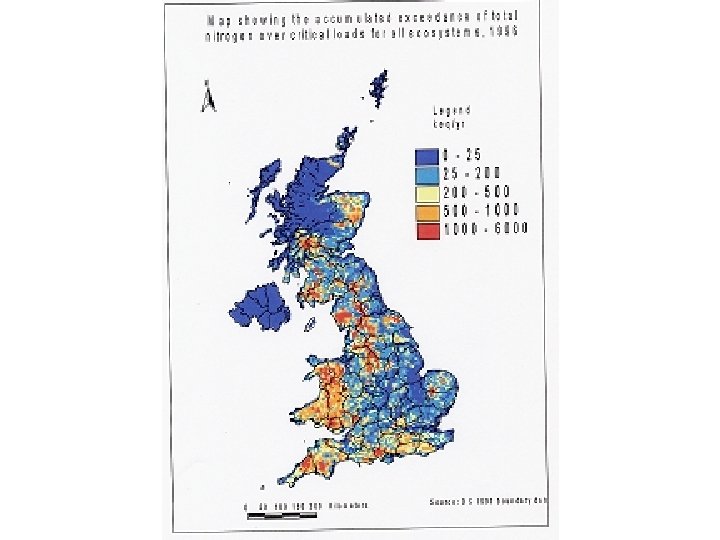
Background 1 • Critical levels of acidification and nutrient. N are still exceeded in many parts of Europe • reductions in SO 2 and NOx emissions have been achieved • by 2010 NH 3 is likely to be the largest contributor to acidifying and gaseous N emissions

Background 2 • The UNECE resolved to apply a multieffect multi-pollutant approach to prevent or minimise exceedance of critical loads or levels • measures to reduce NH 3 emissions are required under the 1999 protocol to the Convention on Long-Range Transboundary Air Pollution to abate Acidification, Eutrophication and ground-level O 3

Background 3 • Conscious of the need for a cost-effective regional approach to combatting air pollution that takes account of the variation in effects and abatement costs between countries

Background 4 • Measures taken to reduce emissions of NOX and NHX should not, so far as possible, increase other emissions of reactive-N, including N 2 O

Protocol requirements 1 • Countries have been given an emissions ceiling – from 4% reduction (France) – to 43% (Netherlands) • with a 15% overall reduction for Europe • and are required to apply, as a minimum the following control measures

Protocol requirements 2 • To provide information to the general public • make widely available information on NH 3 abatement, including information on Good Agricultural Practice (GAP) • encourage research into improvements to NH 3 databases • improve NH 3 monitoring techniques • quantify efficacy of NH 3 control techniques for farms and their impacts on deposition

Where does it come from? UK kg x 106

Agricultural sources kg x 106

% Emissions at stages of manure management

TAN flow

Implications for abatement • NH 3 lost ‘upstream’, e. g. buildings and stores may be lost ‘downstream’ e. g. spreading, if no further measures taken. • surface phenomenon – greatest emissions when SA/vol ratio large – buildings, spreading, less from stores – emissions largely cease when absorbed by soil

Strategy 1 • Reduce emissions at final stage of manure management – Losses during spreading minimal • 1% of total • specific measures • immobilize in litter • rank according to cost-effectiveness
, nitrous oxide (N 2 O)")
Strategy 2 • Different strategy to nitrate (NO 3), nitrous oxide (N 2 O) • surface phenomenon • reducing excess has limited effect • need specific measures to reduce NH 3

Code of good agricultural practice- 6 sections • • • N management feeding strategies spreading storage housing N fertilizers

N management - balanced N application • NH 3 emissions arise before applied N enters pool of plant-available N • balancing N inputs to crop needs has much less potl to reduce NH 3 emissions than NO 3 • specific abatement measures are needed to give large reductions in NH 3 emissions • adopting such measures will conserve N for crop uptake

Livestock feeding strategies • Ensure livestock not fed more protein than required • reduces N excretion and hence NH 3 emissions • protein surplus largely excreted as urea or uric acid • hence reducing protein input gives disproportionate decrease in NH 3 losses

Spreading Categories • 1 - Well researched, practical, quantitative data on their abatement efficiency • 2 - promising, but research inadequate, or difficult to quantify efficiency. They may be used as part of an abatement strategy • 3 - ineffective or are likely to be excluded on practical grounds

Band spreading - Slurry applied in narrow bands by trailing hoses Trailing Shoe - Sward is parted by the shoe and slurry applied to the soil Shallow injection - Slurry is placed in shallow (50 -60 mm) open slots

Injection • Deep injection inserts slurry beneath the surface – up to 95% reduction in emissions • problems with – stones – damage to grass swards • slot injection, more applicable, less damage – less effective, 60 - 70%
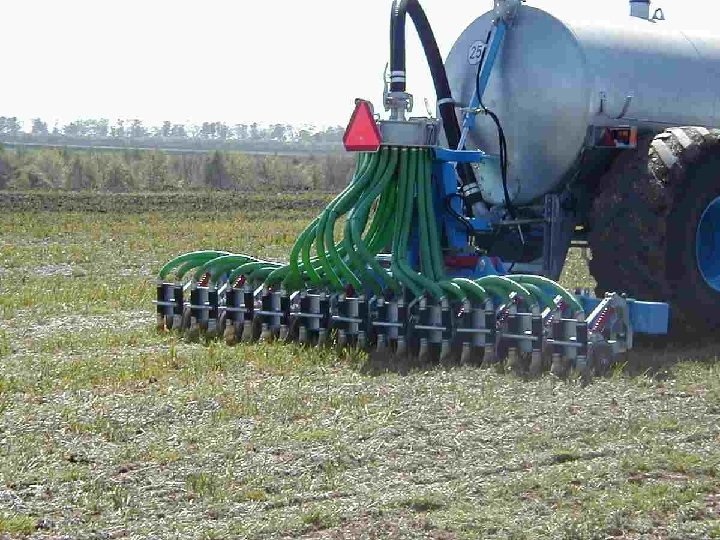

Band spreaders • Reducing surface area reduces emissions – % losses less from large applicaton rates • trailing shoe, mainly grassland – 40 -70% reduction • trailing hose, 10 -50%


Field-scale studies • Few studies using more than 1 technique – Malgeryd 1998, BS, TS, Sh. I – Mattila 1998, BS, I – Mulder and Huijsmans 1994, BS, TS, Sl. I/I – Misselbrook and Smith 2000, BS, TS, Sl. I

Field-scale 2 • Some single comparisons have also been made – Pain and Misselbrook 1997, I – Sommer et al 1997, TH – Ferm et al 1999, TH – Bless et al 1991, TH

Overall averages

Category 1 - spreading

Category 2 - spreading • dilution of slurry – increased storage capacity – increased risk of run-off • mechanical separation of slurry – emissions from solid fraction • apply water after spreading

Category 3 - spreading • Acidifying slurry to p. H 4 -5 – hazard of handling strong acids – Increased N 2 O emissions • additives e. g. salts of Ca, Mg, Al – quantities required too large

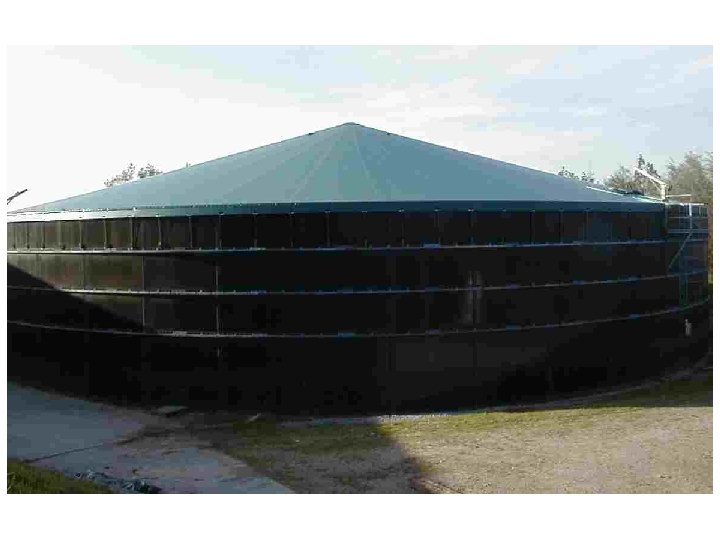
Storage techniques

Ammonia emissions from cattle

Extending the grazing season • In principle large potential benefit • Practice, not so clear – only part of day – do emissions continue from house? • May make a small contribution

Good housekeeping • Spreading in evening • Keeping yards clean • Frequent scraping of cubicles

Encourage FYM storage • ‘fresh’ FYM 25% TAN, stored FYM 10% • Where does the TAN go during storage? – Not much NH 3 – N 2 O – N 2 – Leaching – immobilization – ? ? ?

Cost-curve output

Cost-curve dairy
 – but expensive •")
Feeding strategies • Very effective for pigs (synthetic amino acids) – but expensive • Less effective for poultry – and costs exceed profit margin • Complex for ruminants – all grass – mixed forages
")
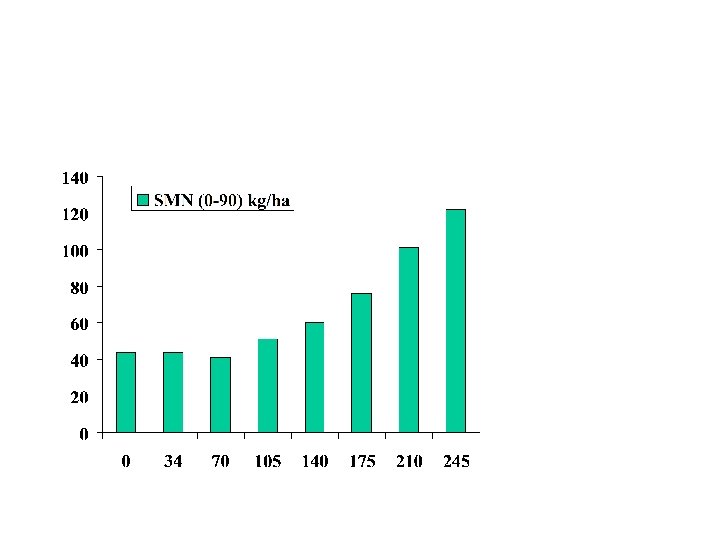
Effect of fertilizer-N on autumn SMN (from Sylvester-Bradley & Chambers)

Background 1 • Critical levels of acidification and nutrient. N are still exceeded in many parts of Europe • measures to reduce NH 3 emissions are required under the protocol to the 1979 Convention on Long-Range Transboundary Air Pollution to abate Acidification, Eutrophication and ground-level O 3

Background 2 • The UNECE resolved to apply a multieffect multi-pollutant approach to prevent or minimise exceedance of critical loads or levels • conscious of the need for a cost-effective regional approach to combatting air pollution that takes account of the variation in effects and abatement costs between countries
b3f07a5efddc2d45db72740831cfeb7e.ppt