

980ad6114b43f065db69b56e8332ce9e.ppt
- Количество слайдов: 21
 Automated Demand Response Project History and Future Directions Presentation to the California Maritime Academy Mary Ann Piette Lawrence Berkeley National Laboratory Sponsored by CEC, PG&E, DOE, and SDG&E May 2, 2007 drrc. lbl. gov
 Presentation Overview • • DR Research Center Executive Summary on Automated Demand Response Key Results, Participants and Strategies for DR Evaluation Methods and Technology Economics 2007 Auto. DR Utility Program Plans Future Directions
 DR Research Center Objective to develop, prioritize, conduct, and disseminate multi-institutional research to facilitate DR Scope technologies, policies, programs, strategies and practices, emphasizing a market connection Method Partners Planning Committee, Annual R&D Plan q State Policy Makers q Researchers Stakeholders q q q Information and Metering System Developers q Aggregators q Program Implementers q q q Utilities Industry Trade Associations Building Owners / Operators Building Equipment Manufacturers End-Use customers
 Current /Recent Projects • Strategic and Policy Research • • • Rate Design for Capturing Energy Efficiency and Demand Response DR Value Research DR Systems Integration • Auto. DR • Demand Response Automation Server (DRAS) • Statewide IOU/ISO Automated Demand Response Collaboration • • Buildings • • • Behavior and DR for residential and small commercial customers Wireless Demand Response Controller for HVAC Demand Response Strategy Assessment Tools Demand Shifting with Thermal Mass Advanced Demand Response Lighting Residential Thermostats Industrial, Agriculture and Water • • Commercial and Industrial Submetering for Demand Response Monitoring DR Economic Tools
 Auto. DR Project Background • Goals • • • Develop a low-cost, fully automated infrastructure to improve DR capability in California Evaluate “readiness” of (commercial) buildings and industrial facilities to receive common signals Evaluate capability of control shed strategies and measurement of sheds to improve future buildings
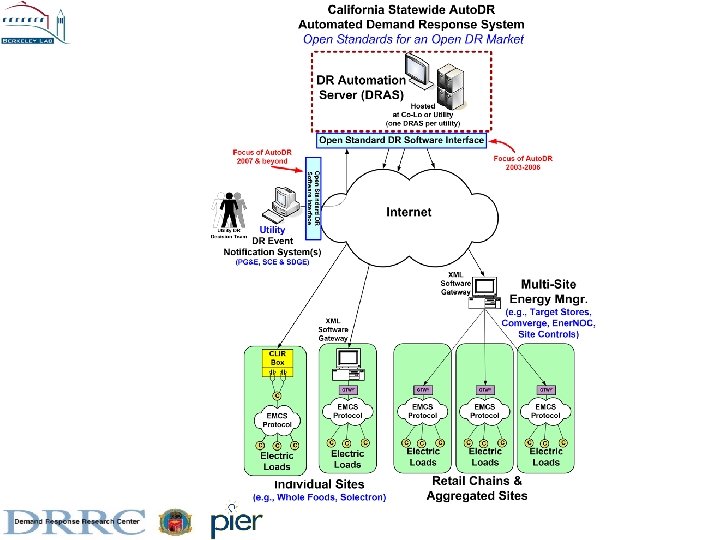
 Auto. DR Executive Summary • Auto. DR Technology Concept – “Open. ADR” • • Demonstrated in 40 buildings over 4 -year period, under commercialization by all three IOUs for 2007 • • High reliability for Auto-CPP, continued through 2006 heat wave Average peak reductions of 10 to 15% (3 to 6 hour events) Greater potential for shorter events Challenges with CPP Economics • • Open, two-way, interoperable industry standard for automating DR Repeatable, reliable, secure, low-cost economic or reliability DR Internet based real-time link to energy management systems Low bill savings (less than 1%, avg 3 cents/ft 2) Technical Potential • • ~1 GW 5 GW - Economic Demand Response - Reliability Demand Response
 Auto. DR Background and Definition Goals • • • Develop low-cost, fully automated infrastructure to improve DR capability Evaluate “readiness” of (commercial) buildings to receive common signals Evaluate capability of control shed strategies Definition • • Automated Demand Response can be defined as fully automated DR initiated by a signal from a utility or other appropriate entity to provide full automated connectivity to customer enduse control strategies. Signaling – The Auto. DR technology should provide continuous, secure, reliable, two-way communication with end-use customers to allow sites to be identified as listening and acknowledging receipt of signals. Industry Standards - Automated DR consists of open, interoperable industry standard control and communications technologies designed to integrate with both common energy management systems and other end-use devices that can receive a dry contact relay or similar signals (such as internet based XML). Timing of Notification - Day ahead and day of signals are provided by Auto. DR technologies to facilitate a diverse set of end-use strategies such as pre-cooling for "day ahead“ notification, or near real-time communications to automation "day of" control strategies. Timing of DR automation server (DRAS) communications must consider day ahead events that include weekends and holidays.
 Sample Results from 2006 130, 000 ft 2 County Office
 Aggregated Results – June 26, Avg Max Temp 88 F, Zone 2 OAT and CPP Baselines show different results 1. 3 MW reduction during high price period
 Wide variety of building types") 2006 Auto-CPP Participants (n=24) Wide variety of building types
2006 Auto-CPP Participants (n=24) Wide variety of building types
 Auto-CPP Control Strategies Global temperature reset migrating to Title 24 code
 Evaluation Methodology • Two baselines evaluated • • • Outside Air Temperature Regression - Based on morning load (k. W), outside air temperature, and 10 previous weekdays plus morning adjustment CPP - on morning load (k. W), outside air temperature, and 10 previous weekdays Individual, site specific daily and group aggregated impact • Post-event survey of “acceptability and problems” • Technology and communications performance • Customer bill impact
 Variation of Results and Comparison with CPP Baseline Key Finding - CPP about 1/3 of OAT Baseline • 350 • 300 • Average of site 6 hr. average savings Baseline: 949 k. W (11%) • CPP Baseline: 367 k. W (6%) • OAT • 200 • 150 • 100 • 50 Hayward • Target 357 • Gilead Rocklin 342 • Gilead EPalo. Alto 300 savings with OAT Baseline • Oracle • k. W • Gilead • Echelon • MDF Douglas savings with CPP baseline • IKEA • k. W • 50 Arnold • 2530 • Chabot • B • -50 of A • 0 • ACWD • Average demand savings for 6 hrs. (k. W) • 250
 CPP Economics 11 or 13 saved $ under CPP
 Auto. DR Technical Potential • Total Commercial Space • • • 4, 920, 000 kft 2 (5 Billion) Commercial Area 1/3 rd have Energy Management Systems Avg reduction over 40 sites – 0. 5 W/ft 2 Technical Potential: 0. 8 GW Value $40/k. W $33, 000 • Higher value for reliability, environmental externalities, energy savings spill over
 2007 Auto. DR PG&E Program § § Follows plan outlined by PG&E in 8/30/06 letter to CPUC (pp 27 -29) and CPUC decision 11/30/06 Program Developed with Global Energy Partners (GEP) § Program implementation expenditure of $2 million (derived from existing PG&E TA/TI funds) § Peak demand reduction of 15 MW § Commercialization of Auto. DR program delivery § DR program focus for 2007 includes Critical Peak Pricing (CPP) and Demand Bidding (DBP), with other reliability programs assessed for future years
 SDG&E and SCE Auto. DR San Diego Gas and Electric Co. • Under Emerging Technologies LBNL/DRRC demonstration with retail chains • Offering Auto. DR programs under DR programs • • Goals still under development In discussion with Akuacom to host DRAS internally Southern California Edison • Prime contract with GEP moving forward • • Sub to LBNL, Akua and C&C Controls 10 to 20 sites for 2007 -2008 • All previous DR audit sites • Currently there are 200 • Assessment of CPP economics underway • No recruiting bonus or direct payment to sites • Therefore customer economic motivation limited
 Linking DR and Energy Efficiency q Ideal start - good commissioning, retro-commissioning, advanced/new controls q q q HVAC - Direct digital control (DDC) global temperature adjustment • In process for Title 24 2008 • Closed loop Lighting Continuum - Zone Switching, Fixture Switching, Lamp Switching, Stepped Dimming, Continuous Dimming Maybe you “can” use a strategy every day?
 • Deployment • • Future Directions Pursue Open. ADR as standard for all DR programs Collaborate with ISO to implement the ISO-Utility link Educate controls vendors Research • • • Pursue full RTP design Embed in controls – consider for Title 24 2011 Pursue small buildings and larger industrial sites Improve building technologies, e. g. , dimming systems Improve tools to estimate k. W savings Improve economic feedback