

c54d27f5c0496b5b87a83a6133e6c22b.ppt
- Количество слайдов: 29
 Assessment of Class S 4 Streams in the Central Interior to Evaluate Riparian Practices Implemented under the Forest Practices Code Peter J. Tschaplinski Research Branch Ministry of Forests
 Why did we do the survey? • Concerns of DFO and MELP that logging around S 4 streams was damaging habitat • Assess the effectiveness of the FP Code in maintaining S 4 stream channels and fish habitats
 Frequency of different streamside practices 2) Do practices meet objectives of the") Objectives 1) Frequency of different streamside practices 2) Do practices meet objectives of the RMA Guidebook 3) Do practices result in impacts to fish habitat
Objectives 1) Frequency of different streamside practices 2) Do practices meet objectives of the RMA Guidebook 3) Do practices result in impacts to fish habitat
 Who did the study? 1. Interagency Technical Team: 11 persons – MOF, MELP, DFO, COFI, ILMA – project Terms of Reference, design, methods 2. Consulting Firm: Pre-survey SP Review 3. Field Crew: 16 – Tech Team (8) + MOF (3), MELP (2), DFO (3) regional staff + field HQ co-ordinator 4. MOF Region (2) and District (6) contacts
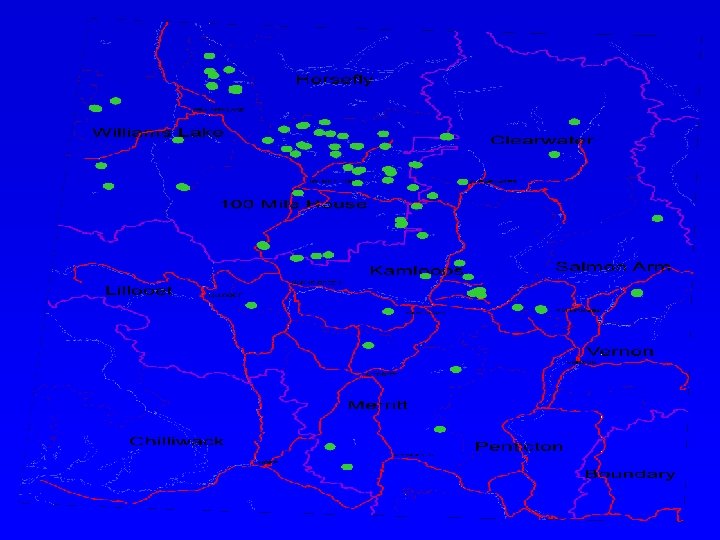
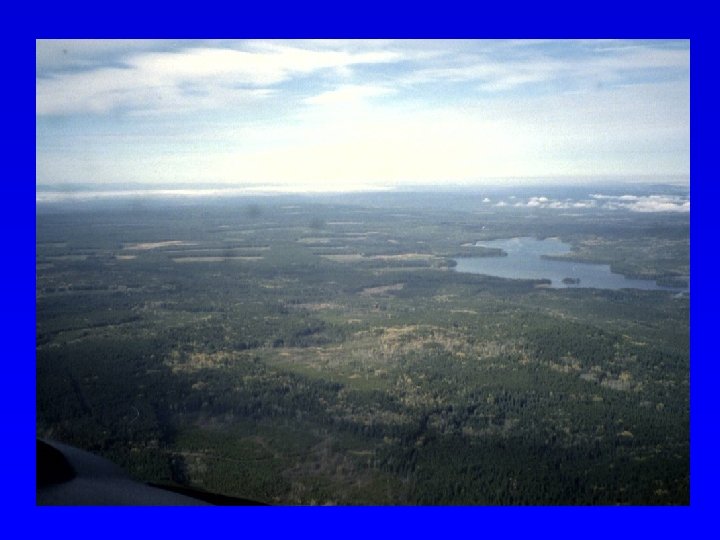
 Study Area • Central Interior Plateau • Districts: – Kamloops – Clearwater – Salmon Arm – Merritt – Williams Lake – 100 Mile House
 full-Code SPs to identify target cutblocks") Study Scope and Sequence • Examine ALL (2989) full-Code SPs to identify target cutblocks – harvested in 1997 or 1998 – 47, 800 ha • Identify cutblocks with a classified S 4 fishbearing stream • Visit and evaluate all 72 logged S 4 streams
Study Scope and Sequence • Examine ALL (2989) full-Code SPs to identify target cutblocks – harvested in 1997 or 1998 – 47, 800 ha • Identify cutblocks with a classified S 4 fishbearing stream • Visit and evaluate all 72 logged S 4 streams
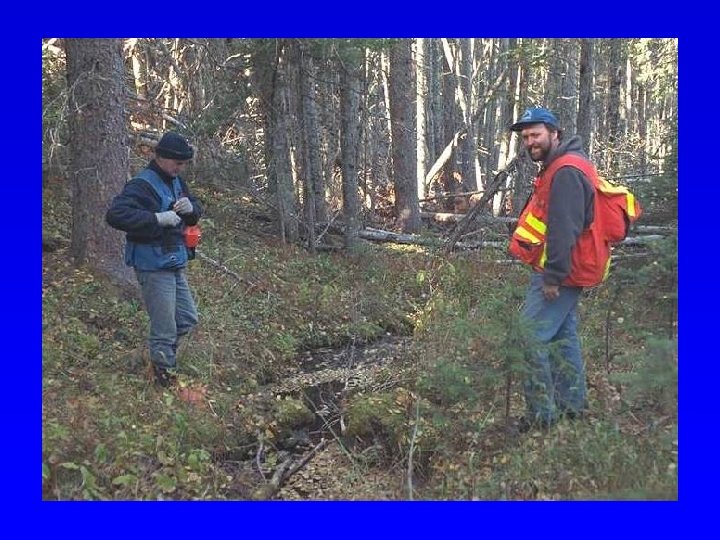
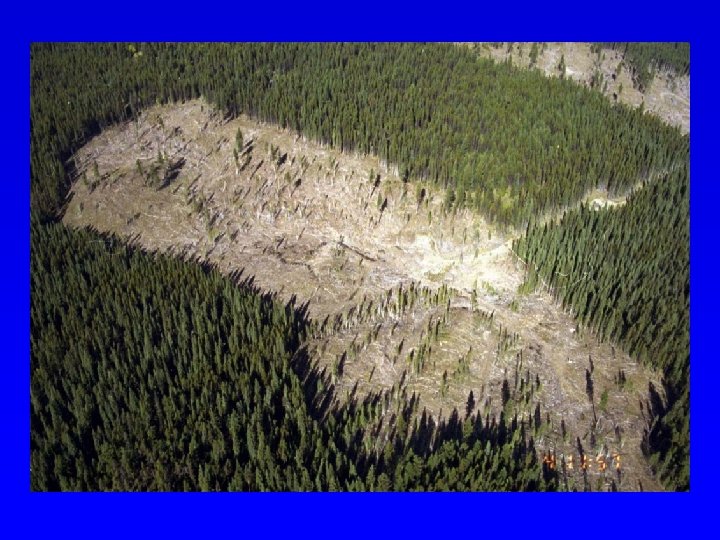
 Field Assessments • RMA treatment & tree retention levels • Types & cause of disturbances within 100 -m sections
") Field Assessments • m altered / 100 m = Channel Impact Value (CIV)
Field Assessments • m altered / 100 m = Channel Impact Value (CIV)
 Field Assessments • Logging slash in channel
 Field Assessments • Windthrow frequency and impact
 • Streambank sediments exposed by windthrow
 Field Assessments • Sediment sources and severity rank
 • Shade loss (ranked L/M/H)") • Harvest of streambank trees (count/100 m) • Shade loss (ranked L/M/H)
• Harvest of streambank trees (count/100 m) • Shade loss (ranked L/M/H)
 Study Phases and Timelines 1. Technical Team • Develop Terms of Reference • Visit field sites (coast) to define problem • March to August 2000 – 5 months – 8 versions
 2. Develop and Test Field Sampling Methods • July - August 2000 • Field tested on Vancouver Island • Finalized after 4 versions – consensus on observations & interpretations
 3. Review SPs and Identify Sites • Mid-August to early October • Consulting firm plus district staff • Identify: – cutblocks – S 4 streams – riparian treatments
 4. Field Surveys • 2 - 13 October 2000 • Set up field HQ – logistics, communications • 2 survey teams, 4 persons each • 2 helicopters
 5. Analysis and Reporting • Data analysis and first draft: Oct - Dec • Initial extension: Dec - Jan • Iterative revisions & reviews: Dec - June • Report release: July 2001 • TOTAL TIME: 15 MONTHS
 6. Costs • • Total: $200, 000 + Development/field tests: $15, 000 Field Equipment: $3, 000 SP Analysis: $18, 000 Helicopters: $70, 000 Other field logistics: $35, 000 Post-survey & report: $10, 000 Staff & in-kind support: $48, 000
 Project Strengths 1. Full participation and ‘buy-in’ by all parties 2. Specific Terms of Reference: - defined study scope and methods - ensure consistent observations, measurements, interpretations
 Project Strengths 3. Comprehensive coverage of cutblocks & streams 4. Full participation of Technical Team in report content
 Project Weaknesses 1. Prolonged process of TOR development: – high degree of sensitivity among parties – industry and district staff felt their performance was under audit – turnover in Tech Team membership affected continuity
 Project Weaknesses 2. Insufficient liaison with districts: – needed dedicated staff for communications – district staff and operators felt alienated from the process
 Project Weaknesses 3. Observations were limited in scope: – short-term “snapshot” of impacts/effectiveness – long-term impacts not directly assessed (e. g. , LWD longevity, supply) – obvious measures of physical alterations – no direct measures of change to biological communities and processes
 Project Weaknesses – several physical processes not assessed directly e. g. , riparian canopy removal vs. stream temperature – conclusions limited to the geographic region covered