48140870ecced33597caada87a01fd32.ppt
- Количество слайдов: 33
 ASKALON A Tool Set for Cluster and Grid Computing Cracow’ 03 Grid Workshop, Oct. 2003 T. Fahringer, A. Hofer, A. Jugravu, S. Pllana, R. Prodan, C. Seragiotto, J. Testori, H. -L. Truong, A. Villazon, M. Welzl Institute for Computer Science University of Innsbruck Thomas. Fahringer@uibk. univie. ac. at informatik. uibk. ac. at/dps A Special Research Program funded by ASF Automatic Performance Analysis: Real Tools
 Outline • ASKALON: Overview • Performance Analysis and the Grid • Automatic Experiment Management • Java. Symphony: A New Programming Method for the Grid • Summary 2
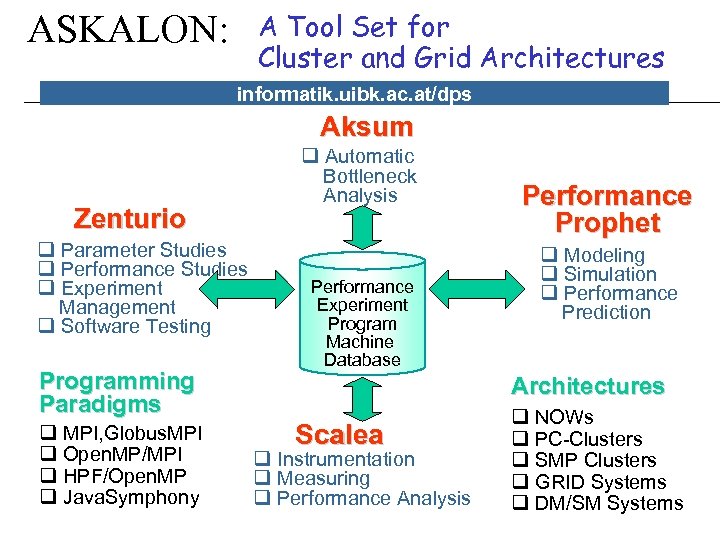 A Tool Set for Cluster and Grid Architectures ASKALON: informatik. uibk. ac. at/dps Aksum Zenturio q Parameter Studies q Performance Studies q Experiment Management q Software Testing Programming Paradigms q MPI, Globus. MPI q Open. MP/MPI q HPF/Open. MP q Java. Symphony q Automatic Bottleneck Analysis Performance Experiment Program Machine Database Performance Prophet q Modeling q Simulation q Performance Prediction Architectures Scalea q Instrumentation q Measuring q Performance Analysis q NOWs q PC-Clusters q SMP Clusters q GRID Systems q DM/SM Systems
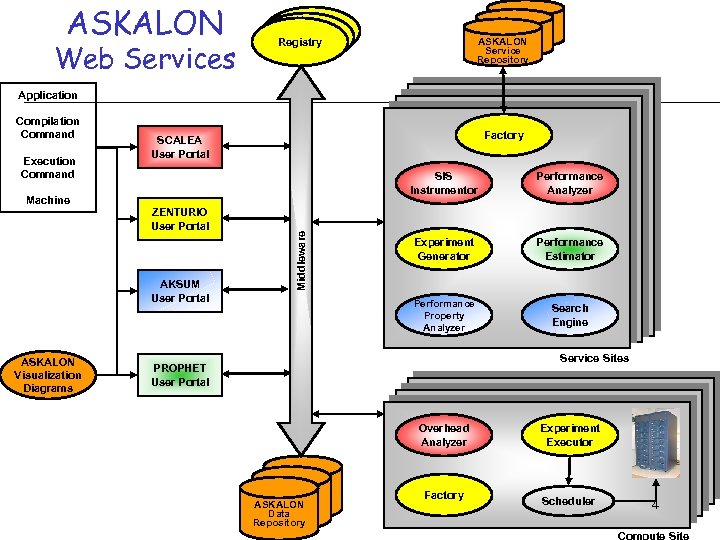 ASKALON Web Services ASKALON Service Repository Registry Application Execution Command Machine SIS Instrumentor ZENTURIO User Portal AKSUM User Portal ASKALON Visualization Diagrams Factory SCALEA User Portal Performance Analyzer Experiment Generator Performance Estimator Performance Property Analyzer Middleware Compilation Command Search Engine Service Sites PROPHET User Portal Overhead Analyzer ASKALON Data Repository Factory Experiment Executor Scheduler 4 Compute Site
 Performance Analysis for the Grid so far mostly low level analysis – monitoring, instrumentation, analysis for the Grid infrastructure • but not for applications – lots of low level performance data and visualization • lack of high-level summary information – difficult to associate data with specific middleware components and applications 5
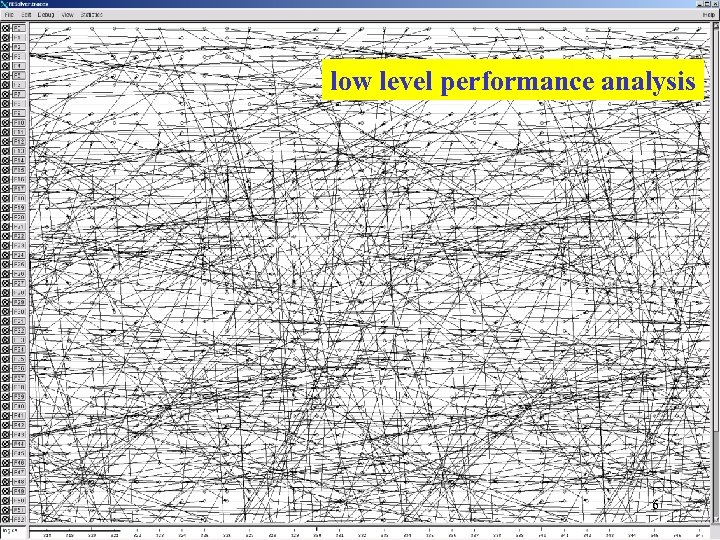 low level performance analysis 6
 Performance Analysis for the Grid next steps – higher level analysis • performance analysis for the Grid and its applications (single-entry single exit regions) • summaries instead of details • problems and interpretation instead of raw data – combined Grid performance analysis for (SCALEA, • network AKSUM) • site • application – customizable tools instead of hard-coded analysis – multi-experiment instead of single-experiment analysis 9 – online and scalable performance analysis
 Aksum A Tool for Semi-Automatic Multi-Experiment Performance Analysis • user-provided problem and machine sizes • automated instrumentation, experiment management, performance interpretation, and search for performance bottlenecks • performance analysis for single-entry single-exit regions • performance problems related to the program • targets Open. MP/MPI, and mixed programs • customizable (build your own performance tool) – API for performance overheads – define performance problems and code regions of interest – influence the search (strategy, time, code regions) 11
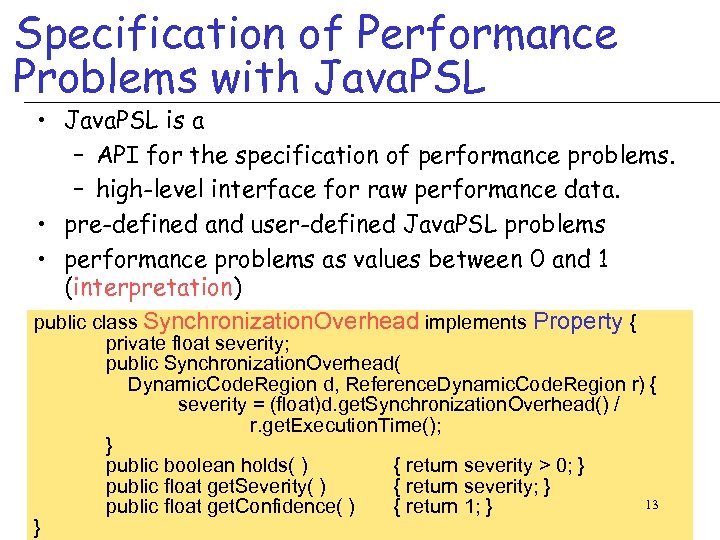 Specification of Performance Problems with Java. PSL • Java. PSL is a – API for the specification of performance problems. – high-level interface for raw performance data. • pre-defined and user-defined Java. PSL problems • performance problems as values between 0 and 1 (interpretation) public class Synchronization. Overhead implements Property { } private float severity; public Synchronization. Overhead( Dynamic. Code. Region d, Reference. Dynamic. Code. Region r) { severity = (float)d. get. Synchronization. Overhead() / r. get. Execution. Time(); } public boolean holds( ) { return severity > 0; } public float get. Severity( ) { return severity; } 13 public float get. Confidence( ) { return 1; }
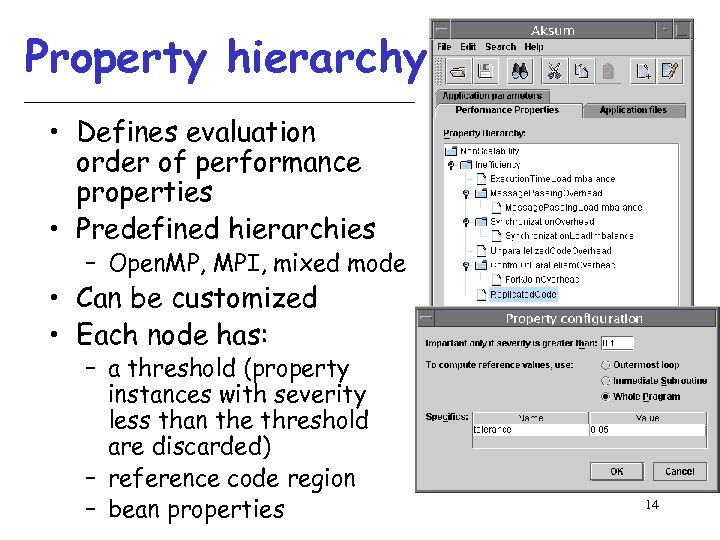 Property hierarchy • Defines evaluation order of performance properties • Predefined hierarchies – Open. MP, MPI, mixed mode • Can be customized • Each node has: – a threshold (property instances with severity less than the threshold are discarded) – reference code region – bean properties 14
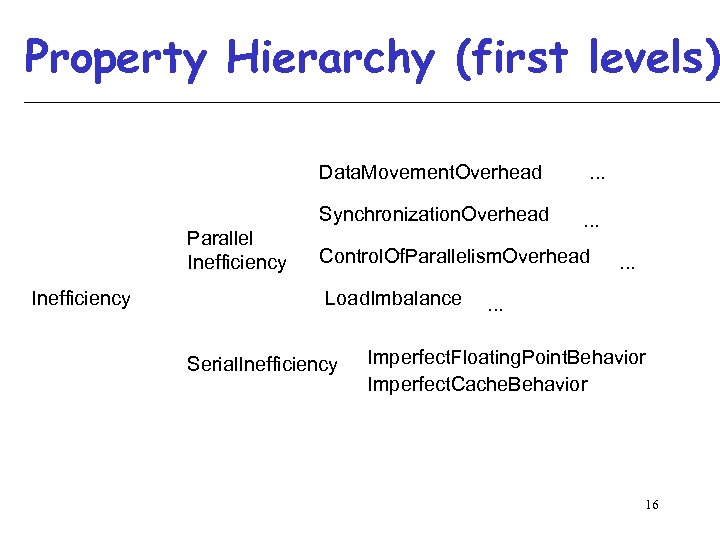 Property Hierarchy (first levels) Data. Movement. Overhead Synchronization. Overhead Parallel Inefficiency . . . Control. Of. Parallelism. Overhead Load. Imbalance Serial. Inefficiency . . . Imperfect. Floating. Point. Behavior Imperfect. Cache. Behavior 16
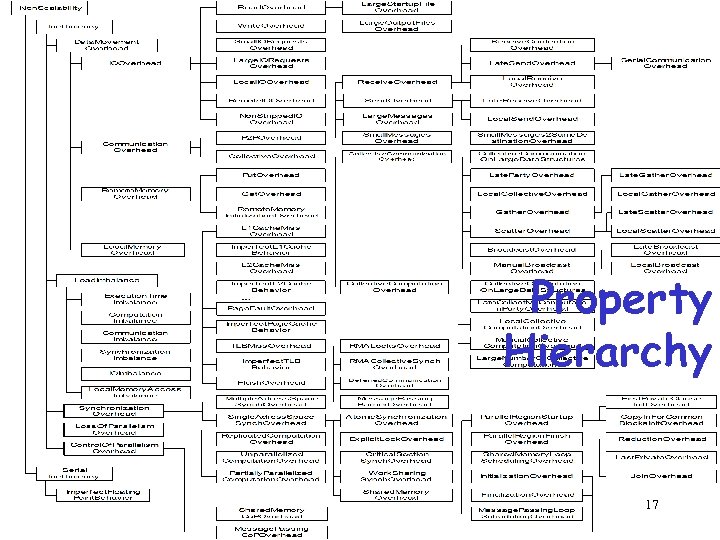 Property Hierarchy 17
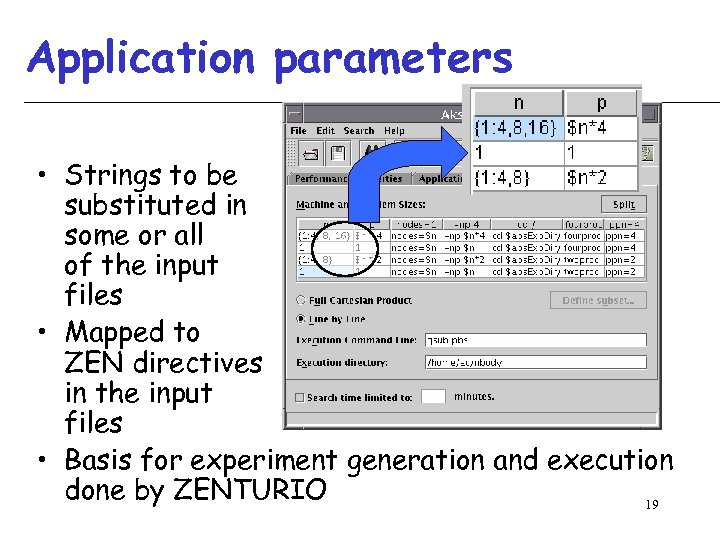 Application parameters • Strings to be substituted in some or all of the input files • Mapped to ZEN directives in the input files • Basis for experiment generation and execution done by ZENTURIO 19
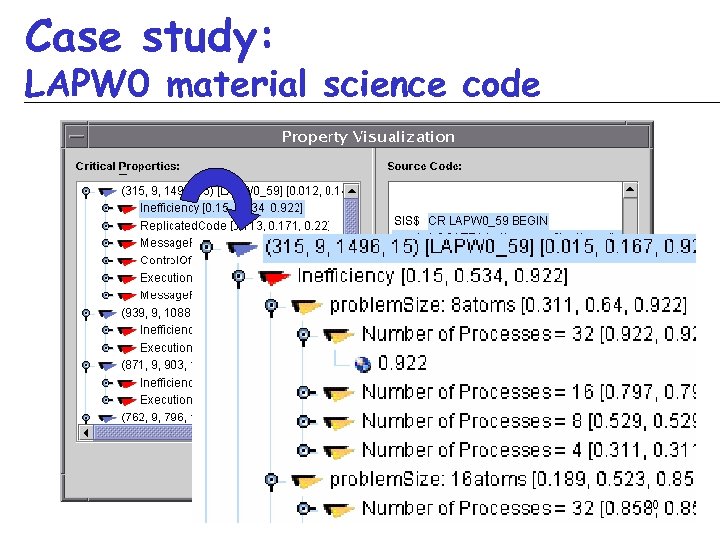 Case study: LAPW 0 material science code 20
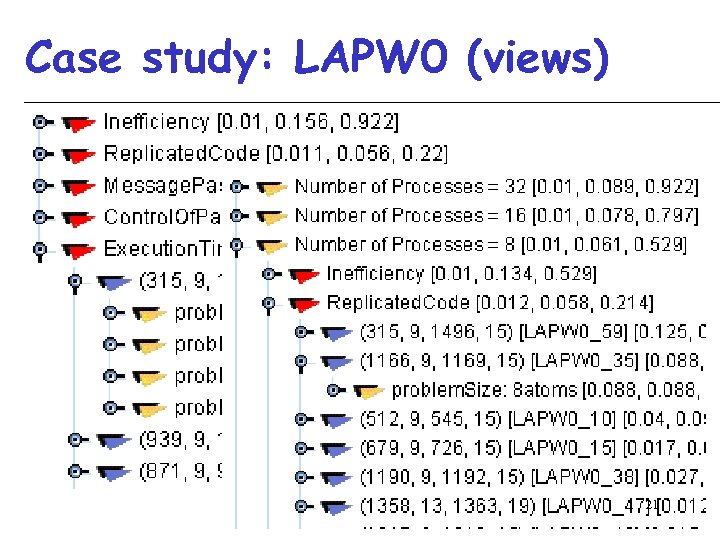 Case study: LAPW 0 (views) 21
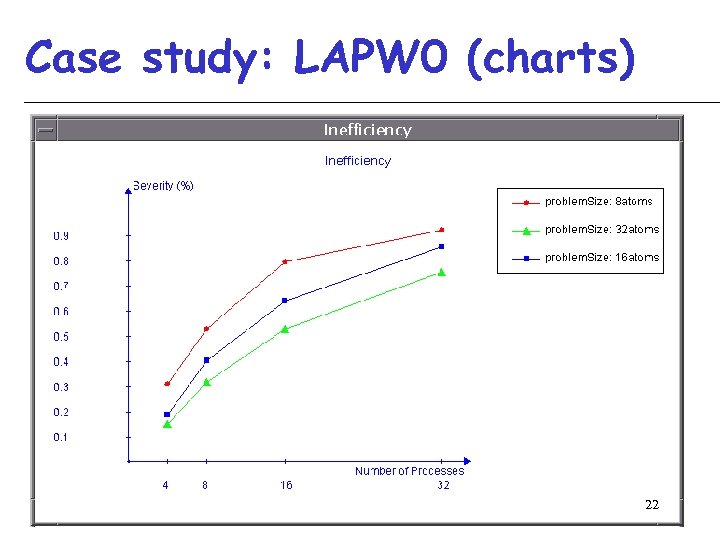 Case study: LAPW 0 (charts) 22
 Outline • Performance Analysis and the Grid • Automatic Experiment Management • Java. Symphony: A New Programming Method for the Grid • Summary 23
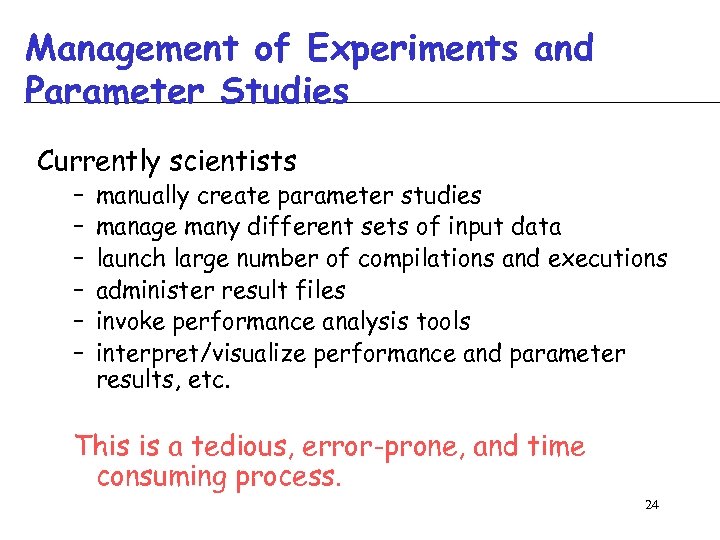 Management of Experiments and Parameter Studies Currently scientists – – – manually create parameter studies manage many different sets of input data launch large number of compilations and executions administer result files invoke performance analysis tools interpret/visualize performance and parameter results, etc. This is a tedious, error-prone, and time consuming process. 24
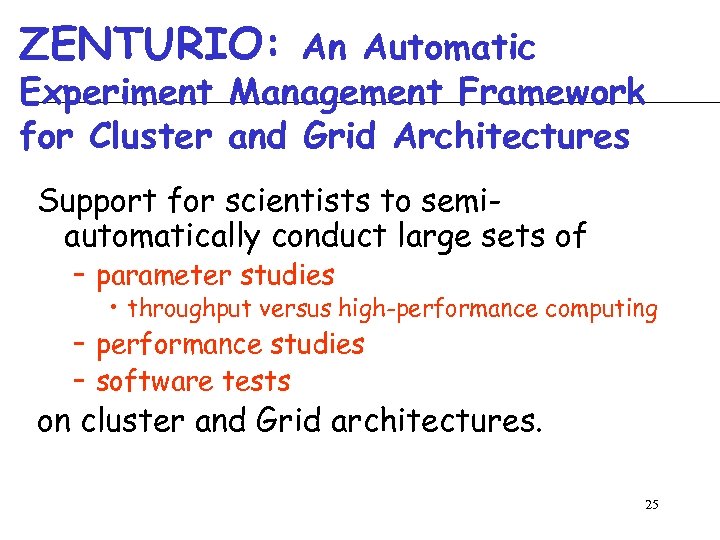 ZENTURIO: An Automatic Experiment Management Framework for Cluster and Grid Architectures Support for scientists to semiautomatically conduct large sets of – parameter studies • throughput versus high-performance computing – performance studies – software tests on cluster and Grid architectures. 25
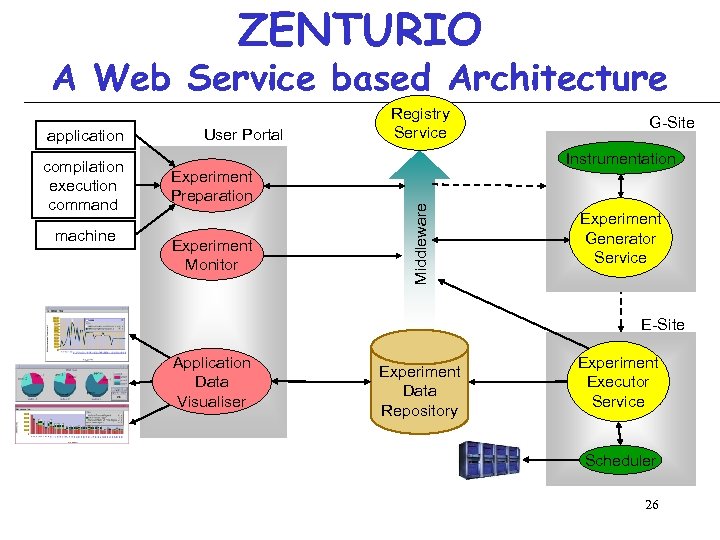 ZENTURIO A Web Service based Architecture compilation execution command machine G-Site Instrumentation Experiment Preparation Experiment Monitor Middleware application User Portal Registry Service Experiment Generator Service E-Site Application Data Visualiser Experiment Data Repository Experiment Executor Service Scheduler 26
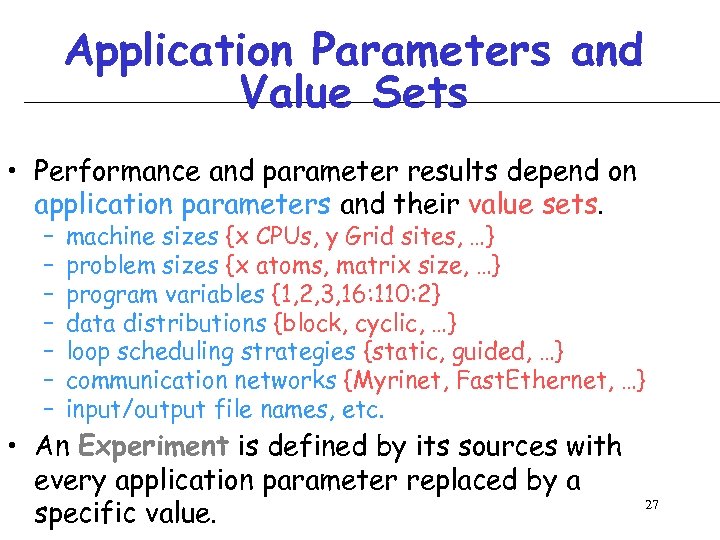 Application Parameters and Value Sets • Performance and parameter results depend on application parameters and their value sets. – – – – machine sizes {x CPUs, y Grid sites, …} problem sizes {x atoms, matrix size, …} program variables {1, 2, 3, 16: 110: 2} data distributions {block, cyclic, …} loop scheduling strategies {static, guided, …} communication networks {Myrinet, Fast. Ethernet, …} input/output file names, etc. • An Experiment is defined by its sources with every application parameter replaced by a specific value. 27
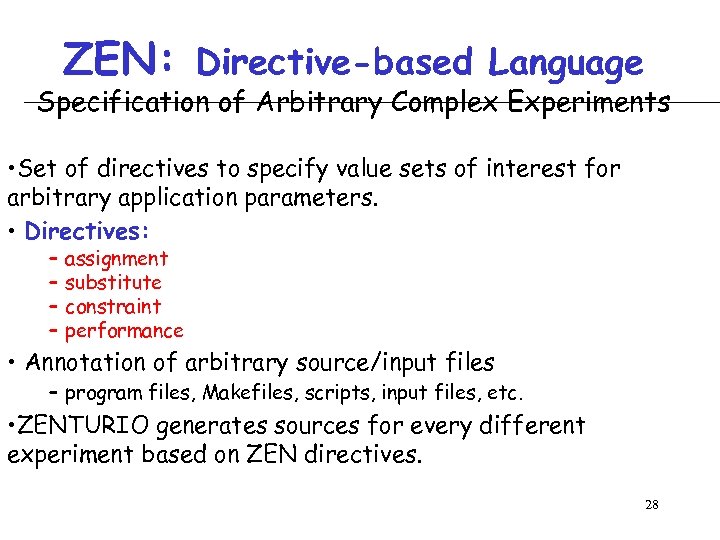 ZEN: Directive-based Language Specification of Arbitrary Complex Experiments • Set of directives to specify value sets of interest for arbitrary application parameters. • Directives: – – assignment substitute constraint performance • Annotation of arbitrary source/input files – program files, Makefiles, scripts, input files, etc. • ZENTURIO generates sources for every different experiment based on ZEN directives. 28
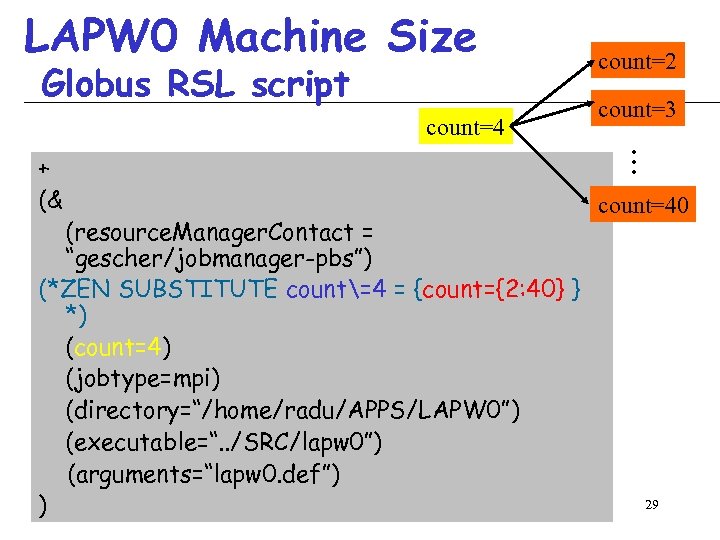 Globus RSL script count=4 + (& (resource. Manager. Contact = “gescher/jobmanager-pbs”) (*ZEN SUBSTITUTE count=4 = {count={2: 40} } *) (count=4) (jobtype=mpi) (directory=“/home/radu/APPS/LAPW 0”) (executable=“. . /SRC/lapw 0”) (arguments=“lapw 0. def”) ) count=2 count=3 . . . LAPW 0 Machine Size count=40 29
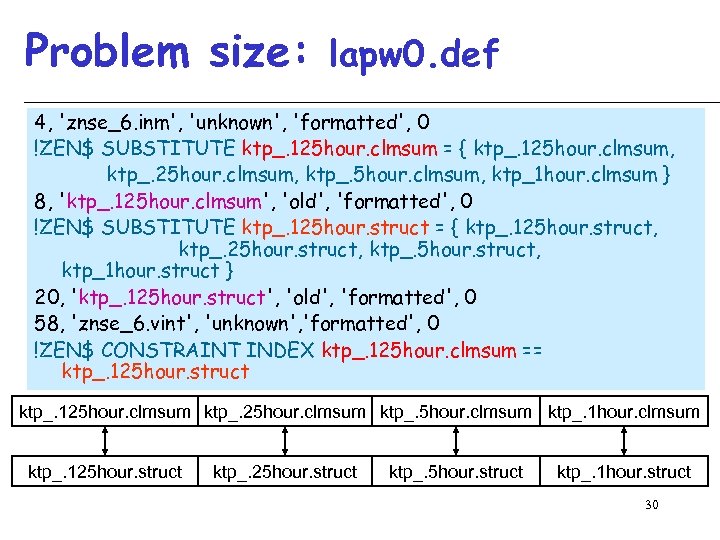 Problem size: lapw 0. def 4, 'znse_6. inm', 'unknown', 'formatted', 0 !ZEN$ SUBSTITUTE ktp_. 125 hour. clmsum = { ktp_. 125 hour. clmsum, ktp_1 hour. clmsum } 8, 'ktp_. 125 hour. clmsum', 'old', 'formatted', 0 !ZEN$ SUBSTITUTE ktp_. 125 hour. struct = { ktp_. 125 hour. struct, ktp_1 hour. struct } 20, 'ktp_. 125 hour. struct', 'old', 'formatted', 0 58, 'znse_6. vint', 'unknown', 'formatted', 0 !ZEN$ CONSTRAINT INDEX ktp_. 125 hour. clmsum == ktp_. 125 hour. struct ktp_. 125 hour. clmsum ktp_. 125 hour. struct ktp_. 1 hour. struct 30
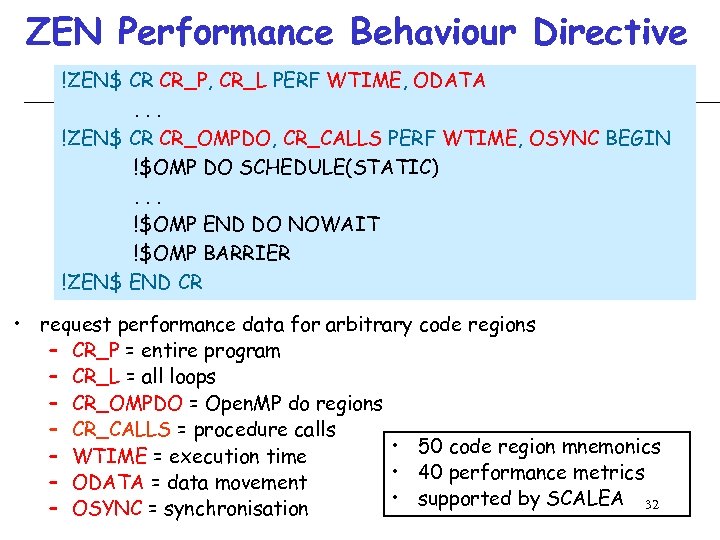 ZEN Performance Behaviour Directive !ZEN$ CR CR_P, CR_L PERF WTIME, ODATA. . . !ZEN$ CR CR_OMPDO, CR_CALLS PERF WTIME, OSYNC BEGIN !$OMP DO SCHEDULE(STATIC). . . !$OMP END DO NOWAIT !$OMP BARRIER !ZEN$ END CR • request performance data for arbitrary code regions – CR_P = entire program – CR_L = all loops – CR_OMPDO = Open. MP do regions – CR_CALLS = procedure calls • 50 code region mnemonics – WTIME = execution time • 40 performance metrics – ODATA = data movement • supported by SCALEA 32 – OSYNC = synchronisation
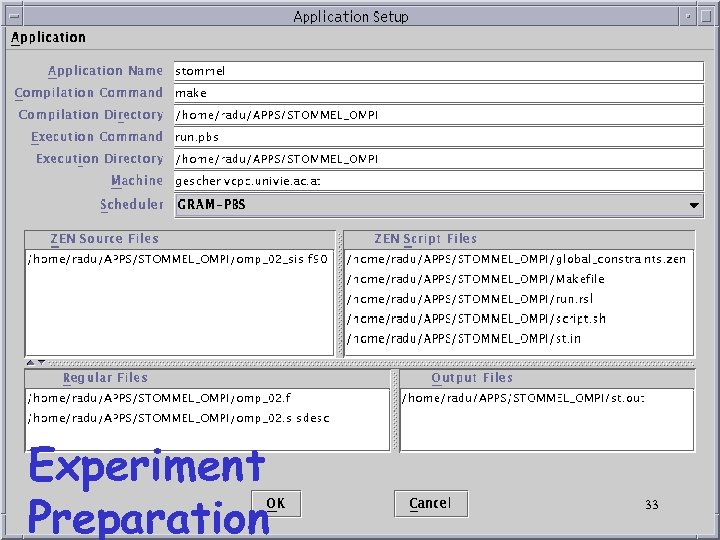 Experiment Preparation 33
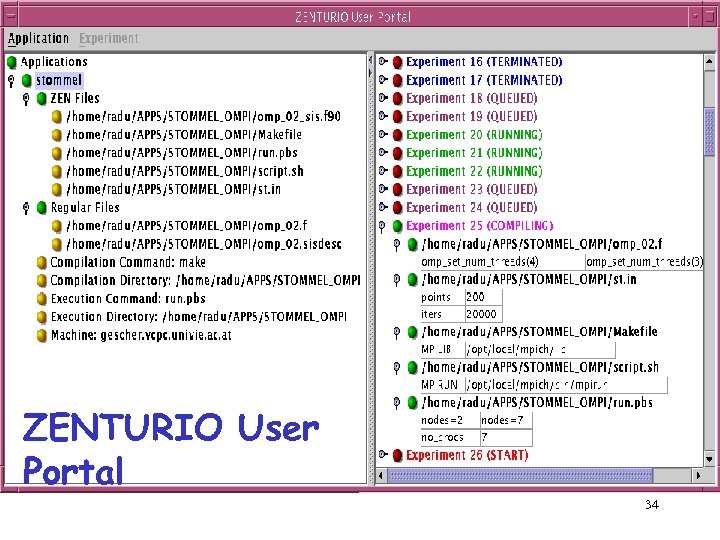 ZENTURIO User Portal 34
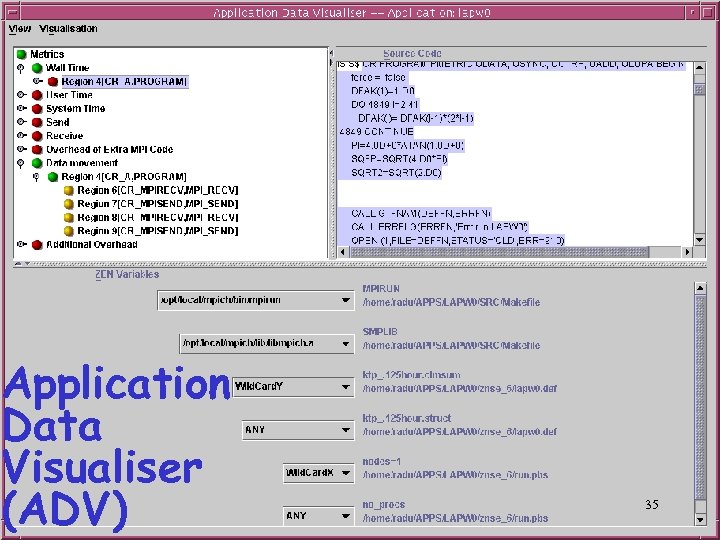 Application Data Visualiser (ADV) 35
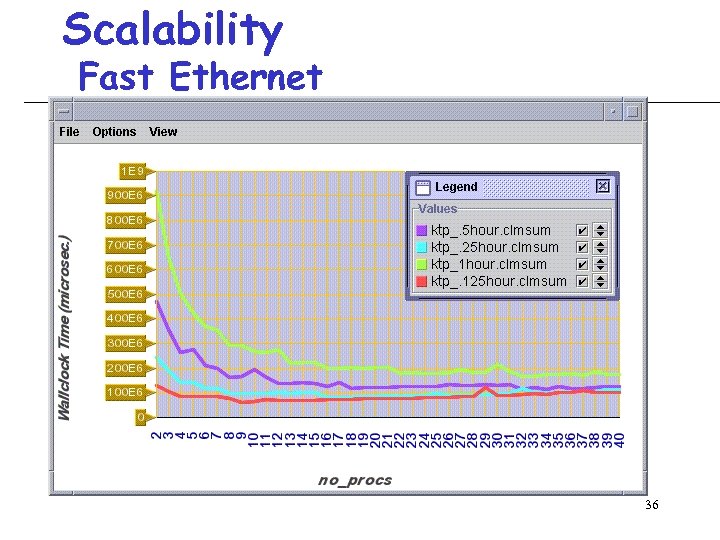 Scalability Fast Ethernet 36
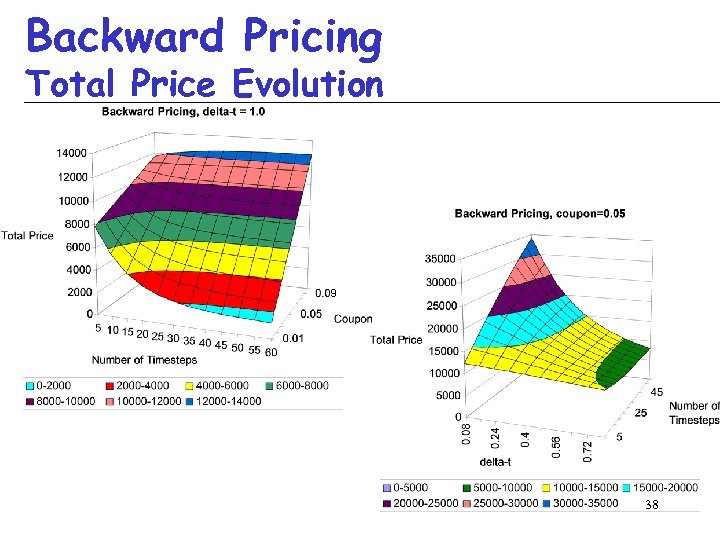 Backward Pricing Total Price Evolution 38
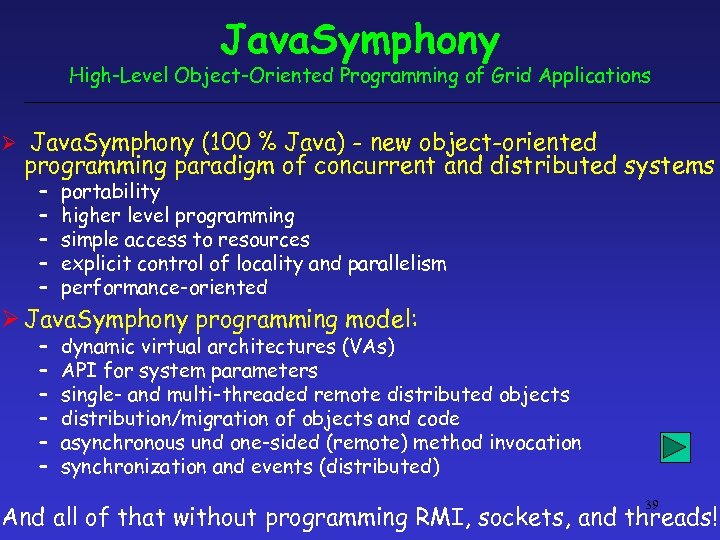 Java. Symphony High-Level Object-Oriented Programming of Grid Applications Ø Java. Symphony (100 % Java) - new object-oriented programming paradigm of concurrent and distributed systems – – – portability higher level programming simple access to resources explicit control of locality and parallelism performance-oriented Ø Java. Symphony programming model: – – – dynamic virtual architectures (VAs) API for system parameters single- and multi-threaded remote distributed objects distribution/migration of objects and code asynchronous und one-sided (remote) method invocation synchronization and events (distributed) 39 And all of that without programming RMI, sockets, and threads!
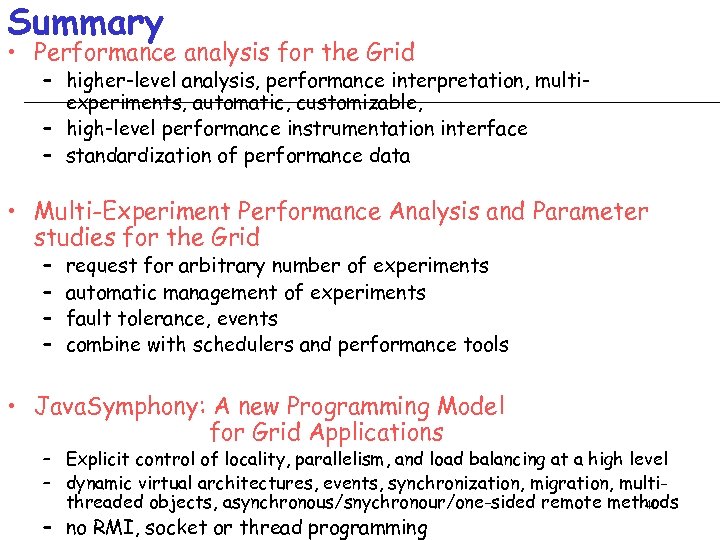 Summary • Performance analysis for the Grid – higher-level analysis, performance interpretation, multiexperiments, automatic, customizable, – high-level performance instrumentation interface – standardization of performance data • Multi-Experiment Performance Analysis and Parameter studies for the Grid – – request for arbitrary number of experiments automatic management of experiments fault tolerance, events combine with schedulers and performance tools • Java. Symphony: A new Programming Model for Grid Applications – Explicit control of locality, parallelism, and load balancing at a high level – dynamic virtual architectures, events, synchronization, migration, multithreaded objects, asynchronous/snychronour/one-sided remote methods 40 – no RMI, socket or thread programming
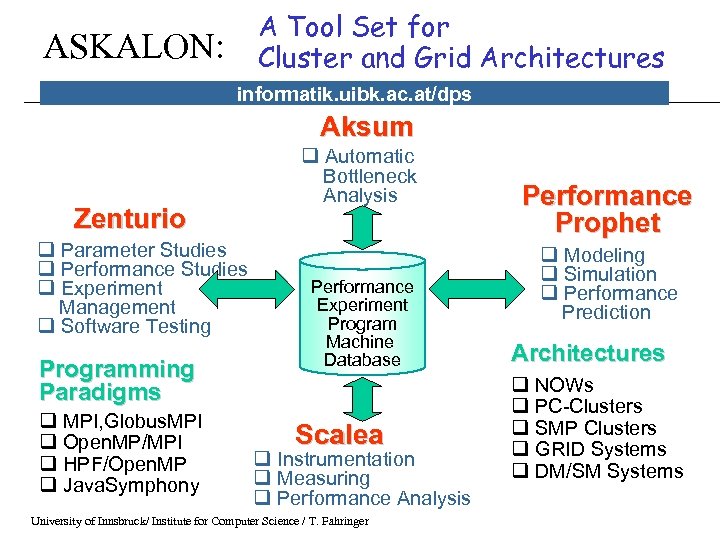 A Tool Set for Cluster and Grid Architectures ASKALON: informatik. uibk. ac. at/dps Aksum Zenturio q Parameter Studies q Performance Studies q Experiment Management q Software Testing Programming Paradigms q MPI, Globus. MPI q Open. MP/MPI q HPF/Open. MP q Java. Symphony q Automatic Bottleneck Analysis Performance Experiment Program Machine Database Scalea q Instrumentation q Measuring q Performance Analysis University of Innsbruck/ Institute for Computer Science / T. Fahringer Performance Prophet q Modeling q Simulation q Performance Prediction Architectures q NOWs q PC-Clusters q SMP Clusters q GRID Systems q DM/SM Systems


