cf64e11e76c54172fe772dfded2d6b9a.ppt
- Количество слайдов: 20
Architectural Complexity: Opening the Black Box Methods for Exposing Internal Functionality of Complex Single and Multiple Processor Systems 1 EECC-756
Modern Design Trends l Larger on-chip caches l Extended levels of cache l System-on-a-chip integration l Overall increasing design complexity All lead to more complex debugging of designs 2
The Good News l Automated design tools are minimizing design errors l IP reuse minimizes bugs l Simulation tools discover most logic errors before fabrication l Massive test suites allow comprehensive testing l So what happened to Intel with FPU flaw? 3

Past Methods for Debugging l Signal probing l Bus monitoring l Software debugging 4
Past Methods for Debugging (cont’d) l Signal probing – More internal logic per pin = less info on pin – Pin inaccessibility due to modern packages (i. e. sockets, BGAs) l Bus monitoring – Caches hide data accesses l Software debugging – Impractical for real-time applications – Little or no hardware support in the past 5
Solutions l Test Access Port (TAP) – Uses JTAG IEEE 1149. 1 specification for boundary scan l Probe Mode – Allows step by step analysis of code impact on internal registers l In-circuit Emulation (ICE) – Allows execution tracing – Real-time applicability 6
Test Access Port (TAP) l Implementation of boundary scan JTAG IEEE 1149. 1 specification l Allows access to all internal flip-flops in boundary scan chain l Numerous chains serve different functions (i. e. IO flip-flops) l Allows non-destructive snapshot of internal state at any point in time 7
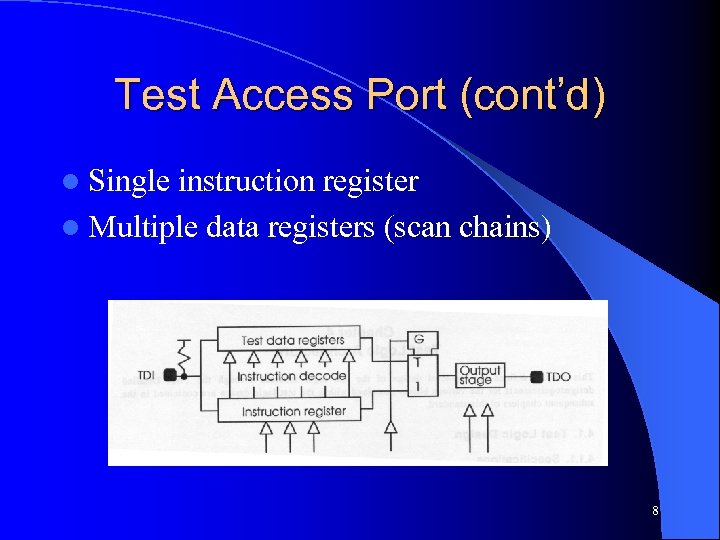
Test Access Port (cont’d) l Single instruction register l Multiple data registers (scan chains) 8
Probe Mode l Special processor mode halts program execution l Uses the TAP interface to receive instructions and output internal data l Allows read/write access to any internal registers l Allows memory accesses to test cache functionality 9
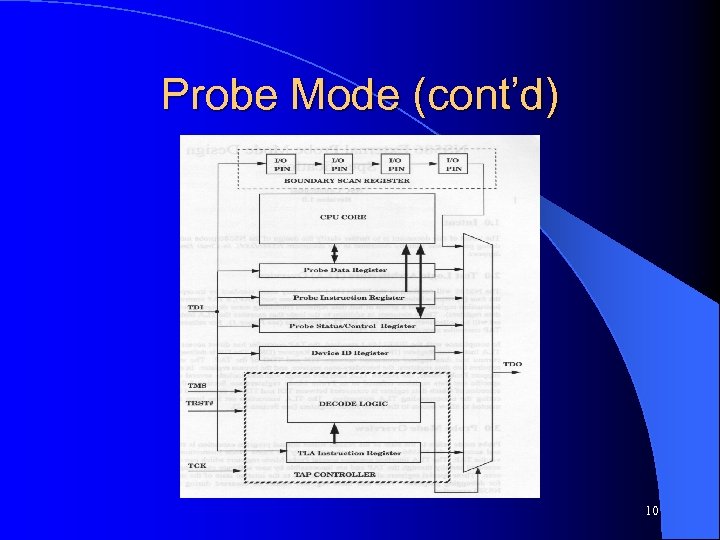
Probe Mode (cont’d) 10
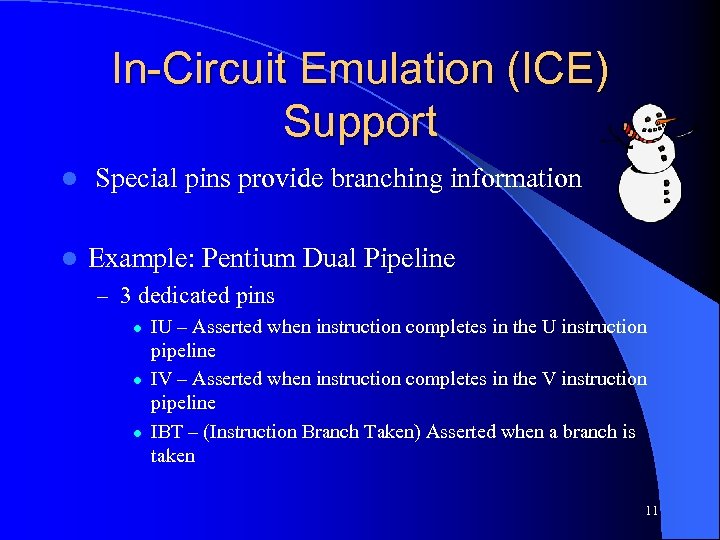
In-Circuit Emulation (ICE) Support l l Special pins provide branching information Example: Pentium Dual Pipeline – 3 dedicated pins l l l IU – Asserted when instruction completes in the U instruction pipeline IV – Asserted when instruction completes in the V instruction pipeline IBT – (Instruction Branch Taken) Asserted when a branch is taken 11
In-Circuit Emulation (cont’d) l Branch signal information provides realtime code tracing l Branch trace message buffers provide further information l Branch trace message buffers in conjunction with Probe Mode allow detailed realtime code tracing 12
Branch Trace Message Buffers l l l FIFO queue Can be read through TAP during program execution Circular mode (trace-back from breakpoint) vs. Jump-to-Probe Mode (maintain instruction stream) Incident counter expands buffer size Intel automatically generates a special BTM cycle on local bus to export BTM info 13
Branch Trace Buffer Logic Implementation 14
Multiprocessor Issues l Three methods for opening the “black box” on a single processor system – TAP (boundary scan) – Probe Mode – Branch Tracing Methods for ICE l Multiple processor system design also has challenges 15
Multiprocessor Challenges l Race conditions due to parallel data accesses l Inconsistent and unpredictable network paths l Differing processor behaviors on heterogeneous networks l Communication patterns that restrict performance or scalability 16

Multiprocessor Solutions : Debugging Code l Create sequential version of code l Execute parallel tasks on a single computer as separate processes l Visualization tools that create space-time diagrams or animations to show 2 dimensional changes of state l Unified Trace Environment (IBM) 17
Multiprocessor Solutions : Debugging Designs l Ability to monitor communication packets circumvents most visibility problems – Debug messages can be included in packet l Network protocol simulations – Protocol verification programs l (i. e. petri-nets) – Network communication pattern simulators l However . . . 18
Multiprocessor Design Trends l Currently, uniprocessor designs are hitting roadblocks – large dies impractical signal transit time – routing increases exponentially with die size l One possible solution : multiple processors on a single die re-emergence of visibility problems 19
Conclusion l Several methods available for internal execution tracing of uniprocessors – Test Access Port (JTAG IEEE 1149. 1) – Probe Mode extension – Branch Tracing l Don’t count out TAP, Probe Mode, and ICE for multiprocessors 20
cf64e11e76c54172fe772dfded2d6b9a.ppt