2eafe8c0b088cfdf736d10da487468d0.ppt
- Количество слайдов: 52


Applied Bovine Genomics – “Delivering on the Promise” Ronnie D. Green National Program Leader Food Animal Production USDA / ARS

From gene to genome • Gene – The functional and physical unit of heredity passed from parent to offspring • Genome – The DNA comprising the complete genetic complement of an organism • Genomics – 1986 -- a new scientific discipline of mapping, sequencing, and analyzing genomes
 Ø")
A Mammalian Genome Ø 3 billion base pairs (A, G, C, and T) Ø Every cell has two copies (alleles) of each chromosome Ø Estimated 30, 000 to 40, 000 genes (two copies or alleles of each gene) Ø Maybe 400, 000 proteins produced
 First goal 300 markers Today > 21, 000 markers")
Snelling et al. (2006) First goal 300 markers Today > 21, 000 markers

GENOME SCAN RESULTS IN ALL RESOURCE FAMILIES BM BTA 1 BTA 2 BTA 3 MSTN RPYD FATYD BTA 6 BWT, W 365, HCW, LMA BTA 4 BTA 5 WBS 14 MARB, RPYD MARB BTA 8 Blackie Bonzo PA RPYD, FATYD MARB, RPYD Fat yield HCW, WBS 3 HCW, ADG BTA 15 BTA 27 FAT, YG, RPYD, WBS 14 RIBBONE, DP, RIBFAT, BWT BTA 29 FAT, MARB FAT WBS 14 MARB Dairy Form WBS 3, WBS 14, Calpain

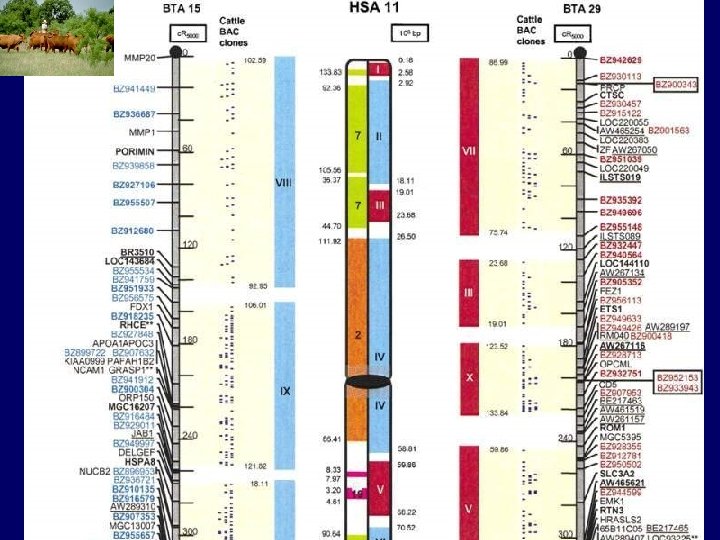
Fine Mapping Ø Use additional DNA markers and animals to refine the location of the QTL to the QTN (gene mutation) Ø Use human and mouse mapping information (Comparative Mapping)

Important genes affecting production traits Ø Leptin - fat deposition / DMI Ø DGAT – milk production Ø BHGR – milk components Ø Thyroglobulin - marbling Ø Calpastatin - tenderness Ø Calpain - tenderness Ø Somatostatin -- marbling

So…What Was Wrong with Our Approach?

Interagency Coordination Essential…. • Interagency Working Group on Domestic Animal Genomics – Executive Office of the President • Office of Science & Technology Policy (OSTP) • National Science & Technology Council (NSTC) • Committee on Science (co-Chairs NIH, NSF, OSTP) • Established in winter 2002 • Charter members – DOE, FDA, NIH, NSF, OMB, OSTP, USDA • Chairperson -- Joseph Jen, USDA/REE Executive Director – Ronnie Green, USDA/ARS

Genomic Sequencing Launch: Dec. 2003 Expected Finish: Spring 2007

International Collaboration – – – – NIH / NHGRI -- $25 M State of Texas – $10 M USDA -- $11 M Australia -- $1 M Genome Canada -- $5 M New Zealand -- $1 M Beef Councils (US, TX, SD) – $0. 82 M Project Total = $53 M

Bovine Genome Sequence – Final Assembly – v. 3. 1 • • • ~7. 2 -X coverage of the genome Total of 27. 9 M sequence reads Avg. trimmed read length - ~700 bp Size of the genome 2. 87 B base pairs N 50 supercontig size - ~1 M bp Used the International Integrated Map to order the assembly (Snelling et al. , 2006) • Released to Gen. Bank and available through BCM web-site at: www. hgsc. bcm. tmc. edu/projects/bovine

Genome Sequence AGCTTTAAGCCATACCTTAG. . . GACATTACCTAGGAGCTTTAAGCCATAC AATGTACACACAC. . . ACGTGCGTCGT AACTGGTCTACAG. . . GTTCAACGTCCTTGAC ATCGTTCAAGTATGCGTAAATCGTTGT. . . ACGTAATAGTACGT GTCGTAACCTGA. . . TCAACTGGTACA GTCGTACATGT. . . TGACGTAACTGA TCAACTGGTACGT. . . ACTTCCAGGAGACCTGTATC GCCACATGTAGCGT. . . TATGCGTATGTGTAAACGTGGGTACTA GTGCAACCACTGTATGCGA. . . AGTTGTGCCACGT AAACTACGTTGTTTACCAG. . . GTGGGACACTAGTGATCG TTAGACGATATCG. . . TATGACACGT

Shotgun Assembly. . . AGCTTTAAGCCATACCTTAGGACATTACCTAGGAGCTTTAAGCCATAC. . . Consensus . . . AGCTTTAAGCCATACCTTAGGACATTACCTAGGAGCTTTAAGCCATAC. . .

Genome Project Objectives • PHASE II – Tools and Annotation – Discovery of new genetic markers • Single-nucleotide polymorphism markers • Single genome in coverage from SNP discovery project – 10, 000 full length c. DNA sequences • Expressed pieces of the genome • Characterize genome structure • 4, 000 completed thus far – 75 Mb finished sequence • NIH Encode project – Ensembl automated annotation

Genetic Markers - Types • Microsatellite – Based on differences in the number of short DNA sequences that are repeated at a specific point in the genome that can be detected using PCR – Also called simple sequence repeat (SSR) markers – Usually not associated with genes. . . CAGTATCACACACACAGTCCTGAT. . . CAGTATCACACACACACACAGTCCTGAT. . . CCGTATCTAGGTAAATGTACAATCTTG. . . CCGTATCTAGGTATATGTACAATCTTG. . . • Single Nucleotide Polymorphisms (SNP) – Based upon simple changes of DNA at a specific point in the genome

Phase II - SNP Project • Expect 3 million SNP in the genome • Light sequencing on each breed completed to discover SNPs • Over 2 M SNP found in the base Hereford sequence Holstein Jersey Angus Limousin Brahman Norwegian Red

SNP Discovery in the Genome Age Dominette. . . AGCTTTAAGCCATACCTTAGGACATTACCTAGGAGCTTTAAGCCATAC. . . Consensus. . . AGCTTTAAGCCATACCTTAGGACATTACCTAGGAGCTTTAAGCCATAC. . . AGCTTTAAGCCATACCTTAGGATATTACCTAGGAGCTTTAAGCCATAC. . . Martha SNP

SNP Discovery: Assembly

Phase II - SNP Project • Current Status of Project: – Genotyping underway on total of 497 animals (19 breeds) for total of 39 K SNP – (Breeds include: • Angus, Hereford, Limousin, Charolais, Red Angus, Piedmontiese, Romagnola, Brahman, Santa Gertrudis, Beefmaster, Nellore, Gir, N’Dama, Sheko, Holstein, Jersey, Brown Swiss, Norwegian Red, Guernsey) Bovine Hap. Map Consortium

Cost effective whole genome SNP genotyping … 100 K SNP for $200? 0. 2 cents per genotype

? ? ? ?

SNP Project Impacts • Enhanced QTL Mapping – Hi density map will radically enhance mapping efforts • Characterization of the Structure of the Genome – Haplotype blocks will advance understanding of how DNA information can be used • Tree of Life – Identify evolutionary relationships among breeds, lines, species, etc. • Reduced set of informative markers – “Whole-GENOME SELECTION”? ?

… to genomic selection. Cost-effective whole genome SNP genotyping + Long-range LD in livestock + Advanced statistical genetics (e. g. Meuwissen & Goddard) Genomic selection Could have major impact in animal and human genetics !

“We don’t need to know what the genes are” Gordon Dickerson, USDA-ARS US MARC (1995) "I don't actually care if it's making a protein or not, the equations are still the same. ” Laurence Hurst, University of Bath (2006)

Haplotype • From “haploid genotype. ” A set of closely linked alleles (genes or DNA polymorphisms) inherited as a unit. Different combinations of polymorphisms are known as haplotypes.

LD Example – BTA 1 MAF > 0. 2 Holstein DGAT 1 TG Limousin

Tag SNP

Genetic Improvement -- SNP Based Whole Genome Selection Unknown genes Molec. genetics Tag. SNP Phenotypic data EPD for unknown polygenes Haplotype BLUP SNP Genotypes (E)PD for identified Haplotypes “Genome Enhanced” Selection criterion

Block Haplotype 1 2 3 4 Animal 1 Animal 2 A +0. 01 +0. 06 B +1. 03 -0. 74 C -1. 23 +0. 98 11 0. 01 +0. 01 22 0. 06 +0. 06 12 1. 03 -0. 74 11 1. 03 +1. 03 22 0. 98 +0. 98 D +6. 35 +2. 19 +0. 05 -8. 59 13 6. 35 +0. 05 24 2. 19 -8. 59 “GE” PBV 8. 67 -2. 26

BFGL and AIPL -- BARC
 Assay Illumina Bead Array Matrix (96")
The Illumina Golden. Gate™ Single Nucleotide Polymorphism (SNP) Assay Illumina Bead Array Matrix (96 fiber optic cables with 50, 000 fibers each) Using fluorescent dyes, 1536 different SNPs are assayed on the ends of each of 50, 000 strands of 96 fiber optic cables. The Illumina Bead. Station 500 G The Bead. Station detects the dye-labeled fragments and provides data as to which SNP markers are present at each of 1536 marker loci in each of 96 DNA samples.

Project Overview - Goals • Generate 50, 000+ SNP assay platform • Establish higher resolution Hap. Map – Identify haplotype blocks and Tag. SNP • Demonstrate genome-wide selection works – Estimate variance components, develop models, etc – PREDICT GENETIC MERIT – Using Cooperative Dairy DNA Repository (CDDR) • Fine map QTL and discover gene causations -- QTN

Post-Genome Sequencing …. What is the Rate-Limiting Step?

PHENOMICS……. Adaptability / Functionality? ? ?


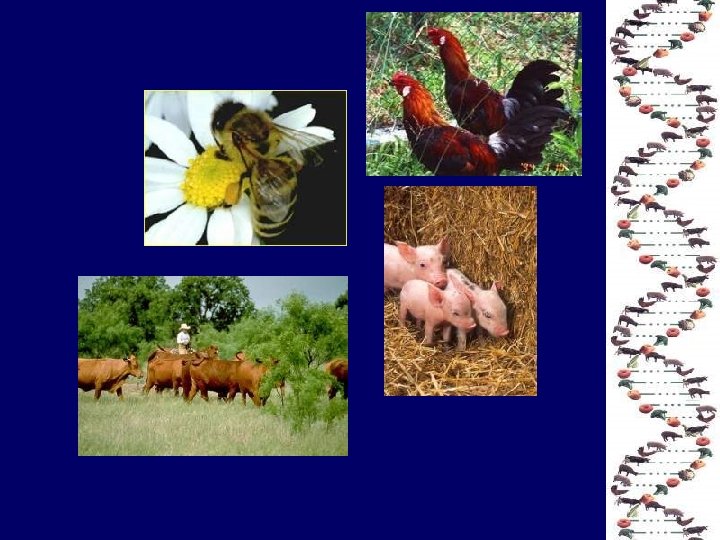
Genomics Research Ø Production and production components Ø Type Ø Feed efficiency – expensive to measure Ø Reproduction- dissect components Ø Genetic resistance to disease Ø Select for multiple traits Ø Management “by genotype” – precision mgt

Genomics Research – Host. Pathogen Interaction Ø Pr. P Gene – Scrapie, CWD, BSE? Ø FMD, Avian Influenza, PRRS Ø BRD, BVD, Johne’s Ø Mastitis resistance Ø New vaccine development Ø New drug targets / immunomodulators

Forage Livestock Production? Bioenergy? Rumen Metagenomics?

QTL Map Location X 19 18 17 16 15 14 13 12 11 10 9 8 7 6 The Y-axis is the chromosomal map position of the QTL that explains the most variation in expression levels of each gene in the expression array “Genetical Genomics” Generalized Results from a “Recombination Meets Function” Integrated Experiment 5 4 3 2 1 The X-axis is the chromosomal map position of each gene in the expression array 1 2 3 4 5 6 7 8 9 10 11 12 13 14 15 16 17 18 19 X Gene Map Location D. Pomp, 2006 EU-US

QTL Map Location X 19 18 17 16 15 14 13 12 11 10 9 8 7 6 May immediately reveal identity of QTL 5 4 3 2 1 1 2 3 4 5 6 7 8 9 10 11 12 13 14 15 16 17 18 19 X Gene Map Location Expressed genes regulated by linked (cis-acting) QTL D. Pomp, 2006 EU-US

QTL Map Location X 19 18 17 16 15 14 13 12 11 10 9 8 7 6 5 4 3 2 1 1 2 3 4 5 6 7 8 9 10 11 12 13 14 15 16 17 18 19 X May immediately reveal master regulators and key pathways, networks Gene Map Location Expressed genes regulated by linked (cis-acting) QTL Groups of unlinked expressed genes that are regulated by a single QTL D. Pomp, 2006 EU-US

QTL Map Location X 19 18 17 16 15 14 13 12 11 10 9 8 7 6 5 4 3 2 1 1 2 3 4 5 6 7 8 9 10 11 12 13 14 15 16 17 18 19 X May identify inclusive pathway or network for a QTL, and potential epistatic interactions Gene Map Location Expressed genes regulated by linked (cis-acting) QTL Groups of unlinked expressed genes that are regulated by a single QTL Expressed genes regulated by unlinked (trans-acting) QTL D. Pomp, 2006 EU-US

Systems Biology: The Legacy of Quantitative Genetics? Instead of analyzing individual components or aspects of the organism, systems biologists focus on all the components and the interactions among them, all as part of one system. The interactions of numerous genes, proteins, mechanisms and the organism's external environment, produce an individual’s phenotype.

SAVAGE, Md. and MINNEAPOLIS - June 11, 2002 Meta. Morphix signs deal to develop genetic selection tool using cattle genome -- Exclusive agreement with Cargill's Caprock Cattle Feeders and Excel Corporation expected to result in superior beef for consumers

h
2eafe8c0b088cfdf736d10da487468d0.ppt