56dc3be743a3273ccdb29885183e698a.ppt
- Количество слайдов: 68


Application Performance Monitoring One Approach John Slobodnik April 18, 2006 1: 30 p. m. CMG Canada

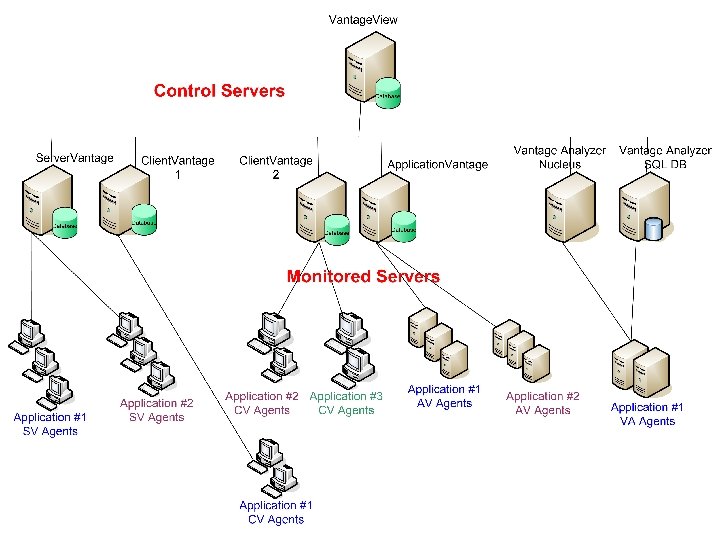
Introduction of Product Suite • Server. Vantage • Application. Vantage • Client. Vantage • Vantage. Analyzer • Vantage. View
 • Collects “server” level data. – Multiplatform: Windows, LINUX, UNIX, etc.")
Server. Vantage (SV) • Collects “server” level data. – Multiplatform: Windows, LINUX, UNIX, etc. – CPU, memory, disk, network out of the box. • Collects “application” level data. – Oracle, SQL server, Web. Logic, IPlanet, LDAP, etc. • One SV agent installed on each client server. – Runs most of the time. • Customized counters (metrics) can be written.
 • A sniffer. – Agent-based application analysis of packet level communications.")
Application. Vantage (AV) • A sniffer. – Agent-based application analysis of packet level communications. • Gathers all traffic that passes through the Network • Interface Cards (NICs). Can merge the data together from multiple servers. – Can trace, for example, SQL server traffic. • One AV agent is installed per client server. – Turned on when required. – Most often in firefighting mode.
 • Gathers data on the performance of your application. – Done")
Client. Vantage (CV) • Gathers data on the performance of your application. – Done through timings of synthetic business transactions on CV workstations (robots). • Scripting of business transactions done with a tool called QARun. – We are doing active monitoring. – There are two other options available here now: • Passive monitoring using CV • A hardware-based solution
 • J 2 EE (Java) based tool")
Vantage Analyzer for J 2 EE (VA) • J 2 EE (Java) based tool to help pinpoint exact locations of code-level performance problems. – Locates slow methods, SQL statements and transactions. • The VA agent runs inside your Application servers JVM obtaining performance metrics using Byte Code Instrumentation. – Data sent in real-time to nucleus server where it is stored and distributed to VA performance consoles. • Supports Web. Logic, Websphere, etc. • Customized component – Allows a transaction to be followed in Vantage. View.
 • Web-based portal for viewing SV, CV, AV and VA •")
Vantage. View (VV) • Web-based portal for viewing SV, CV, AV and VA • • • data for monitoring and reporting. Accessing information from the Vantage suite of tools, Vantage. View users check the status of clients, servers and networks from their intranet while also providing a near-time service level perspective on application availability and performance. The flexibility of Vantage. View enables different levels of users to view pertinent information for easy problem determination and resolution. Customized counters (metrics) can be created in the VV database.

A Few Easy Setup Steps • A summary of the steps to implement the solution: – – Install the agents. Complete Administration Set Preferences Management • Create tasks and apply blackout schedules. – Create monitoring views. – Create reports. • Optional steps taken – Create dashboards. – Create custom counters (metrics).

Install the Agents u This is a quick, procedural task that is quick to complete. – A script is run to do the install followed by any applicable patches. u The product keeps track of the level of agent installed on each server in a central repository. u SV and AV agents are installed on each server (Window, UNIX, LINUX)
.")
Administration – Configure Databases Set up the online database(s).

Configure Historical Database Define the historical database. We keep 3 months of data online. All else goes to historical database.

Control Server Configuration Set up the control servers.

Define Users Define VV user profiles.

Preferences Business applications 4 applications. Business locations Various Canadian cities. Business transactions An application (29 transactions) is broken down into 3 transaction groupings (14, 7, 8). Server groupings Production, preproduction, support, third-party, etc.

Management - Create Tasks Create a new task.

Create Tasks Select the type of server: Windows, UNIX, etc.

Create Tasks Select the counters you wish to see.

Create Tasks Add a rule for alerting.

Create Tasks Set up alerts if you want them. For example: System Thrashing, TCP Connectivity lost from WL to WL layer, CPU > 90%, etc.

Create Tasks Alert notification via pager, email, SNMP, etc. Different audiences for different tasks, DBAs, App. Support, etc. If you can do it from a command line it can be automated here: shell scripts, bat files. Perform an action based on a threshold being breached. (1) Kick off a WL thread dump based on a WL counter below a certain level. (2) Send an alert based on an ASCII pattern match. (3) Previous problems can be proactively addressed with this type of instrumentation. We examine Web. Logic logs

Create Tasks Select the appropriate data sampling interval. Key to the size of your database.

Create Tasks Start the task.

Management – Blackout Schedule • Apply a blackout schedule, if applicable. – Server. Vantage agents do not run when the application is down daily. • Client Vantage robots are also set up to run on a blackout schedule. – Implemented through CV which uses the Windows scheduler.

Create Monitoring Views § Monitoring views contain all data points. § Flexible: you can plot many different metrics on the same chart. § Business metric vs. server performance. § Application metrics vs. server metrics. § Tee. Chart Editor gives you Excel chart type functionality to modify the look of the chart.

Monitoring View Saved as a permanent monitoring view report.

Monitoring View
 Can drill into data point.")
Monitoring (ad hoc) Can drill into data point.
")
Drill into IDP Intelligent Data Point (IDP)

Create Reports • Reports contain different levels of data summarization. • From all data points to daily average. • We have created 12 hour, 2 day, 1 week and 1 month views of all reports. • Flexible: you can plot many different metrics on the same chart. • Tee. Chart Editor gives you Excel chart type functionality to modify the look of the chart.

Create Reports Select the metric source.
 desired.")
Create Reports Select the metric(s) desired.

Create Reports Select the time range.

Create Reports Select the display format.

Create Reports Schedule the report.

Create Reports Save the report.

Reports

Reports

Reports

Then the Business asked… How can we prove that the API calls are performing better? Custom program installed on WL servers. n Gathers API call response time data, converts it to a local CSV file, FTP to VV database. n n n API Response Time report created, queries VV DB. APIs split between internal vs. outsourced (for reporting purposes). n There a number of activities within each bean conversation.

API Response Time Report Sample bean conversation report.

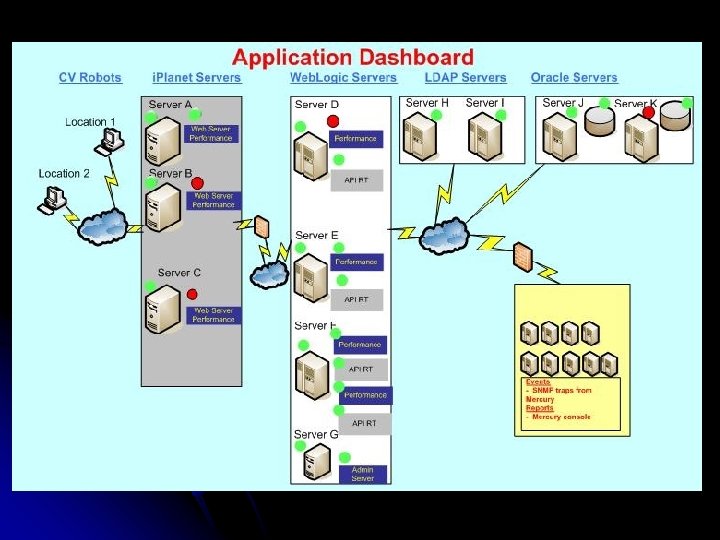
Then Management said… l We need to have a some different dashboard views. l Each level of dashboard gets more detailed. l Special dashboard for outsourced infrastructure. l Dashboards were created using the integrated VISIO (Vantage Visualizer) piece of the product.

Management Dashboard

Drill down to Application Availability
")
Application Availability (bottom)

Drill down to Heat Chart

Drill down to CNS report

Drill down to Application Scorecard
")
Application Scorecard (bottom)

Drill down to Transaction Scorecard

Drill down to Performance Summary

Drill down to Orders Report

Drill down to Session Current Count report

Drill down to WL Serviced Requests report

Geographic Dashboard

We asked ourselves… n How can we make this easier to support? n Customized metrics can be created in VV or SV. n n Make non-standard types of metrics available. Samples of some of the customization created: Disk usage of SV logs files directory. n Automated removal of SV log files. n Automate push of patches to all agents. n Send a command to run on a server and return the result. n Count the number of SV datafiles. n Agent restart. n Gather SV log files. n

More Customization n n TCP Connection test from WL layer to WL layer. Number of Orders. n n ASCII file pattern match in WL logs (3). n n n Customer purchase at store experience. Individual transaction timings is CV, adding them up is custom. Network Test / TCP Connection Test n n Automatic thread dumps Web. Logic. Average Elapsed Time n n SQL query to xml to csv to VV DB. Traceroute response time for up to 10 hops & alert. API Response time monitoring. n Average, max, min, std dev

Network Connection Test

Vantage Analyzer • Installed on production Web. Logic servers during the peak annual sales period. • Now in the pre-prod environment. – So bugs can be found before promoting new code to production.

J 2 EE Java. Scape Paints a landscape view of your J 2 EE environment. This view displays component interactions between JSPs, Servlets and Web services, Session, Entity and Message-driven Beans, as well as database usage.

Transaction Explorer The tree is organized by the largest consumers, from top to bottom. The tree can be sorted by the CPU or Transaction time period.

Transaction Scope Gives a detailed view on each individual transaction which runs through your application. Stalled Threads Shows thread-level detail of a transaction.

Method Hot. Spots Identifies the biggest consumers in your application. The view can be sorted by Transaction or CPU time.

SQLyzer Hot. Spots Lets you pinpoint the largest SQL consumers. SLA Monitoring This view displays pre-configured SLA rules and when they were last violated.

Memory Hot. Spots Locate memory leaks as well as memory allocation hot spots to help assist with server availability and performance.

Summary Management extremely pleased. Customized dashboards, peak period success, want more application’s instrumented. Business application ran almost 99. 9% availability during peak processing period of the year in large part due to this solution. Now instrumented to be more proactive than in the past. Being used as a model for the rest of the enterprise. Support teams have embraced the solution because it makes their lives easier. DBA’s, application support, system administrator’s, performance and capacity planners, etc. Significantly less time wasted determining whose problem it is (you know, 6 teams in a room…) during fire-fighting.
 282 -3342")
John. Slobodnik@bell. ca (905) 282 -3342
56dc3be743a3273ccdb29885183e698a.ppt