

d69a5e26ea5c7bb64ca4492260f196be.ppt
- Количество слайдов: 74
 AP Macro Review
 AP Exam Information 2 hrs. , 10 mins.
 AP Exam Format • 60 multiple-choice questions – 70 min. – 66% of score! • 3 free-response questions – 10 min. reading period – 50 min. to write: • 1 long FRQ (16% of score) • 2 short FRQs (8. 5% each) • No calculators!
 FRQ Words • “Show”: diagram or draw w/ correct labeling • “Explain”: take reader through all of the steps (graphs and symbols are acceptable!) • “Identify”: provide a specific answer (could be list or a label on a graph without any explanation) • “Calculate” means to use math (show your work!)
 Macro Topics I. Basic Economic Concepts: 8– 12% II. Measurement of Economic Performance: 12– 16% III. National Income & Price Determination: 10– 15% IV. Financial Sector: 15– 20% V. Stabilization Policies: 20– 30% VI. Economic Growth: 5– 10% VII. Open Economy: Inter. Trade & Finance: 10– 15%
 Graphing Review x- and y- axis? slope? positive correlation? negative correlation?
 Unit 1 Basic Economic Concepts: 8– 12%
 Types of Econ. Systems • Command • Market • Mixed Economy
 Key Assumptions • Rational choice: self-interest o Profit maximization • Marginal costs o Costs vs. benefits o MB=MC • Ceteris Paribus o all factors constant
 Factors of Production 1. Land § Resources § RENT 2. Labor § Human capital § WAGES 3. Capital (Investment) § Tools, machines, factories § INTEREST 4. Entrepreneurship § PROFIT
 Scarcity • wants vs. needs • “trade-offs” Opportunity Cost • next best alternative use for a resource • NO FREE LUNCHES
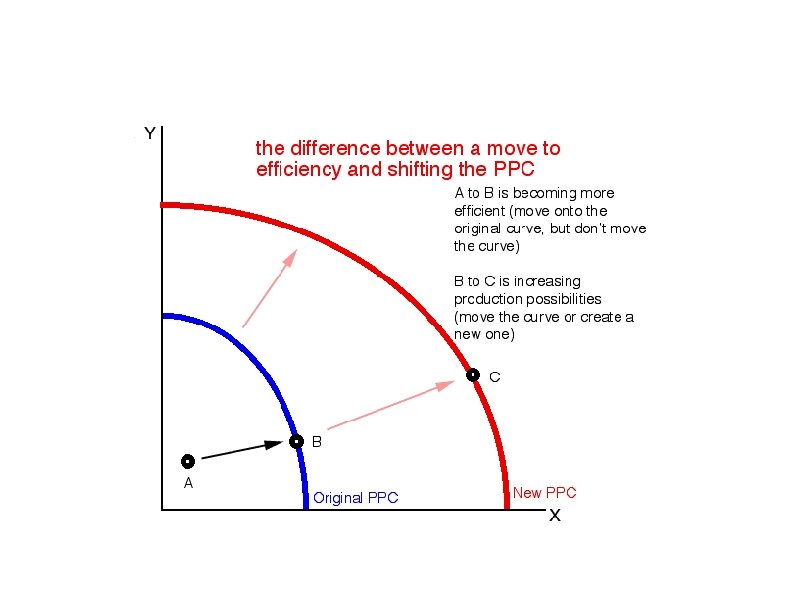
 The PPC Curve • PPC = graph showing all possible combinations of output * fully employing ALL resources • Straight = Constant Cost. • Curve = increasing opp. cost
 Production Possibilities Curve Quantity of Computers Produced 3, 000 D C 2, 200 2, 000 A Production possibilities frontier B 1, 000 0 300 600 700 1, 000 Quantity of Cars Produced
 Shape of PPC/PPF cars shirts computers linear – constant oppty costs; goods that use similar inputs curved – increasing oppty costs; goods that require specialized inputs – some resources better suited to making 1 good vs. another
 International Trade Why do countries trade? 16
 Absolute Advantage v. Comparative Advantage • absolute advantage: faster, more efficient • comparative advantage: lower opportunity cost SPECIALIZATION: producing according to the comparative advantage
 Example #1 • Which country has absolute advantage: – in beef? – in chicken? beef chicken Canada 6 3 France 8 2
 Example #1 • Which country has comparative advantage: beef 3/6 = 1/2 Canada France 6/3 = 2 6 3 2/8 = 1/4 – in beef? – in chicken? chicken 8/2 = 4 8 2
 30 The US Specializes and makes") International Trade USA 45 Brazil 40 Sugar (tons) 30 The US Specializes and makes ONLY Wheat Sugar (tons) 35 25 20 15 30 Brazil Makes ONLY Sugar 25 20 15 10 10 5 5 0 5 10 15 20 25 30 Wheat (tons) 0 5 10 15 20 Wheat (tons) 20
International Trade USA 45 Brazil 40 Sugar (tons) 30 The US Specializes and makes ONLY Wheat Sugar (tons) 35 25 20 15 30 Brazil Makes ONLY Sugar 25 20 15 10 10 5 5 0 5 10 15 20 25 30 Wheat (tons) 0 5 10 15 20 Wheat (tons) 20
 Brazil 10 (1 W") Wheat USA 30 Sugar 30 (1 W costs 1 S) Brazil 10 (1 W costs 2 S) (1 S costs 1 W) 20 (1 S costs 1/2 W) Which country has a comparative advantage in wheat? 45 Comparative advantage in sugar? Sugar (tons) Which country should EXPORT Sugar? 35 30 Which country should EXPORT Wheat? 30 Which country should IMPORT Wheat? 25 25 Which country should IMPORT Sugar? 20 Sugar (tons) 1. 2. 3. 4. 40 20 15 15 10 15 20 25 30 Wheat (tons) 5 10 15 20 Wheat (tons) 21
Wheat USA 30 Sugar 30 (1 W costs 1 S) Brazil 10 (1 W costs 2 S) (1 S costs 1 W) 20 (1 S costs 1/2 W) Which country has a comparative advantage in wheat? 45 Comparative advantage in sugar? Sugar (tons) Which country should EXPORT Sugar? 35 30 Which country should EXPORT Wheat? 30 Which country should IMPORT Wheat? 25 25 Which country should IMPORT Sugar? 20 Sugar (tons) 1. 2. 3. 4. 40 20 15 15 10 15 20 25 30 Wheat (tons) 5 10 15 20 Wheat (tons) 21
 International Trade TRADE SHIFTS THE PPC! USA 45 Brazil 40 AFTER TRADE 35 30 Sugar (tons) 30 25 20 15 25 AFTER TRADE 20 15 10 10 5 5 0 5 10 15 20 25 30 Wheat (tons) 0 5 10 15 20 Wheat (tons) 22
 23
23
 Demand • Consumers’ willingness AND ability to buy an item at a given price *a behavior The Law of Demand • Price determines quantity demanded • inversely related • lower price = higher quantity demanded
 1. Income Effect o More money = ? 2. Substitution Effect o when apples are expensive & their substitutes (pears) are relatively cheaper, I buy less apples & more pears 3. Diminishing Marginal Utility o each additional unit gives less marginal utility (“happy points”)
 •") Changes in Demand • Increase in Demand: o Demand Curve shifts “outward” (right) • Decrease in Demand: o Demand Curve shifts “inward” (left) • PRICE DOES NOT CHANGE DEMAND!
Changes in Demand • Increase in Demand: o Demand Curve shifts “outward” (right) • Decrease in Demand: o Demand Curve shifts “inward” (left) • PRICE DOES NOT CHANGE DEMAND!
 P D 1 D 2 Q Increase in Demand
 P D 2 D 1 Q Decrease in Demand
 Changes in Demand: “T. R. I. P. E. ” • Demand curve SHIFT: o Tastes & Preferences o Related Goods (complements & substitutes) o Income o Population o Expectations
 Supply • Producers willingness AND ability to sell a good/service The Law of Supply • • price determines QUANTITY DEMANDED Directly correlated lower price = ? Law of MC: more costly to produce 2 than 1…
 Changes in Supply • Increase in Supply o Supply Curve shifts outward • Decrease in Supply o Supply Curve shifts inward • PRICE DOES NOT CHANGE SUPPLY!
 P S 1 S 2 Q Increase in Supply
 P S 2 S 1 Q Decrease in Supply
 Changes in Supply: “N. I. C. E. J. A. G. ” • Natural/Manmade events (ie: hurricane) • Input Costs • Competition • Expectations • Joint-supply (hot dog demand goes up…buns? ) • Alternative goods (instead of coffee? ) • Government action (taxes, regs, subsidies)
 P Market Equilibrium S p 1 D q 1 Q • supply = demand • a single price & quantity for good/service
 Changes in equilibrium • Demand increases: PL? Q demanded? • Demand decreases: PL? Q demanded? • Supply increases: PL? Q demanded? • Supply decreases: PL? Q demanded?
 P Increase in Demand S p 2 p 1 D 1 q 2 P↑&Q↑ Q D 2
 Decrease in Demand P S p 1 p 2 D 2 q 1 P↓ & Q↓ Q D 1
 P Increase in Supply S 1 S 2 p 1 p 2 D q 1 q 2 P↓&Q↑ Q
 Decrease in Supply S 2 P S 1 p 2 p 1 D q 2 q 1 P↑ & Q↓ Q
 Simultaneous Changes • If supply & demand both increase? • PL indeterminate, Q ↑ • Supply & demand both ↓? • PL indeterminate, Q ↓
 Decrease in Supply w/ Simultaneous Increase in Demand P S 2 S 1 p 2 p 1 D 1 q 1 P↑ & Q ? Q D 2
 Increase in Supply w/ Simultaneous Decrease in Demand P S 1 S 2 p 1 p 2 D 2 q 1 P↓ & Q? D 1 Q
 *a surplus • price floor: minimum") “Disequilibrium” • Price higher than Eq price (Qs>QD) *a surplus • price floor: minimum price (ie: minimum wage) • Price lower than Eq price (Qs
“Disequilibrium” • Price higher than Eq price (Qs>QD) *a surplus • price floor: minimum price (ie: minimum wage) • Price lower than Eq price (Qs
 P S px pe D qd") Price floor (Price, px, above Equilibrium Price, pe) P S px pe D qd qe qs Q If price is px, then qd < qs. : surplus exists (surplus = qs – qd)
Price floor (Price, px, above Equilibrium Price, pe) P S px pe D qd qe qs Q If price is px, then qd < qs. : surplus exists (surplus = qs – qd)
 P S pe px D qs") Price ceiling (Price, px, below Equilibrium Price, pe) P S pe px D qs qe qd Q If price is px, then qs < qd. : shortage exists (shortage = qd – qs)
Price ceiling (Price, px, below Equilibrium Price, pe) P S pe px D qs qe qd Q If price is px, then qs < qd. : shortage exists (shortage = qd – qs)
 Unit 2: Macro Measures 47
 Circular Flow Model Injections: investments & exports Leakages: savings & imports
 • market value of ALL final goods/services in a nation") Gross Domestic Product (GDP) • market value of ALL final goods/services in a nation in a year Not Counted? : • used goods • intermediate goods • non-market production • stocks, bonds, CD’s • transfer payments (ie: welfare) • ‘black market’
Gross Domestic Product (GDP) • market value of ALL final goods/services in a nation in a year Not Counted? : • used goods • intermediate goods • non-market production • stocks, bonds, CD’s • transfer payments (ie: welfare) • ‘black market’
 Expenditures Approach GDP = C + IG + XN • C = Consumption • IG = Gross Private Investment • G = Government Spending • XN= Net Exports (X) – Imports (M))
 o") Consumption • C = largest component of GDP o durable goods (cars, appliances) o non-durable goods (food, clothing) o services
Consumption • C = largest component of GDP o durable goods (cars, appliances) o non-durable goods (food, clothing) o services
 Gross Private Investment • to increase future output or productivity o capital o new construction o change in inventories
 Net Exports • X–M • exports = injection • imports= leakage
 The Income Approach • W + I + R + P Wages + Interest + Rent + Profits
 Nominal v. Real GDP • Nominal GDP: current GDP at current prices o may overstate value of production! • Real GDP: GDP measured w/ a fixed dollar o takes into account INFLATION o year to year comparisons * GDP per capita provides a better measure of well-being than GDP
 2007 FRQ 56
 The Business Cycle • ups & downs in GDP over time • Peak • Recession (contractionary) • Trough (bottom) • Recovery (expansion)
 CONSUMER PRICE INDEX • CPI: measure of overall cost of goods/services • monitors inflation • CPI “BASKET” does NOT CONTAIN ALL FINAL GOODS/SERVICES! • CPI computed by dividing price of basket in one year by price in base year & multiplying by 100
/CPI Year 1 GDP “Deflator” =") Inflation = (CPI Year 2 – CPI Year 1)/CPI Year 1 GDP “Deflator” = Nominal GDP/REAL GDP x 100
Inflation = (CPI Year 2 – CPI Year 1)/CPI Year 1 GDP “Deflator” = Nominal GDP/REAL GDP x 100
 Real & Nominal Interest Rates • nominal interest rate: not adjusted for inflation o rate a bank pays • real interest rate: adjusted for inflation Real Interest Rrate = nominal interest rate – inflation Nominal interest rate 15%. During the year inflation was 10%. What is the real interest rate? Real = 15% - 10% Real = 5%
 Unemployment • Labor force: § % of working age population • Employed: o 16 yrs & older w/ a job o part-time or full-time • Unemployed: o actively searched for a job in last 2 weeks o Unemployment rate = # of unemployed / # of people in labor force • Not in Labor Force: o Under 16, military, retired, stay home parent, fulltime students
 Types of Unemployment Frictional: o “between jobs”, new entrants, re-entrants Structural: o lack of skills or declining industry Cyclical: o o downturns in business cycle worse type Seasonal: o Migrant workers, holiday hiring
 Full Employment • occurs when there is no cyclical unemp. • “Natural Rate of Unemployment” (NRU) o economy producing at full potential o U. S. NRU is approx. 4%-5% o FE & the PPC? • Okun’s Law: every 1% increase in the u% causes a 2% decline in Real GDP
 2006 FRQ 64
 • DI = Gross Income – Taxes • households can either:") Disposable Income (DI) • DI = Gross Income – Taxes • households can either: o consume o save
Disposable Income (DI) • DI = Gross Income – Taxes • households can either: o consume o save
 MPC & MPS MPC = ΔC/ΔDI MPS = ΔS/ΔDI MPC + MPS = 1 1 – MPC = MPS 1 – MPS = MPC
 Determinants of C & S • Wealth o Increased wealth = ? • Expectations o Positive = ? • Household Debt o High Debt = ? • Taxes o Taxes Inc. = ?
 vs. Nominal (ir%) • Interest: cost to borrow money • Real interest") Real (ir%) vs. Nominal (ir%) • Interest: cost to borrow money • Real interest rate subtracts inflation (π%) Real ir% = ir% - π%
Real (ir%) vs. Nominal (ir%) • Interest: cost to borrow money • Real interest rate subtracts inflation (π%) Real ir% = ir% - π%
 The Investment Demand Curve real% 5% 3% ID $2 trillion $3 trillion IG
 Loanable Funds Market • market where money is borrowed • borrowers: households, firms, gov’t
 ir% SLF r DLF q QLF Loanable Funds Market in Equilibrium
") The Spending Multiplier • Spending Multiplier = 1/MPS OR? 1/ 1 -MPC • (+) w/ increase in spending • (–) decrease in spending
The Spending Multiplier • Spending Multiplier = 1/MPS OR? 1/ 1 -MPC • (+) w/ increase in spending • (–) decrease in spending
 The Tax Multiplier • When gov’t taxes…multiplier works in reverse o money is leaving the circular flow o TAX CUT = higher multiplier
 • BBM always") The Balanced Budget Multiplier • Gov’t spending = Gov’t revenues (taxes) • BBM always = 1! MPS/ MPS = 1
The Balanced Budget Multiplier • Gov’t spending = Gov’t revenues (taxes) • BBM always = 1! MPS/ MPS = 1